
Timing & trends
Thursday’s, April 13th, 2017, trading displayed some evidence of “exhaustive selling”. It is still trading well above its 200- simple moving day average. The BULLISH RALLY has not stopped.
In identical occurrences, based on historical data, the one-month returns, during which the SPX rallied 15 out of 16 times with a greater than 5-to-1 reward-to-risk ratio. “Emotional selloffs” occur in strong uptrends which have only presented themselves with greater buying opportunities. This is the predominate case we are facing during this month of April.
Wave A is the first of three waves in the corrective phase. Corrections are almost always more difficult to identify than impulse waves and most investors confuse them as interim corrections. Volume might increase in Wave A and volatility will also rise, although not nearly enough to imply a bottom.
Wave B tends to be the most difficult to identify. The volume of Wave B tends to be lower than that of Wave A. Wave B will consist of three sub waves and should retrace at least .62 percent of Wave A.
Wave C is often very impulsive and marks end of the current corrective phase. Volume may be higher in Wave C than in Wave A. Wave C is made up of five sub waves and terminates beyond the end of Wave A. Some studies suggest that Wave C should not continue beyond 1.618 times Wave A, but this is not a rule
The cart below shows the worst-case scenario based on current analysis. The low put in during the month of March could be in fact a bottom as there was a very small A-B-C correct pattern in March already.
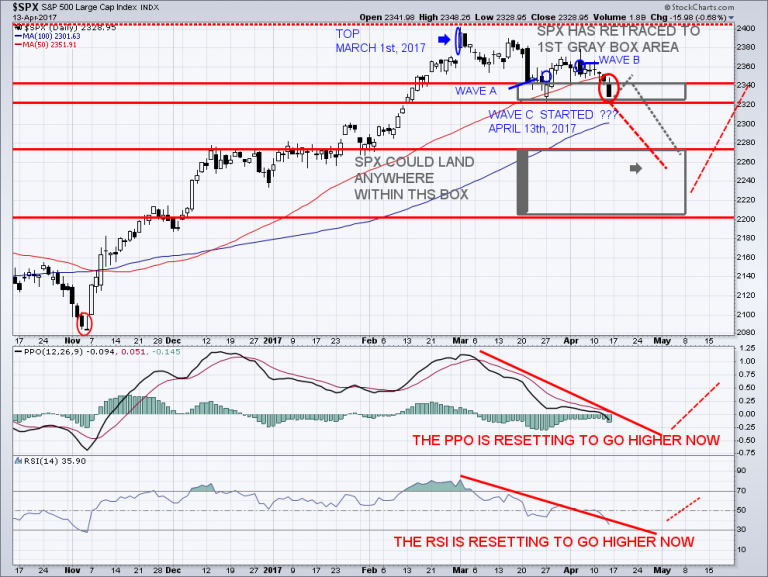
The momentum oscillators are now working themselves to the oversold levels. The SPX is in the midst of its Corrective Wave ‘A-B-C’ that has further to go on the downside.
There is no desire to rally. It appears that SPX is beginning its’ Wave C and it should see follow thru to the downside the next couple of weeks. The bond markets and gold markets will continue to have a very short-term run up, trading with a negative correlation to stocks.
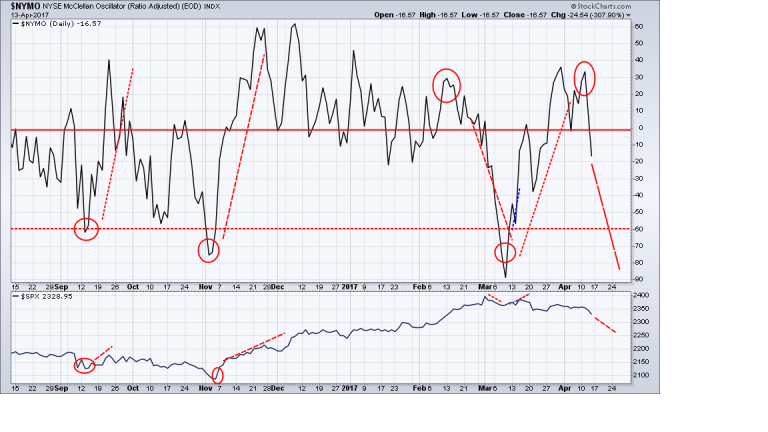
What is the ‘McClellan Oscillator’
The Mc Clellan Oscillator is the most revered market breadth indicator. It is primarily used for short term trading. As one can see, when it closes under zero, the SPX starts its correction!
For now, I am just taking it play by play, but I think this scenario will work out. It should most likely come at least very close to this big picture!
If you want to take advantage of my insight and expertise as I can help you to grow your trading account. Tune in every morning for my video analysis and market forecasts at TheGoldAndOilGuy.com on all ‘asset classes’ and new ETF trade opportunities.
Momentum Is Resetting!
The SPX was the latest index to end a long streak of momentum. It closed below its 50-day moving average for the first time in more than 105 days. It also set a new all-time high during its parabolic move. Still, half of its 10 major sectors are still trading above their own moving averages. With momentum being this strong, it has historically led to above average returns 90 percentage of the times within three months.
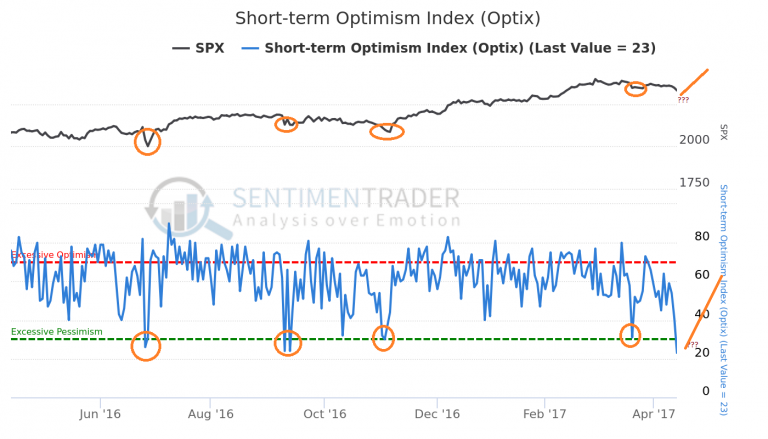
Latest Value:
Last Reading: 23.0: APRIL 13th, 2017
Extreme Values:
- Excessive Optimism: 70.0
- Excessive Pessimism: 30.0
Any values that drops below 40%, are showing “excessive pessimism”. The current reading is below 30%, now displaying the extreme, and is suggesting that a market bounce is likely to come soon!
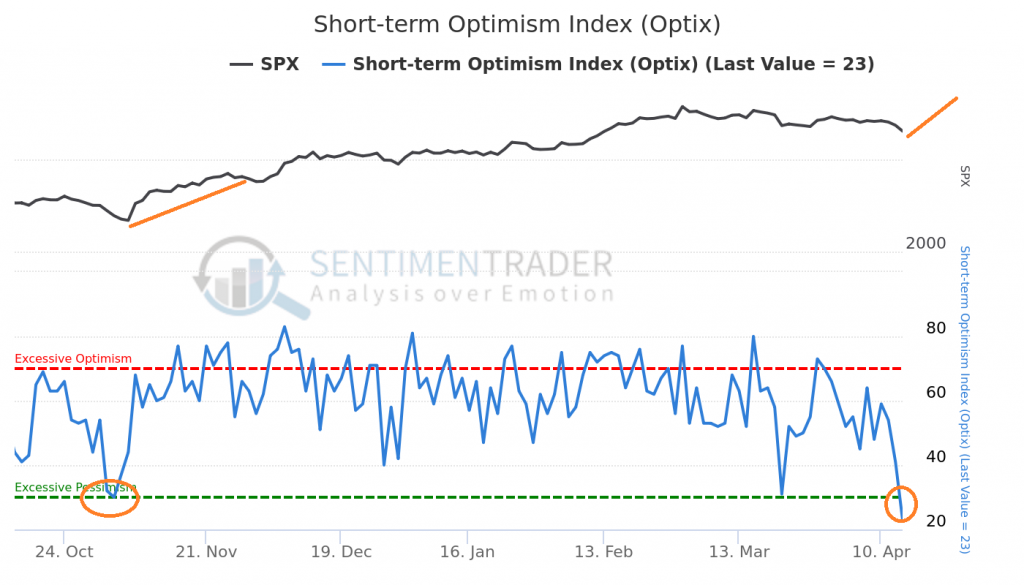
On the six-month chart, which is shown below, one can view the strength of the next SPX rally will be very strong and unexpected by most traders. As I have mentioned in my recent market analysis, I believe the SPX is getting setup for a wonderful summer rally which will take it into the 2500 SPX range!
On a short -term basis, we are at that point where sentiment is overly ‘pessimistic’. Seasonality is turning positive and any further selling should be erased by the time when everyone pays Uncle Sam. When short -term sentiment becomes pessimistic, it creates a new BUY SIGNAL to re-enter the SPX long!
The Pessimism is getting close to its’ Extreme Value reading to register a good bottoming indication for prices. This fit well with my expectation from other indicators for a low this month.
Taking the impossible and making it possible!
As the stock market is in a corrective mode, breakouts and other reliable bullish patterns which every trader and his brother use have a greater risk of failing.
Momentum moves are significant, but normally short lived. My momentum strategy Momentum Reversal Method (MRM), is an ideal swing trading opportunity for quick profits. It captures short term 3-10 day “swings” in the market. This is the core benefit of my swing trading method, giving the trader the opportunity to obtain a short-term gain without long term risk exposure.
Recent Trading Results Include:
- UGAZ 74%
- ERX 7.7%
- NUGT 112%
- URA 2.7%
I currently have active trades which I anticipate will take off with the next market swing!
By sticking to my strict money management plan and being well prepared a trader has the opportunities to obtain great returns from short-term market movements.
Chris Vermeulen
www.TheGoldAndOilGuy.com
www.ActiveTradingPartners.com


Perspective
The key line is about banks pulling back and “new players with looser lending are stepping in”. This reminds of the culmination of the 1772 Bubble. The Ayr Bank was newly formed and became an aggressive lender in the final stages of that mania. The partners were out to show the older banks what the world of new finance was all about. The collapse ruined most of its investors and became a subject in Adam Smith’s book, The Wealth of Nations. An inquiry completed in 1777 listed some reasons for the failure. One was “giving credit too easily”.
As with most great bubbles, that one climaxed in June and then the contraction started. As usual, the panic got underway in late September and cleared in November. The post-bubble contraction ran the usual twenty years.
For new readers, the great bubbles completed in 1720, 1772, 1825, 1873, 1929 and 2007. All had common characteristics and consequences.
And Papua New Guinea—it was only a few decades ago when the national pastime was headhunting. The key concept in the proposed issue is “dollar bonds”, due and payable in New York in dollars.
Stock Markets
For some reason, the song Up Up and Away comes to mind. It was a big hit in 1967 by a group called the Fifth Dimension. The lines include “My beautiful, my beautiful balloon”.
https://www.youtube.com/watch?v=5akEgsZSfhg
That was close to the peak in the stock market as deflated by the CPI. That bear market ran until 1982 when in painfully abandoning “inflation”, the world discovered inflation in financial assets. With some violence, this has continued. But it seems that inflation in Treasuries blew out in July and inflation in junk bonds and equities is in full bubble mode now.
This page had reckoned that whatever was bothering the markets would clear in October. On November 3rd, the ChartWorks noted a Downside Capitulation on the S&P.
We began to describe the rally as “Rational Exuberance”, due to a pro-business administration and thought it could run into March.
Considering the developing technical excesses in February, we dropped “Rational” and just called it “Exuberance”.
Two weeks ago, we noted that industrial commodities could be firm into April-May, which would help credit spreads and equities.
Also with dropping “Rational” we noted that a Big Rounding Top was possible.
A recent discovery has been that low-grade stuff such as HYG would soar up to a Daily RSI and the stock market would peak some three weeks later. The key examples were 2000 and in 2007. At a lower level, the link worked on the rebound to May 2008.
The RSI reached 77 on February 27 and the S&P set a pop-up high at 2400 on March 1st. The next high was 2390 in the middle of the month. Close enough to consider that this “model” could be effective.
As a wrap to the potential rollover, NYSE Margin has been going straight up. The report is always a month behind, but the first downtick with a MACD Sell could conclude that the bull market is over.
Within the senior indexes, some individual stocks are clocking technical excess. Last week we mentioned some names that were standing out. This week, we can add Amazon, which has accomplished super technical excesses (Chart follows).
The way to wrap this up, is that there is a seasonal positive into May. But if the S&P, base metals and HYG slip below their 50-Day moving averages it says that the party is getting tired.
The nature of the party has been intriguing. Following the natural rise in market rates of interest, the Fed has been forced to increase its rate – in a not-strong economy. In becoming speculative, the boom in financial assets has been forcing short rates up since June. Makes sense to us. Especially when we keep in mind that rising quality short rates, such as T-Bills, indicate the boom is on. When shorted-dated market rates of interest decline it indicates the party is ending.
And the conduit of this kind of a boom has been banks and financials. Particularly, the Broker-Dealers which highs have led the highs in the senior indexes. The index is at 210, and the 20-Week ema is at 209.9. Taking it out would be significant. The chart follows.
By way of a wrap for this sector, there is the usual positive seasonal going into May when a speculative market can expire. Often this relates to a key reversal in credit spreads and the yield curve. This has become an exciting stock market that has pushed technical and sentiment measures to exceptional readings. Like a tattoo, these are indelible and it is worth recalling that the tattoo machine does not have an eraser.
At this season of the year, how does Mother Nature treat such excesses?
By a significant liquidation of unsupportable positions.
Funds may be holding investment-grade stocks, but market forces have driven them to speculative prices.
In the past, after such seasonal excesses Mother Nature has arranged for seasonal lows in the fall.
Credit Markets
The long bond (TLT) rallied to 121.87 at the first of the month. This is the fourth attempt to get through 122. This could trade around the 120 level for some weeks. There is support at the 50-Day ma at 119.50. Getting through 122 is possible, but it could take into June.
Two weeks ago, we noted that lower-grade stuff (JNK) could recover for a while. The swing on the Daily RSI from overbought to oversold was impressive.
There is support at the 50-Day ma at the 87 level. It could get to 88, but we are concerned that after June low-grade bonds could turn down.
With a rally possible in TLT, this could move spreads to widening.
Subprime Lending

Of course, so far negative equity hasn’t been a problem for car buyers because lenders have been all too willing to roll those debt balances into new loans. And, courtesy of low rates and stretched out terms, consumers haven’t really cared that their debt balance are ballooning so long as their monthly pymnts remain low.
Source: Morgan Stanley, Zero Hedge
Auto Subprime Default Rates

Source: UBS
- The current cycle of failures is rising faster than in 2008.
Valuation
- Approaching 2 standard deviations beyond the mean.
- Not seen since the bubble that climaxed in March 2000.

Amazon
Huge Upside Exhaustion and Sequential Sell

- The readings are in Hourly, Daily, Weekly and Monthly.
- One dimension above a “Trifecta Sell”.
Broker-Dealers (XBD)

- Sequential (9) Sells have preceded important highs.
- Highs for Broker-Dealers can precede the peak for the senior indexes.
Listen to the Bob Hoye Podcast every Friday afternoon at TalkDigitalNetwork.com

 1. Gold Price Rally: Enjoy The Ride
There’s no question that gold can pull back at any time now, given the extent of the rally, but even a decline to $1225 would only add to the positive look of the chart.
2. Marc Faber: Central Bankers Desperate to Keep Colossal Global Debt Bubble Inflated
Marc thinks the Fed will only raise rates once more in 2017 before the next global financial crisis. He thinks the Federal Reserve will reverse course, start lowering interest rates again and do a large QE program. Central bankers are routinely coordinating monetary and interest rate policy as well as exchange rates with each other to prevent a “colossal debt bubble” from bursting.
3. Sentiment: Market is Waiting On The Catalyst to Go Higher
April marks the end of what is historically the best six months for DJIA and the S&P 500. Since 2006, April has been up eleven years in a row with an average gain of 2.6% to reclaim its position as the best DJIA month since 1950.And there’s no end in sight.
Todd Market Forecast for Wednesday April 12, 2017
Available Mon- Friday after 6:00 P.M. Eastern, 3:00 Pacific.
DOW – 59 on 1100 net declines
NASDAQ COMP – 31 on 1050 net declines
SHORT TERM TREND Bullish
INTERMEDIATE TERM Bullish
STOCKS: Most of our indicators are looking for a trading bottom, but it takes more than this. The market has to demonstrate that it can actually move higher and so far that hasn’t happened.
The main problem continues to be geopolitical. There is the potential for armed conflict in Korea and the U.S. and Russia aren’t getting along too well in the Middle East.
GOLD: Gold rose another $12. A sharp dollar drop and geopolitics remain a factor.
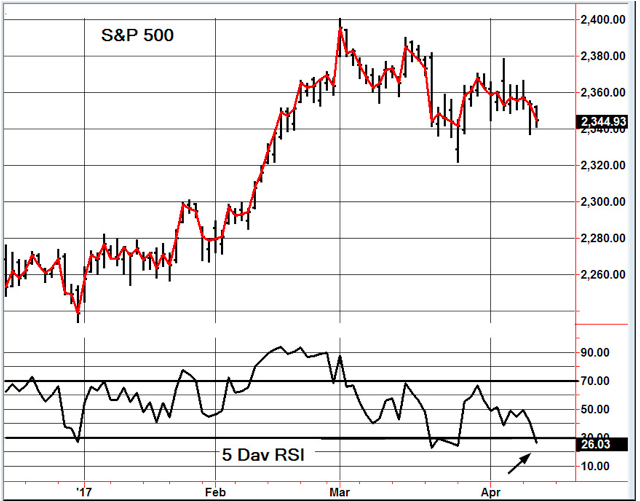
CHART The S&P 500 is finally oversold as measured by 5 day RSI. This is normally a positive. It would help if world tensions would lessen.
BOTTOM LINE: (Trading)
Our intermediate term system is on a buy.
System 7 We are long the SSO from 83.54. Stay with it.
System 8 We are in cash. Stay there.
System 9 We are in cash. Stay there.
NEWS AND FUNDAMENTALS: Oil inventories shrank by 2.2 million barrels. Last week they expanded by 1.6 million. On Thursday we get jobless claims, the PPI-FD and consumer sentiment.
INTERESTING STUFF Adversity has the effect of eliciting talents, which in prosperous circumstances would have lain dormant. ——-Horace Roman poet.
TORONTO EXCHANGE: Toronto lost 79.
BONDS: Bonds surged again. A flight to safety?
THE REST: The dollar crashed. President Trump said it was too high. Silver had a sharp rally. Crude oil fell back in spite of lower inventory numbers.
Bonds –Bullish as of April 3.
U.S. dollar -Bullish as of March 28.
Euro — Bearish as of March 28.
Gold —-Bullish as of April 11.
Silver—- Bullish as of April 11.
Crude oil —- Bullish as of March 30.
Toronto Stock Exchange—- Bullish from January 22, 2016
We are on a long term buy signal for the markets of the U.S., Canada, Britain, Germany and France.
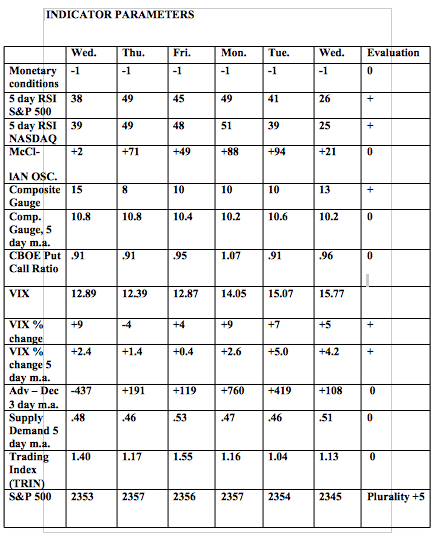
Monetary conditions (+2 means the Fed is actively dropping rates; +1 means a bias toward easing. 0 means neutral, -1 means a bias toward tightening, -2 means actively raising rates). RSI (30 or below is oversold, 80 or above is overbought). McClellan Oscillator ( minus 100 is oversold. Plus 100 is overbought). Composite Gauge (5 or below is negative, 13 or above is positive). Composite Gauge five day m.a. (8.0 or below is overbought. 13.0 or above is oversold). CBOE Put Call Ratio ( .80 or below is a negative. 1.00 or above is a positive). Volatility Index, VIX (low teens bearish, high twenties bullish), VIX % single day change. + 5 or greater bullish. -5 or less, bearish. VIX % change 5 day m.a. +3.0 or above bullish, -3.0 or below, bearish. Advances minus declines three day m.a.( +500 is bearish. – 500 is bullish). Supply Demand 5 day m.a. (.45 or below is a positive. .80 or above is a negative). Trading Index (TRIN) 1.40 or above bullish. No level for bearish.
No guarantees are made. Traders can and do lose money. The publisher may take positions in recommended securities.
The current silver price trend is once again at a critical juncture. It has been four years since the price of silver crossed an important trend line. However, the present setup will result in either another correction lower, or a much higher price.
This is a ten-year chart which shows the current trading setup for silver:
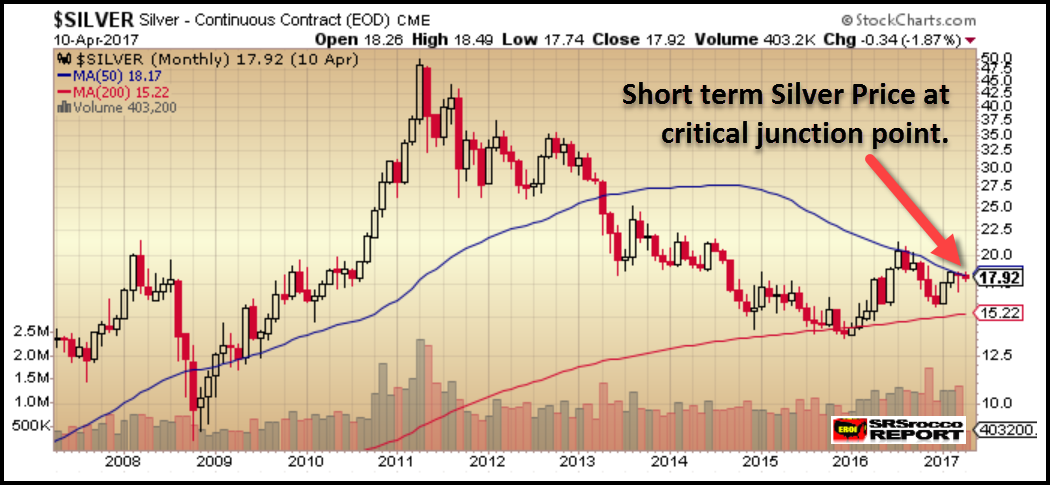
The blue line represents the 50 month moving average,and the red line, the 200 month moving average. Since the price of silver fell below the blue line at the beginning of 2013, its support has been the red line. It did not fall below the red line at its low in the beginning of 2016 and has bounced twice off the blue line, which is now acting as resistance by traders.
Currently, the silver price is hitting up against the 200 month moving average blue resistance line. If the silver price breaks above and closes above it, we could see a much higher silver price. However, if does not, then we could experience another short-term correction.
Looking at the current silver COT REPORT, there is a record commercial short position against silver. The Commercial short positions are from the large bullion banks:

The red lines at the bottom of the chart represent the total Commercial net short positions in silver. As we can see, it is at a record high. This high Commercial net short silver position normally means the silver price will likely head lower…. over the short term.
That being said, I have become less concerned about the SHORT-TERM silver price movement. While some investors are able to trade and make money trading silver, I am not one of them. My focus on silver is to hold onto it for the LONGER-TERM. Short term silver price movements are not a concern when we focus on the disintegrating energy and economic fundamentals.
Some precious metals investors have become frustrated or complacent due to the low silver price. This is understandable because some may have purchased silver at a higher price and feel as if they made the wrong investment decision. However, acquiring physical silver should be done over a period of time and be held as a SAFE HAVEN for the future…. just like any other retirement plan.
The BIG difference between owning physical silver and most paper retirement plans, is that the value of most retirement assets will likely plunge in value in the future while the price of silver will likely be much higher. Unfortunately, most investors are either too impatient, fickle or lack the ability to understand this LONG-TERM fundamental setup.
Lastly, if Americans who are mainly invested in STOCKS, BONDS and REAL ESTATE, diversified into a small 2-5% allocation of physical gold and silver, it would totally overwhelm the market…. forget about the rest of the 7 billion people in the world.
Which is precisely why the MANIPULATION of gold and silver has been done mainly through psychology, rather than price. Why? Because the current algorithm pricing mechanism for gold and silver is based on their cost of production. So, to see a current $18 silver price and $1,275 is not that ridiculous if it is based upon what it cost to produce them.
But, gold and silver behave much differently than most commodities, energy, good and services. While most commodities and energy are consumed, a lot of gold and silver are saved. So, gold and silver must be valued differently. If individuals realized the dire energy predicament we are facing in the future, they would realize it would be prudent to own some physical gold and silver. However, they are being mislead by the Mainstream media, so they cannot really be blamed.
When the markets finally crack…. the Fed and Central Banks may have one last RABBIT to pull out of the hat, and that would be a HYPERINFLATIONARY event. Unfortunately, this will not last long and will end quite badly.
Thus, when we reach this point… there is NO GOING BACK. The United States and world will look like a much different place and at that point, it will be too late to sell paper and buy gold and silver.
Check back for new articles and updates at the SRSrocco Report.

-
I know Mike is a very solid investor and respect his opinions very much. So if he says pay attention to this or that - I will.
~ Dale G.
-
I've started managing my own investments so view Michael's site as a one-stop shop from which to get information and perspectives.
~ Dave E.
-
Michael offers easy reading, honest, common sense information that anyone can use in a practical manner.
~ der_al.
-
A sane voice in a scrambled investment world.
~ Ed R.
Inside Edge Pro Contributors

Greg Weldon

Josef Schachter

Tyler Bollhorn

Ryan Irvine

Paul Beattie

Martin Straith

Patrick Ceresna

Mark Leibovit

James Thorne

Victor Adair