
Timing & trends
The stock markets have enjoyed a “Trump bump.” Despite a recent “Trump fade,” North American stock markets are positive for the year and economic numbers have been fairly solid. Stock market volatility is low and recently the S&P 500® experienced a 110-day run without a 1% correction. Ev- erything just feels good. Enjoy it while it lasts.
It is not that there are ominous clouds on the horizon. There is nothing out there pointing to a sudden correction, but that does not mean that the stock market cannot correct. It can correct at any time. When everything seems just right, it is the surprises that can re-direct the stock market downwards. A healthy stock market tends to absorb the negative surprises well, with only a minor correction before heading higher once again. Or even, interpreting a typically negative event, with a positive spin. This is the type of market that we have been experiencing.
S&P 500 Technical Status
The S&P 500 is currently in a consolidation pattern with a “high” set at the beginning of March. Although the S&P 500 has had a series of lower highs, we have not established a pattern of lower lows. This pattern is neither bullish nor bearish, but it does show that the S&P 500 is looking to establish direction. A solid break above 2400 would show
that the stock market is decidedly bullish. A break below 2325 would be bearish.
Unfortunately, we are only weeks away from the period when the stock market often starts to fade as it enters into the six-month unfavorable period at the beginning of May. From a seasonal point of view, there is not a lot of time and the stock market may provide some muted gains, but the risk remains to the downside. Positive reaction from investors to strong earnings may provide some support to the market, but investors should start to become cautious at this point.


 In this week’s issue:
- Weekly Commentary
- Strategy of the Week
- Stocks That Meet The Featured Strategy

Stockscores Market Minutes – Avoiding Bias
Humans can do a good job of screwing up trades by letting their emotional bias in to the decision making. This week, I discuss that, my market analysis and the trade of the week on AKRX. Click Here to Watch
To get instant updates when I upload a new video, subscribe to the Stockscores YouTube Channel
Trader Training – Bat and Balls
Here is a test.
If a bat and a ball cost $1.10 together and the bat costs $1 more than the ball, how much is the ball?
Do you have your answer?
If you are like the majority of people, you will say that the ball costs $0.10. That is the wrong answer since that would make the bat cost $1.10 ($1 more than the ball) for total cost of $1.20.
The right answer is that the ball costs $0.05 and the bat $1.05 for a total of $1.10.
The reason most people answer this question wrong is not because they lack the intelligence to get it right. The problem is that we are trained to answer questions quickly and that leads us to be impulsive. Instead of thinking, we get lazy and say the first thing that comes in to our mind.
Many people trade the market the same way.
Particularly when trading a hot and fast moving stock, we are inclined to not think about the trade but instead act impulsively. We fear missing out on the opportunity and will make the trade for the wrong reasons. That is the law of upticks; people lose their ability to think when a stock is moving up quickly.
That is why it is important to right down your trading rules. Traders often scoff at this idea, a simple check list of rules seems childish and unnecessary. Yet, how often have you gone back to look at a losing trade that you did and realized that the trade did not fit your requirements?
Think this approach is only for fast moving day traders? Sadly no, even long term trades, those with lots of time to consider, can succumb to impulsive decision making.
We are emotional beings with an emotional attachment to our money. When considering a trade, it is easy to see what we want to see and act impulsively because it feels good to think about the profit potential. Having that check list of rules is good whether you are making a fast paced day trade or a long term position trade.

I ran the Stockscores Simple Weekly market scans for the US and Canada and looked through a lot of charts. There were not many I liked, probably because we are sitting at the cusp of the first and second quarters of the year with investors waiting to see how earnings are going to look before making their moves. However, here are two that I think have some promise for the months ahead:

1. AMX
AMX has broken its downward trend and is turning higher from a rising bottom, a good pattern for a trend reversal. Support at $13.90. 7/10.
2. MDSO
MDSO broke through $60 resistance last week that has held up for over three years. Support at $55. 7/10.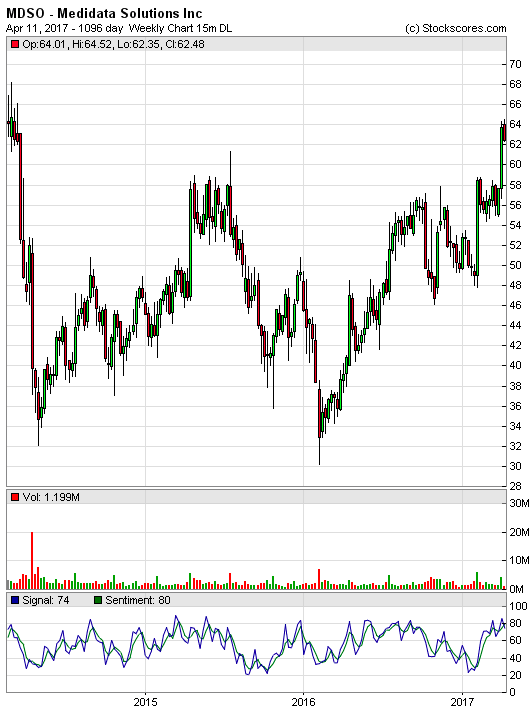
References
- Get the Stockscore on any of over 20,000 North American stocks.
- Background on the theories used by Stockscores.
- Strategies that can help you find new opportunities.
- Scan the market using extensive filter criteria.
- Build a portfolio of stocks and view a slide show of their charts.
- See which sectors are leading the market, and their components.
Disclaimer
This is not an investment advisory, and should not be used to make investment decisions. Information in Stockscores Perspectives is often opinionated and should be considered for information purposes only. No stock exchange anywhere has approved or disapproved of the information contained herein. There is no express or implied solicitation to buy or sell securities. The writers and editors of Perspectives may have positions in the stocks discussed above and may trade in the stocks mentioned. Don’t consider buying or selling any stock without conducting your own due diligence.

 Summary
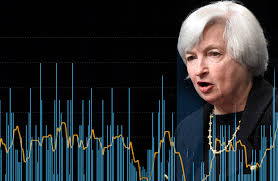
Yellen said little about the prospects of a June hike and even less about the balance sheet.
Nevertheless, she shed light on the Fed’s thinking and the importance of financial conditions.
Financial conditions have eased since the Dec. 16 and March 17 rate hikes.
Barring a premature tightening of conditions, we expect the Fed to hike in June.
Yellen’s talk after the North American markets closed was revealing even though she added little to the market’s body of knowledge about the prospects for a June hike or the issues surrounding the balance sheet. That said, she did nothing to dissuade the market from leaning toward a June hike, which through the Fed funds futures strip estimates near 63%.
Market Outlook
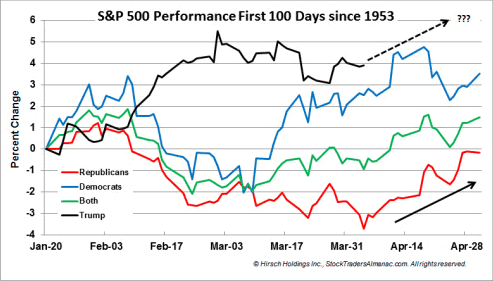
Jeff Hirsch in the Almanac Trader updated the S&P 500 Performance during the First 100 Days of new administrations since 1953 in a post titled “February Weakness Stolen, March Stolen Thunder.” Looking at the chart below March was indeed a dud. Instead of a respectable rally, S&P 500 fell 0.04% in March. It has been 78 calendar days since President Trump took office and S&P 500 has gained 3.9% which is still above historical average. Historically, March was a flat month for new Republican administrations (solid red line in chart below), but that weakness ended on average in early April and the S&P 500 rallied nearly 4% by the end of the month (black arrow). A similar result this year would put S&P 500 off this chart by the end of the month. Recently we pointed out April marks the end of what is historically the best six months for DJIA and the S&P 500. Since 2006, April has been up eleven years in a row with an average gain of 2.6% to reclaim its position as the best DJIA month since 1950. April is second best for S&P and fourth best for NASDAQ (since 1971).
The CBOE Volatility Index (VIX) is known as the market’s “fear gauge” because it tracks the expected volatility priced into short-term S&P 500 Index options. When stocks stumble, the uptick in volatility and the demand for index put options tends to drive up the price of options premiums and sends the VIX higher. Recently we pointed out “…as equity prices have faltered a bit the past few weeks’ investors are starting to show signs of nervousness by driving the VIX higher…” As evidenced in the updated chart below this trend continues as investors are becoming concerned about the White House fiscal agenda and increasing global restlessness.

The American Association of Individual Investors (AAII) Sentiment Survey measures the percentage of individual investors who are bullish, bearish, and neutral on the stock market for the next six months; individuals are polled from the ranks of the AAII membership on a weekly basis. The current survey result is for the week ending 04/06/2017. Pessimism among individual investors about the short-term direction of stock prices rose to nearly 40%, according to the latest AAII Sentiment Survey. Bearish sentiment, expectations that stock prices will fall over the next six months, rose 2.2 percentage points to 39.6%. The increase keeps pessimism at or above its historical average of 30.5% for the eighth consecutive week and the 11th out of the last 12 weeks. At the same time, optimism fell below 30%. Bullish sentiment, expectations that stock prices will rise over the next six months, fell 1.9 percentage points to 28.3%. This is the 11th time out of the last 12 weeks that optimism is at or below its historical average of 38.5%. This week’s results put optimism very close to the bottom of its typical range and pessimism very close to the top of its typical range. A bullish sentiment reading below 28.1% would be unusually low (more than one standard deviation below average.) A bearish sentiment reading above 40.0% would be unusually high (more than one standard deviation above average). Of the two, unusually low bullish sentiment readings have a much stronger record as a contrarian indicator, with the S&P 500 realizing a median gain of 6.3% over the following six-month periods. Neutral sentiment, expectations that stock prices will stay essentially unchanged over the next six months, declined 0.3 percentage points to 32.1%. The historical average is 31.0%.

The National Association of Active Investment Managers (NAAIM) Exposure Indexrepresents the average exposure to US Equity markets reported by NAAIM members. The blue bars depict a two-week moving average of the NAAIM managers’ responses. As the name indicates, the NAAIM Exposure Index provides insight into the actual adjustments active risk managers have made to client accounts over the past two weeks. The current survey result is for the week ending 04/05/2017. First-quarter NAAIM exposure index averaged 92.85%. Last week the NAAIM exposure index was 68.95 %, and the current week’s exposure is 67.47%. Money managers are holding on waiting for some strong economic data before bidding equity prices higher. The good news is the institutional investors are refusing a wholesale selloff despite opportunities to do so. Volatility is creeping higher, but strong quarterly earnings reports or perceived progress on some of the proposed tax cut related legislation out of Washington could ignite investors to rotate money back into equities driving the NAAIM Exposure Index higher.

Trading Strategy
A recent American Association of Individual Investor (AAII) survey how the potential impact that President Trump could have on the domestic and global economy continues to cause uncertainty or concern among some investors, while encouraging others. They indicated the prevailing level of valuations and the lack of downside volatility have increased concern about the potential for a forthcoming drop in stock prices. The AAII asked members to explain how the success or failure of the Trump administration’s proposed policies influence their outlook for stock prices. Responses were mixed. Nearly one out of four respondents (24%) think the president’s policies will have a positive impact, particularly those policies that go beyond health care (tax reform, deregulation, etc.). Conversely, nearly 22% think Washington politics could have a negative impact on the market either by allowing his proposals to move forward or by having the proposals snagged in gridlock or otherwise not passed. An additional 11% say President Trump is causing them to be more cautious, with some of these respondents describing him as being too unpredictable. About 19% say the president is not influencing or otherwise factoring into their outlook. Some of these respondents described his rhetoric as just being noise, while others say they are more focused on fundamental factors. Fewer than 8% say that it is still too early to tell what impact the administration’s policies will have on the market. And last week we mentioned how “…Much of the market momentum since Election Day has been due to hopes that a new administration would enact policies favorable to the corporate environment and spur economic growth…” Our recently analysis is still in play where we said “…uncertainty among traders – they are not willing to sell off equities, but not quite ready to commit to bidding prices higher. Also there is some sector rotation going which usually happens after a quarterly close and investors are waiting to see what earnings season looks like. In the current trading environment market neutral and short term directional trades have been profitable for us…”Of particular note in the current chart below is that S&P Financial sector stocks crashing over concerns about the timing of future rate cuts.

 1. “You Won’t Believe What Our Top Oil Analyst Says Is Coming Next”
by Michael Campbell & Josef Schachter
Josef Schacter called oil decline from over $100. Then called the recovery and made our listeners and World Outlook Conference attendees big money. What til you hear what’s coming next.
2. Reassessing the Role of Precious Metals as Safe Havens
Last month, a new scientific paper about the precious metals was published. What can we learn from it?
3. Soaring Global Debt Sets Stage For ‘Unprecedented Private Deleveraging’
These numbers are astounding. Emerging market debt was $7.4 trillion in 1996, and today it’s $55 trillion. US and UK government debt has doubled – from already historically-high levels — since 2006.
And there’s no end in sight.

-
I know Mike is a very solid investor and respect his opinions very much. So if he says pay attention to this or that - I will.
~ Dale G.
-
I've started managing my own investments so view Michael's site as a one-stop shop from which to get information and perspectives.
~ Dave E.
-
Michael offers easy reading, honest, common sense information that anyone can use in a practical manner.
~ der_al.
-
A sane voice in a scrambled investment world.
~ Ed R.
Inside Edge Pro Contributors

Greg Weldon

Josef Schachter

Tyler Bollhorn

Ryan Irvine

Paul Beattie

Martin Straith

Patrick Ceresna

Mark Leibovit

James Thorne

Victor Adair