
Timing & trends
Gold performed really well in the first quarter of 2017. As the chart below shows, the rally started at the end of December 2016. The yellow metal bottomed at $1,125.7 on December 20, just a few days after the FOMC meeting and the second interest rate hike for almost a decade. Since then, the shiny metal gained about 11 percent.
Chart 1: The price of gold in U.S. dollars in 2017 (London P.M. Fix).

As one can see below, the price of gold expressed in euros and British pounds developed in a similar way to the U.S. dollar-denominated price. However, on a relative basis, the price of gold gained more in the greenback than in these two currencies (the bullion gained about 7 percent in euros and almost 11 percent in the British pound since the December lows), which seems to reflect an appreciation of the common currency against the U.S. dollar.
Chart 2: The price of gold in the U.S. dollar (yellow line), the euro (red line) and the British pound (green line) in 2017 (London P.M. Fix).

Indeed, the greenback was one of the main drivers of the gold prices in the third quarter of 2017. As usual, there was a strong negative correlation between these two safe-haven assets, as the chart below shows.
Chart 3: The price of gold (yellow line, left axis, P.M. London Fix) and the U.S. dollar index (red line, right axis, Trade Weighted Broad U.S. Dollar Index) in 2017.

After the December Fed hike the U.S. dollar surged while the price of gold bottomed out. However, as investors called the Fed hawkishness into question, the greenback declined, while the yellow metal shined. Other important drivers of the gold rally and dollar weakness were uncertainty about Trump’s policies and comments from Treasury Secretary Steve Mnuchin that the American currency is too strong. In March, gold went south, while the greenback jumped, anticipating the next hike at the FOMC meeting. Indeed, we saw a classic “sell the rumor, buy the fact” scenario in the gold market (with a “buy the rumor, sell the fact” scenario in the U.S. dollar), as the expectations surrounding a rate hike were actually much worse than the actual hike.
Now, the key question is what’s next for the yellow metal. Given the strong relationship with the greenback, the issue boils down to the outlook for the U.S. currency. Well, we believe that the medium-term trend in the greenback is higher, despite the pullback in the first quarter of 2017. As one can see in the chart below, the U.S. dollar has been in an upward trend since 2014. We have also seen an uptick in the real interest rates since the mid-2016.
Chart 4: The U.S. real interest rates (red line, right axis, yields on 10-year Treasury Inflation-Indexed Security) and the U.S. dollar index (green line, left axis, Trade Weighted Major U.S. Dollar Index) over the last five years.

The dollar simply has stronger fundamentals than its major rivals. The U.S. economy should still develop faster than Europe’s (or Japan’s). And the Fed is likely to continue its much more hawkish policy than the ECB(or the BoJ). Consequently, the yield differential between the dollar and the euro should continue to widen, supporting the U.S. dollar. Hence, the greenback continues to be the prettiest of the ugly sisters, offering higher and growing yield.
It’s true that the euro gained after the Mario Draghi’s hawkish comments in March. However, the euro should remain in its long-term downward trend, at least until the ECB ends the quantitative easing and starts hiking interest rates. It would be a long road towards normalization of rates – as a reminder, the Fed started its hikes after the asset purchases were first tapered and finally completed. And the elections in France and Germany are big headwinds for the common currency, as investors are likely to sell the euro, preparing for the worst. Of course, there will be ups and downs, but the Euro area (and its currency) is simply more fragile and less resilient to negative shocks than the U.S.
To sum up, in 2017 the price of gold has risen about 9 percent. Although there was a pullback in the greenback and the real interest rates in the first quarter of the year, we believe that the dollar bull market will remain intact, at least until investors shift their focus from the U.S. towards the monetary policy in the Eurozone and Japan. By that time, the Fed interest rate hikes should only strengthen the greenback. The appreciation of the U.S. dollar is traditionally bearish for gold. On the other hand, the failure of introducing Trump’s pro-growth and the resulting end of the reflation trend could send the greenback down for a while, supporting the gold price.
Thank you.
Arkadiusz Sieron

 The basic reason 85% of investors lose money on a regular basis is that they confuse themselves with a minnow in a shoal trying to avoid a predator or a goose in a flock flying south for the winter. They want to be part of a herd so they are safe. Mathematically 51% of people investing in anything have to lose money because of friction in the trade consisting of the bid-ask spread and commissions. If you want to be part of the herd, you will just give your money away.
To truly understand the signals coming from the Commitment of Traders put out on most Fridays by the CFTC you need to rethink most of what you have been told because virtually no one looks at the COTs correctly.
….continue reading the whole article HERE
…also from Bob Moriarty:

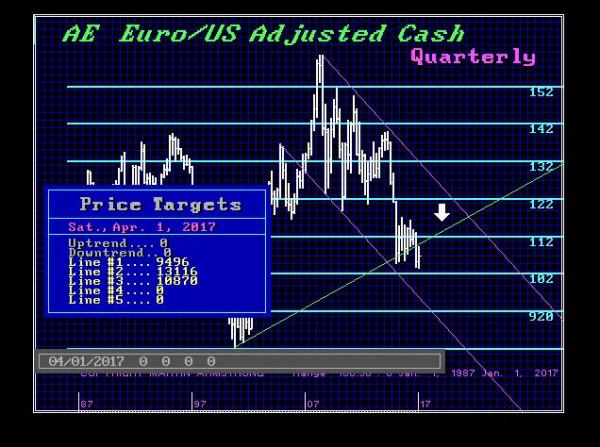
The overwhelming view within Europe is that the dollar is about to make a big move to the downside. We warned that the dollar would decline basically to retest the uptrend line. Failing to get through that technical level and bouncing off it, is technically a very bearish signal for the Euro – not the dollar. That technical resistance for this second quarter stands now at 10870 where we reached intraday 10906 last month. Last week provided an outside reversal to the downside. Now a weekly closing below 10493 will warn that the dollar can rise very sharply.
Perspective
In the fateful month of May 2007, the Treasury curve reversed and in that fateful June, credit spreads reversed. Both forced the dramatic failure of Bear Stearns in early June, which marked the start of the worst contraction since the 1930s. Our presentation in early June included a slide of a crashed train. The caption was that “The Greatest Train Wreck in The History of Credit” had started.
Today, a Morgan Stanley researcher seems confident that central bankers can “keep the party going”. In 2007, the same boast would be accomplished through cutting the Fed rate. Short rates increase in a boom, and this has been a financial boom. Short rates decline in the contraction.
Stock Markets
Back in December, we had thought that the positive stuff would run into March. But some items became tired in late February – early March. As noted last week, base metals made it to March 1 and rolled over. Crude oil stayed firm until the end of February. Credit spreads narrowed until the middle of March and as of Tuesday, this has reversed. Essentially, there has been little change in the yield curve since December.
The action in December became sensational enough to suggest that a Big Rounding Top was possible. This was confirmed by even greater technical excesses being accomplished more recently. These were accompanied by very strong sentiment readings. Both only seen at or near cyclical peaks in the stock market.
To back up just a little; with the explosion in November we called the action “Rational Exuberance”. Rational because it was discounting the change from the most anti-business administration in history to what could be the most pro-business. A few weeks ago, we noted that the action had left “Rational” behind and was just “Exuberance”.
Which continued to this week when a setback from a speculative surge began a correction. It has been earned and fits with the ChartWorks “ABC” correction, which could have declined to a “Springboard Buy”. This is a distinctive break in a flat or rising market and it registered on Tuesday. So, we watch for the bounce and how far it goes.
Out there will be the first drop in expanding margin on the NYSE. The actual report is a month behind and is considering a lagging indicator. With this and a MACD Sell on the S&P would confirm that the Big Top was in.
As we await the full development of the big Rounding Top, we can review some critical items.
One is the discovery that when the action in HYG (High-Yield) soars enough to drive the Daily RSI to close to 77 an important top was set by the S&P some 3 weeks later. The high RSI was set on February 27 and the S&P set highs at 2400 on March 4 and 2390 on March 15.
It could take a number weeks to see if the pattern worked as it did in 2007 and at the lesser high in May 2008.
Another relation that Ross has been working on is the action in the Treasury curve. The 2’s to 20’s need to take out a key low. While not that far away, the take-out is uncertain.
Precious Metals
We find comfort in reviewing gold shares divided by the bullion price, which has been in a basing phase, essentially since November.
The first low on the ratio (HUI/Gold) was 142 in November and the next at 142 in December. The first rally was to 180 in early February which was overbought enough to conclude a decline for the sector.
The next low was 149 in early March, which was tested a couple of weeks later. At 161 now, it needs to get above the 50-Day to complete the bottoming process.
GDXJ slipped from 43 in early March to 33 a couple of weeks ago. At 36 now, getting above the 50-Day would be constructive.
The bottoming action in December 2015 set up what we have been calling a cyclical bull market.
The “Cyclical” call was based upon the bottoming of gold’s real price as deflated by the PPI.
The Cyclical Peak was set at 9.27 in 2011 and the bottom was a double bottom. The low in October 2014 was 5.63, which was tested at 5.63 in July 2015. The high was 7.36 in July last year. The next low was 6.02 set in January. The latest posting is for February at 6.39, which is constructive.
A rising real price is a sign of improving operating margins for gold miners. It also enhances exploration prospects.
China House Prices

Source: Zero Hedge
- Latest posting sets a new, but modest, low.
- That’s on the Tier 1 listings.
San Francisco House Prices

US Y/Y Loan Creation

- For a contraction to start, banks don’t have to call loans.
- All that is needed is that bankers become nervous and stop making them.
US Shale Oil is Killing OPEC

“At the peak of the 2014 boom, the break-even cost of U.S. shale oil was $60. Today, the figure is nearer to $30. In some places, the breakeven cost is just $15 a barrel.”
– The Times, March 20
The Round Trip

- The chart is of sales volume.
- Double Top with 2007 and 2014.
- At the tops, there must have been a lot of certainty.
Check out the following:

The art piece, “My Bed” was originally sold by the artist for £150,000 in 1999 to an art dealer, for display. In 2015 it was sold at auction for £2.5 million.
Small Business Optimism and Real Earnings

- Post Trump Optimism is in Red.
- Real Earnings are in Black.
Setting Up For a Classic Triple Top

- Our March 2nd Pivot noted that Lumber had accomplished an Upside Exhaustion followed by a correction.
- Also noted was that Lumber tended to set Triple Tops at important highs.
- This week’s action is working on the third Top, which could complete the Peak.


Source: Zero Hedge
Listen to the Bob Hoye Podcast every Friday afternoon at TalkDigitalNetwork.com
 Late for work? Imagine skipping the subway and instead heading to your local “vertiport,” where you can hop into an aircraft the size of an SUV that runs on electricity and works pretty much like an elevator.
Get in, punch in your destination, and off you go. Alone.
It may sound like an episode of “The Jetsons,” but electric air taxis are a form of transportation that is coming to Dubai in just a few months. And investors hope American cities aren’t much far behind.

-
I know Mike is a very solid investor and respect his opinions very much. So if he says pay attention to this or that - I will.
~ Dale G.
-
I've started managing my own investments so view Michael's site as a one-stop shop from which to get information and perspectives.
~ Dave E.
-
Michael offers easy reading, honest, common sense information that anyone can use in a practical manner.
~ der_al.
-
A sane voice in a scrambled investment world.
~ Ed R.
Inside Edge Pro Contributors

Greg Weldon

Josef Schachter

Tyler Bollhorn

Ryan Irvine

Paul Beattie

Martin Straith

Patrick Ceresna

Mark Leibovit

James Thorne

Victor Adair