
Timing & trends
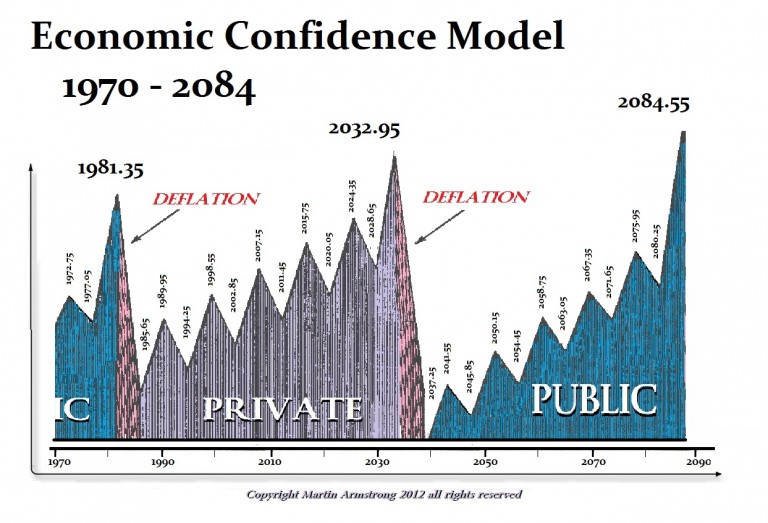
“There are times when the private sector cannot stand and everyone runs to bonds/cash. Likewise, there are times when government can no longer stand and the only thing that survives is private assets. This took place during the collapse of the Weimar Republic (German Hyperinflation) and it has been the case throughout history even at the birth of the USA and the collapse of the Continental Currency.”
….also from Martin: The Crash & Burn
– what will the “Crash and Burn” look like? Will it be worldwide or specific to a few countries like the US? Will it be in the form of a financial crash, food shortages, violence in the streets, all the above or in some other form? ….read Martin’s Crash & Burn response HERE

1. One of the Most Effective Trading Tools for Investors
The study of cycles. Quantified and cataloged historical cycles stretching back hundreds and even thousands of years. Combined with cyclical pattern recognition across hundreds of markets and individual securities.
 2. Fanaticism, Stock Market Crash 2017 or Continuation of Bull Market
Not too long ago this bull market was one of the most hated in history; that no longer appears to be the case.
3. Largest New Discovery of Oil in USA – Fed Raises Rates Markets Rally
by Martin Armstrong
A major discovery of oil has been made in Alaska of 1.2 billion barrels. The largest find of conventional oil for 30 years on US territory.
“The Fed’s forecasts have moved in the direction of tightening, and despite what they say publicly, the most serious stimulus is rising stock prices”

 The Fed gave us another quarter-point rate increase yesterday. That makes the third such hike in the last 10 years!
Whoa! Hold on… We can’t take that much excitement.
But wait… The Fed also signaled that it may abandon its “data dependent” position and take the lead.
Instead of reacting to the news… it may lead the world’s interest rate levels back to normal, regardless of what the headlines tell it.
Oh, dear reader, you already know this is not going to happen. The Fed can never voluntarily return to sound money and market-set interest rates.
It presides over the biggest bubble in stocks and bonds the world has ever seen. Without underpriced credit, the whole thing would collapse.
That’s why the Fed can only take baby steps toward normalization… and only so long as they don’t matter.
We’re entering our ninth year of near-zero interest rates. During that time, businesses, investors, speculators, and consumers have adapted to extraordinarily cheap credit.
They’ve used it to refinance their debts… and drive up their stock prices. They’ve used it to sell automobiles and buy houses.
The big players have gotten used to gambling with money that is almost free. And if they get into trouble, they can borrow more.
If the cheap-credit system were to end – or even if people were to think it is coming to an end – it would take about two minutes for the whole capital structure to fall apart.
Businesses couldn’t refinance. Bonds would crash (except for U.S. Treasurys… which would get a temporary boost on “safe haven” buying).
Stocks would repeat their move of 2008–’09, but probably worse.
Crash Risk
Why worse?
Because they’re more overvalued. By some measures, they are pricier now than EVER before.
Compared to sales, monetary velocity (the rate at which each dollar in the economy is spent), and GDP growth, the S&P 500 is more expensive than it was in 1929, 1999, or 2007 – all major peaks that preceded major crashes.
Warren Buffett’s favorite market indicator also puts this stock market way out on the “overvalued” edge of the spectrum.
Buffett compares the value of the S&P 500’s “market cap” (the total value of all outstanding shares) with the size of the economy that supports it, measured by GDP.
Anytime the ratio goes over 1-to-1, stocks are overpriced.
Today, U.S. GDP is approaching $19 trillion. And the total value of stocks is about $22 trillion. This puts the ratio at 1.2-to-1. For reference, it was only 1.1-to-1 before the 2008 crash.
We can’t predict the future. But the risk of a crash shouldn’t be ignored.
And when it happens – it’s bound to sooner or later – it will take the Yellen Fed about five minutes to abandon its leadership role and become a “data dependent” follower.
Whatever It Takes
Looking at the data from a crashing stock market, the Fed will slash rates again…
And it will roll out QE4 – the fourth round of its quantitative easing program to buy bonds, and even stocks, with money created out of thin air – along with as much other mischief as the feds feel is appropriate.
This is no secret…
Mario Draghi, a former Goldman guy who now heads the European Central Bank (ECB), announced the anthem for central bankers around the world a couple of years ago.
In answer to what the ECB would do to protect its member banks, bankers’ bonuses, and the wealth of the rich, “Whatever it takes,” he said.
We don’t know what it might take, come the next crisis, to keep this fake-money system afloat. But whatever it is, we are sure that the Fed will give it a try.
Reformer or Rascal?
Meanwhile, cometh Donald. J. Trump…
Savior or scoundrel? Reformer or rascal? Hero doctor… or vainglorious quack?
The ailment afflicting the U.S. is “swamp fever” – with too many programs, too much money, and too many regulations that benefit Deep State cronies but hurt the Main Street economy.
There are three major ones. Now we have heard from the president on all of them.
The military: He says there is to be more of it. And in his preliminary 2018 budget proposal, there is a $54 billion windfall for the military-security industry.
Wall Street: Mr. Trump hasn’t even mentioned it. Instead, he has put Goldman Sachs alums such as Steven Mnuchin and Gary Cohn in key positions, signaling no change to the Clinton-Bush-Obama fake-money system.
And entitlements: Last week, the president said he was “proud” of the Republicans’ “Obamacare Lite” health care reforms.
We don’t know whether the new plan is better or worse than the old one. But one thing is for sure: From the Deep State’s point of view, it is not much different.
Military… Wall Street… entitlements… The rest is detail.
Tomorrow, we continue yesterday’s campfire tale – including why the U.S. empire’s financial system is doomed… and what you would have to do to get the economy working properly again.
Regards,
Bill
Market Insight
by Chris Lowe, Editor at Large, Bonner & Partners
This month, for the first time ever, the price of one bitcoin surpassed the price of one ounce of gold.
As you can see, on March 3, bitcoin hit $1,277 versus a price of $1,236 for an ounce of the yellow metal.

And even after a gold rally yesterday, one bitcoin is just $8 below the gold price.
— Chris Lowe
I’ve been thinking about the current Fed Funds rate hike cycle, which is logically gaining forward momentum now that the Fed can stand down from its 8-year, ultra-lenient monetary policy cycle. That is because the Obama administration’s goals required a compliant Federal Reserve to continually re-liquefy the economy as its fiscal policies drained it.
With the coming of Trump mania and its very different fiscal policy goals, we will witness the end of much of what I considered to be the “evil genius” employed by the Federal Reserve, mostly under Ben Bernanke. When he oversaw the brilliant and completely maniacal painting of the macro known as Operation Twist in 2011, I knew we were not in Kansas anymore. We’d gone off the charts and off the balance sheet into a Wonderland of financial and monetary possibilities.
What else would you call a plan to sell the government’s short-term debt and buy its long-term debt in the stated effort to “sanitize” (the Fed’s word, not mine) inflationary signals on the macro? It was evil, it was genius, and it worked. So too did various other financial manipulations that took place before and after Op/Twist. And here we are.
The Republican view is one where businesses and consumers are stimulated, not money supplies. I think it is a better economically, but not by much in this case. That is because the Trumpian ‘reflation’ would simply be another form of man-made stimulation attempting to deny market and economic excesses from being cleared. A normal economy goes through normal cycles. We have not had a normal economy or a normal cycle since at least pre-2000.
Since Alan Greenspan panicked and blew the credit bubble of last decade, we have been on a continuum further into uncharted waters. Trump’s policies are not going to stop it, either. Besides, he inherits this (chart source: SlopeCharts).
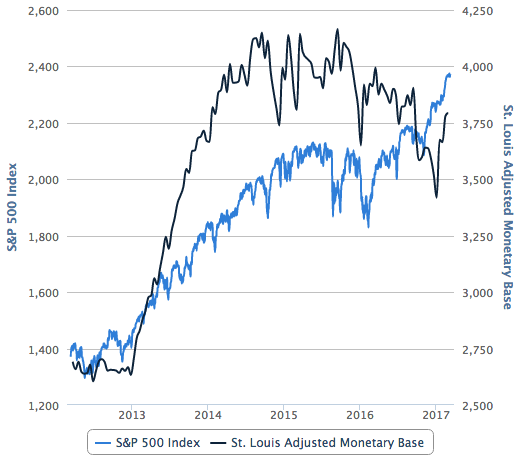
What we see above is a dangerous correlation between Monetary Base, which is the product of monetarypolicy, and the S&P 500. We see that the S&P 500, which followed the Base in lockstep for much of the bull market, is playing a little catch up to the Base, which itself is only bouncing within a topping structure. That is a dangerous looking chart if the assumption that monetary policy will be withdrawn as fiscal policy is anticipated/enacted is a good one.
To put it simply, the Fed is no longer mandated to prop the markets and the economy. The Trump administration is taking that task on. But what about the transition from monetary to fiscal? Ah, the transition. It is in that grey area that the Good Ship Lollypop could get cast about.
The Fed is apparently (finally!) in hawk mode. ‘Trump will free us from the chains of taxation, regulation and an out of control welfare state!’ think legions of happy people and corporations. But if the policy of the last 8 years is replaced and radically changed, there will be a transition period.
There are a lot of similarities to George W. Bush’s first term in office. A new Republican takes over from a 2-term Democrat under whom the markets roared. A rate hike cycle was in play at the end of Clinton’s term. When Bush took over into the jaws of a bear market, that was when Greenspan panicked and blew the millennium’s first bubble. On the next cycle, as G.W. benefited from the resulting inflationary bull market another rate hike cycle was kicked in. Greenspan rode off into the sunset and left a liquidation and crash in the lap of Bernanke and the Obama administration. They immediately went full frontal monetary policy and never looked back.
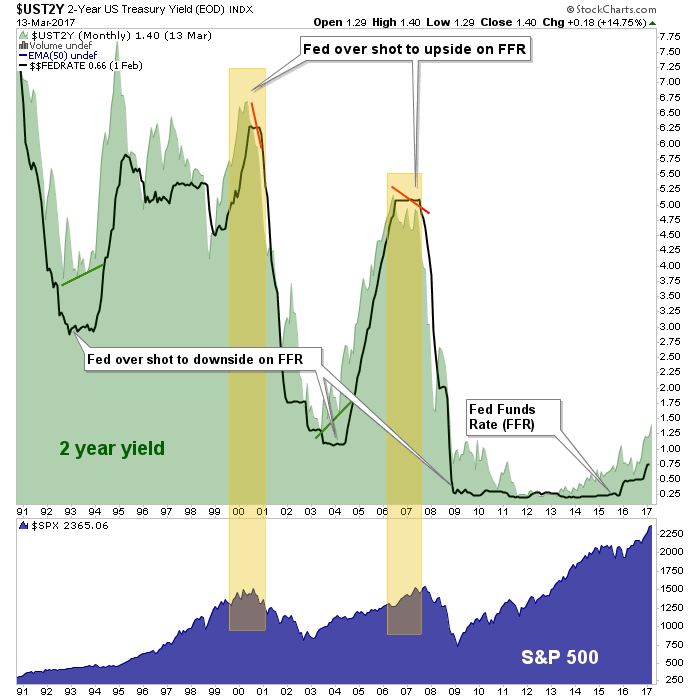
Now here we are. Another rate hike cycle is in the early stages. Normally the early stage of a rate hike cycle is a bullish thing and so far it has been just that. While my other work anticipates a perhaps routine market correction right around now, the favored view holds open new highs later in the year. The Fed Funds rate needs to climb significantly higher after all, in order to trigger the next market crash.
That is what the above chart says if taken at face value. The problem is that with 8 years of pure monetary policy distorting the system in ways that are impossible to quantify, who’s to say that this cycle will not abort at a significantly lower interest rate on the Fed Funds? After all, the entire asset price gambit has been built on ever-expanding debt, has it not?
What again is the case for gold? Real, heavy, in-your-hand gold? It is an anchor to the time before the Good Ship Lollypop set sail on these uncharted waters. Though its ‘on the surface’ fundamentals are not complete yet, there are rocks just beneath the macro’s surface. Those rocks are exponential monetary policy levels being withdrawn. That is enough reason to have monetary insurance, which is gold’s most basic utility.
Aside from the monetary metal, it is advisable to tune out overly conventional analysis that does not look below the surface (unless you day trade and are blissfully concentrating on the daily red and green lights). It is advisable to have balance with respect to your holdings (cash is a holding, folks, and if you own an equivalent like T Bills it is soon to be paying another .25%) and not to run with the herds. For example in the short-term, the pro-inflation/reflation and anti-Treasury bond herds are very crowded.
Given the monetary distortions noted above, the transition to coming fiscal distortions and a general backdrop that people should not pretend to be able to quantify, it is more important than ever to think for yourself and not lap up generic market advise. Have balance *, perspective and for crying out loud, do the work!
* For me this has taken the form of profit taking, loss limiting, rebalancing, cash raising and slowly increasing short positions in less favored areas.
NFTRH.com and Biiwii.com
….also:
The Bull Market Just Turned Eight. What Now?
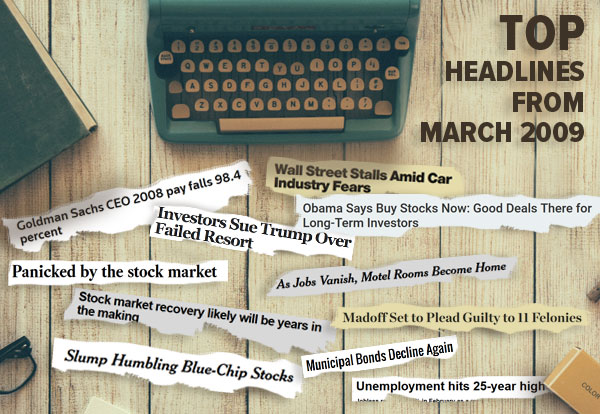
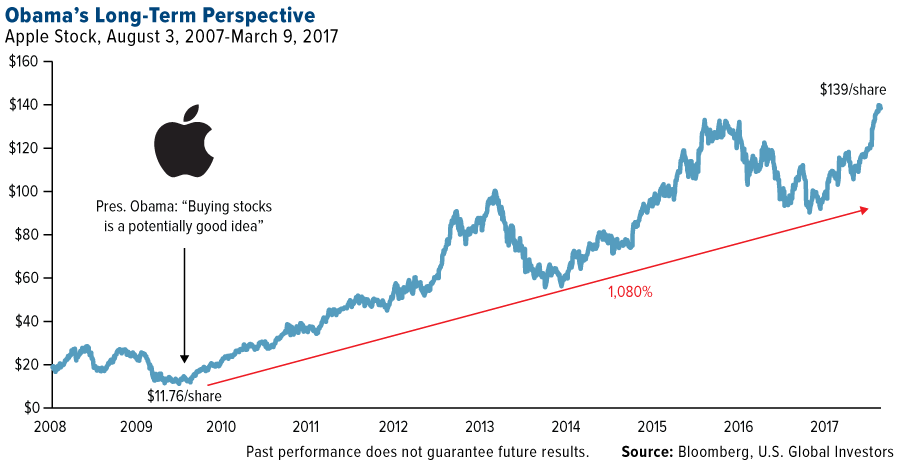
Eight years ago last week, President Barack Obama gave investors a surprisingly hot trading tip. In office less than two months, he commented that we were at “the point where buying stocks is a potentially good deal if you’ve got a long-term perspective.”
Obama couldn’t have known then how accurate his call was. The market found a bottom that very week, and investors who took the president’s advice managed to get in on the absolute ground floor.
At the time, investor sentiment was at or near record lows. The number of S&P 500 Index stocks trading below $10 a share had grown tenfold since the end of 2007. The New York Stock Exchange, in fact, had to temporarily suspend its requirement that equities trade at more than $1 a share. Giant companies such as Citigroup and General Motors—a share of which cost little more than a pocketful of spare change—were at risk of being delisted.
Today, many of those bullish investors have seen some spectacular gains. Since its low of 666 in March 2009, the S&P 500 has climbed a whopping 260 percent, with not a single year of losses. The average annual return has been over 15.7 percent, based on Bloomberg data. With dividends reinvested, it’s closer to 18 percent.
Just take a look at Apple, which has surged more than 1,080 percent as it introduced or expanded its line of got-to-have, now-ubiquitous products, from the iPhone to iPad.
To show you just how far we’ve come, I put together a few comparisons of several indices and economic factors between March 2009 and now.
| March 2009 | Most Recent Data, March 2017 | Percent Change | |
|---|---|---|---|
| S&P 500 Index | 666.79 (intraday low, March 6) | 2,400.98 (intraday high, March 1) | 260% |
| Dow Jones Industrial Average | 6,440.08 (intraday low, March 9) | 21,169.11 (intraday high, March 1) | 228% |
| University of Michigan Consumer Sentiment Index | 69.5 | 96.3 | 38% |
| U.S. ISM Manufacturing Purchasing Managers’ Index (PMI) | 35.8 | 57.7 (February) | 61% |
| Housing Starts | 505,000 | 1,290,000 | 155% |
| Light Vehicle Sales | 9,552,000 | 17,465,000 | 83% |
| Unemployment | 8.7% | 4.7% (February) | -45% |
| Gold | $885 (intraday low, March 18) | $1,248.30 (intraday high, March 1) | 41% |
| Sources: S&P Dow Jones Indices, Bureau of Economic Analysis, University of Michigan, Bureau of Labor Statistics, Census Bureau, ISM, IBA | |||
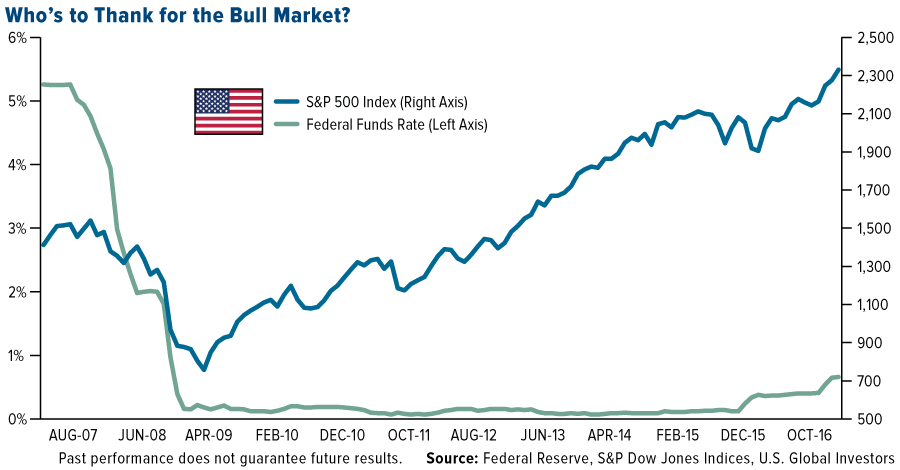
Of course, there have been market skeptics. As others have pointed out, this particular bull run—the second-longest in U.S. history—has arguably been the least loved, with many investors calling it artificial and arguing that it’s been driven not by fundamentals but the Federal Reserve’s policy of record-low interest rates.
Now there are those who wonder how much longer this bull run can last. And if it ends, will it be with a bang or a whimper?
“Trump Rally” Could Have Further Room to Grow
It’s important to keep in mind the old investing adage, “Bull markets don’t die of old age.” Bear markets have been incited by everything from geopolitical conflicts to stagflation to oil price shocks to financial crises. Although no one can say with all certainty that age is irrelevant in a market’s longevity, there are signs that the current eight-year-old run has further room to grow, at least in the short term.
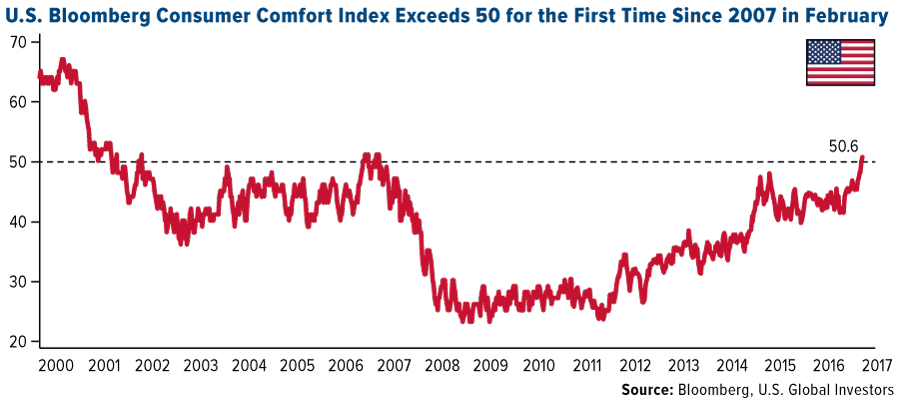
President Donald Trump’s pro-growth policy proposals, including lower corporate taxes, deregulation and infrastructure spending, have jolted many people’s “animal spirits,” with several indices already hitting near-record highs. In January, the Index of Small Business Optimism posted a reading unseen since 2004, as I shared with you earlier. More recently, the Bloomberg Consumer Comfort Index, which measures American consumers’ views on the U.S. economy and their personal finances, climbed to 50.6, the first time it’s exceeded 50 in a decade. Note how few times it’s risen above that level in the past 17 years.
And of course there’s the booming jobs market. Following the record 75 straight months of jobs creation under Obama, employers continue to ramp up their rate of hiring even more, indicating a rosy financial and economic outlook. Despite candidate Trump’s tendency to question the validity of encouraging jobs reports before the election, President Trump now has much to brag about in his first full month in office.
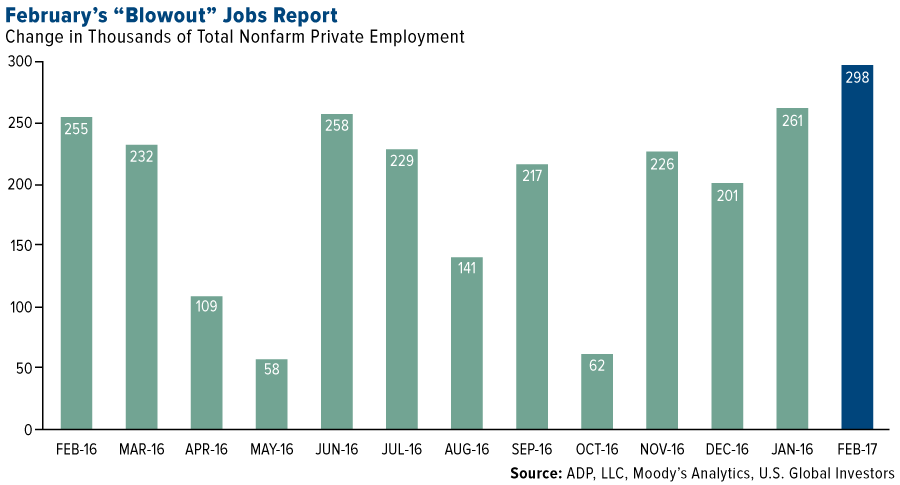
According to the Bureau of Labor Statistics (BLS), the U.S. added a phenomenal 235,000 jobs in February, with gains made in construction, manufacturing, mining, educational services and health care. The report indicated that mining added 8,000 positions during the month, 20,000 in total since a recent low in October, just before the election. This shows executives’ confidence in Trump, who pledged to revive the industry by eliminating job-killing regulations.
Another recent report was even more generous than the BLS. The ADP National Employment Report showed U.S. employment increasing by nearly 300,000 from January to February. Medium-size businesses—those with between 50 and 499 employees—expanded the most, adding 122,000 positions.
Gold historically has fallen on better-than-expected jobs reports, but I was happy to see that it actually gained on Friday after eight days of losses. The yellow metal held above $1,200 an ounce, even as it becomes more and more certain that interest rates will be hiked this month.
Valuations High, but Good Deals Can Still Be Found
Some investors right now might be discouraged by high stock valuations. Although it’s true certain sectors are beginning to look expensive—information technology is currently trading at more than 23 times earnings, real estate at 43 times earnings and energy at a whopping 113 times earnings—there are still some attractive deals.
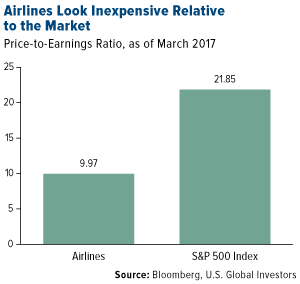 |
Among them is the airlines industry, which as of today has a very reasonable price-to-earnings ratio of 9.97. At 21.85, the S&P 500 is more than twice as expensive.
This is one of the many reasons why billionaire investor Warren Buffett is bullish on airlines, which he once called a “death trap” for investors. Not only did his holding company Berkshire Hathaway purchase shares of the four big domestic carriers—American, United, Delta and Southwest—but it dramatically expanded those holdings in the fourth quarter, according to regulatory filings. Now there’s even speculation that Buffett and Berkshire Hathaway could be planning to acquire one of these four carriers outright, with Morgan Stanley’s Rajeev Lalwani writing that Southwest’s “domestic focus, robust and sustainable free cash flow, range of growth opportunities, defensible cost structure and more tenured management team” make it a logical candidate.
Some links above may be directed to third-party websites. U.S. Global Investors does not endorse all information supplied by these websites and is not responsible for their content. All opinions expressed and data provided are subject to change without notice. Some of these opinions may not be appropriate to every invest.
The Dow Jones Industrial Average is a price-weighted average of 30 blue chip stocks that are generally leaders in their industry. The S&P 500 Stock Index is a widely recognized capitalization-weighted index of 500 common stock prices in U.S. companies. The University of Michigan Confidence Index is a survey of consumer confidence conducted by the University of Michigan. The report, released on the tenth of each month, gives a snapshot of whether or not consumers are willing to spend money. The ISM manufacturing composite index is a diffusion index calculated from five of the eight sub-components of a monthly survey of purchasing managers at roughly 300 manufacturing firms from 21 industries in all 50 states. The Small Business Optimism Index is compiled from a survey that is conducted each month by the National Federation of Independent Business (NFIB) of its members. The Bloomberg Consumer Comfort Index is a weekly, random-sample survey tracking Americans’ views on the condition of the U.S. economy, their personal finances and the buying climate.
Holdings may change daily. Holdings are reported as of the most recent quarter-end. The following securities mentioned in the article were held by one or more accounts managed by U.S. Global Investors as of 12/31/2016: American Airlines, United Continental Holdings, Delta Air Lines, Southwest Airlines.

-
I know Mike is a very solid investor and respect his opinions very much. So if he says pay attention to this or that - I will.
~ Dale G.
-
I've started managing my own investments so view Michael's site as a one-stop shop from which to get information and perspectives.
~ Dave E.
-
Michael offers easy reading, honest, common sense information that anyone can use in a practical manner.
~ der_al.
-
A sane voice in a scrambled investment world.
~ Ed R.
Inside Edge Pro Contributors

Greg Weldon

Josef Schachter

Tyler Bollhorn

Ryan Irvine

Paul Beattie

Martin Straith

Patrick Ceresna

Mark Leibovit

James Thorne

Victor Adair