
Timing & trends
 As I presume you know by now, Larry Edelson passed away on March 2, leaving all of us in shock and mourning.
But this past week, I had the privilege of spending quality time with Larry’s cycle forecasting protégé, Mike Burnick.
Mike has worked closely with Larry since he joined our firm nearly two decades ago. He is steeped in cycle analysis. And he has used it to make an important contribution to the team’s amazingly accurate forecasts, especially regarding gold and stocks.
Gold Forecasts
October – November, 1999: “19-year bear market in gold is OVER. Finished, Kaput. We’re entering a bull market the likes of which you haven’t seen since the great glory days for gold in the 1970s. But don’t expect gold to shoot straight up. There are bound to be pullbacks, especially during the early stages.” Shortly thereafter, they warn gold will slide to the $250 level before beginning its long-term rise.
The price of gold hits rock bottom at $255, and moves up from there. It ultimately reaches an all-time peak of $1,921 in 2011.
November 2000: Major new “buy” signal for gold and gold shares. “Start scooping up bullion coins and … mining shares.”
Result: Investors acting on this signal have the opportunity to buy gold-mining shares close to their lowest prices in decades.
August 2011: Major “sell” signal for gold and gold shares.
Result: Between their buy signal of 2000 and their sell signal of 2011, investors have the chance to make a total return of 850% on Agnico Eagle, 878% on Kinross, 1,059% on Newcrest, 1,248% on Goldcorp and 2,958% on Royal Gold.
May 2016. “More and more investors will get trapped in the precious metals’ first leg up … And those investors will be badly crushed under tens of billions of losses when gold, silver, platinum, palladium — and especially mining shares — collapse back down to near their record lows of late last year.”
Result: At first, as gold continues to move higher, their subscribers are frustrated with this forecast. But beginning in early July, the price of gold sinks by $200 per ounce, providing a much better buying opportunity, and subscribers cheer.
Stock Market Forecasts
April 2012. “The Dow Jones average will hit 20,000 by the year 2016.”
At the time, the Dow is trading near 13,000. In Europe, a major sovereign debt crisis rages. In the U.S., pundits are deeply concerned about “the weakest economic recovery in history.” Even friends and family say Dow 20,000 is “unbelievable.” But four years and eight months later, on December 20 of last year, the Dow hits an intraday high of 19,988, just 12 points below their target of 20,000. And on January 25, 2017, just a few weeks beyond the target year, the Dow bursts through the 20,000 barrier.
Moreover, they don’t make this forecast just once. They repeat it in March 2013, June 2013, October 2013, December 2013 and every year thereafter.
Nor do just a handful of people see it. The original forecast of Dow 20,000 by 2016 is sent to 392,140 subscribers to Money and Markets, 37,291 subscribers to Real Wealth Report, and at least two million investors who receive the same forecast via advertisements in the mail and on the Web.
They are equally accurate in timing and predicting stock market crashes going all the way back to Larry’s forecast of the Crash of 1987!
How do you do it?
So as you may suspect, when I met with Mike last week, my obvious and urgent question was “precisely how did you do it?”
 “I assume you’re referring to ‘you’ in the plural,” he responded, “because I cannot take more than my share of the credit. Larry was the one who taught me cycles analysis and who was our mentor throughout these years. But before I answer your question, may I ask you one of my own? March 2017 is a major anniversary that no one seems to be talking about. Care to guess why that date was so important?”
I recalled: “The eight-year anniversary of this bull market, which began in March of 2009.”
“Well yes, that too,” Mike said with a chuckle. “But what I’m referring to is something that happened on March 11, 2011. This week is the six-year anniversary of the great tsunami that struck Northeast Japan. It came on the heels of a massive 9.1 undersea earthquake, the most powerful earthquake ever recorded in Japan. It triggered a tremendous wave of up to 133 feet. That’s 12 stories high! Imagine how it felt to confront a mass of water as tall as a 12-floor building coming straight at you! Imagine the destruction in its wake!”
I was silent for a moment, recalling the horror I felt that morning when I first saw the headline in the Los Angeles Times, and immediately thought about our son, Anthony, who lives in Tokyo. Thankfully, I soon discovered that Anthony was not among the victims because, coincidentally, that same L.A. Times story included a statement from the first American witness quoted from Japan, Anthony Weiss.
“How does that relate to our topic today?” I asked as I exited my daydream.
“It’s a perfect metaphor for our forecasting methodology,” Mike responded. “We track the great cyclical waves of history, and right now, the biggest, most enduring, consequence of those cycles is the Global Money Tsunami — the massive waves of flight capital from overseas that are driving our market higher. You know that. We write about it all the time. But now let me tell you about the powerful cyclical forces behind that tsunami.”
“That’s exactly what I want to talk about.”
While pulling out a series of charts stretching back for decades (and in one case, for centuries!), Mike promptly proceeded to rattle off four major cycles with a high level of precision and certainty:
The Kondratieff wave (K-wave), ranging from 40 to 60 years. Close students of this cycle could have foreseen, well ahead of time
- A decline in the 1860s and a bottom in the 1870s, accurately predicting the economic crisis surrounding the U.S. Civil War and Reconstruction.
- A rise into the late 1800s and early 1900s, accurately forecasting America’s Gilded Age.
- A peak in the 1920s, predicting the great bull market of the Roaring ’20s.
- A big bottom in the 1930s, predicting the Great Depression. Plus, more recently …
- Another big bottom in the 2000s, predicting the 2000-03 Tech Wreck, 2008 Debt Crisis and Great Recession.
- A steep rise beginning in 2009, clearly showing the path toward today’s 8-year bull market (so far), AND predicting a continuing bull market through approximately 2020.
Juglar and Kuznets cycles, approximately 9- and 18-year cycles, respectively. Again, those following these cycles could have foreseen …
- A panic bottom in the stock market in 1932.
- A decline in the U.S. economy and stock market in the early 1950s (associated with the Korean War).
- The stock market decline and recession resulting from the Nixon Shock of 1971 and Arab Oil Embargo of 1973.
- The stock market crash of 1987 (which we predicted practically to the day) and the Russian debt default crisis of 1989.
- The crises of 2007-2009, and …
- The current bull market in stocks, projected to continue until 2020 or possibly longer.
Cycle of Innovation, the 50-year cycle of business innovation discovered by Joseph Schumpeter. Predicts periods of “creative disruption” and entrepreneurship, along with political upheavals that can often accompany rapid technological change. Cycle is now still very high and holding, but targeting a bottom after 2020.
War Cycle, ramping up through 2020. Not just armed battles, but also trade wars, currency wars, and cyberwars. Not merely between nations, but also domestic civil unrest, revolutions and escalating repression or asset confiscation by governments against their citizens.
“Anyone who truly knows cycles,” Mike concluded, “should be well versed in precisely when these are likely to peak and bottom. However, what many cycle analysts don’t know so well is two things: How to track them closely to determine when they may be hitting somewhat earlier or later than originally projected. And most important of all, how, during very rare historical periods like today’s, these cycles can CONVERGE into one time and place.”
“Convergence! That’s where Larry and team really hit a home run, isn’t it?” I asked.
“Yes, it certainly is. And in this decade, we have the most powerful convergence of the cycles since the 1930s. I say that not to focus on the Great Depression, but rather to focus on the massive up-wave that ensued after the Great Depression and World War II. It started in gold. Then came the postwar boom in stocks. And finally, the greatest bull market and economic expansion in all human history. Not without big recessions and disasters in-between, of course. But in hindsight, all of those — especially the stock market crashes of 1987, 2000-2003 and 2008 — were historic buying opportunities. What’s most important of all is that, with the foresight that careful cycle analysis can give you, all of those cycle bottoms were predictable and predicted.”
Mike and I were silent as we reflected on the enormity of these historical forces and the important contribution Larry Edelson made to the world by helping to bring them to light. “Now that Larry is gone,” I queried, “what is your vision going forward? What are your forecasts for the next few years?”
“The same vision as before. The same forecasts we have already published repeatedly, from the same exact body of knowledge: The long-term cycles I’ve just told you about, seen through Larry’s telescopic lens that I’ve inherited, for which I will be forever grateful.”
“Don’t understate your own analytical powers,” I cautioned.
“Thank you for that. But you asked for our forecasts. The first forecast is that gold will surge to $5,000 per ounce, or higher. In the current phase of that bull move, it’s driven primarily by the same global money tsunami we discussed at the outset. That comes with both ebbs and flows. So beware of corrections, such as the one that just started last month. But this will be a wonderful long-term buying opportunity. That’s because, as inflation picks up steam, the latter stages of the move in gold could be parabolic, much as you saw in the late 1970s, when the price of gold doubled in just one year.
“Forecast number two: The Dow will explode to 45,000. I know that may sound unbelievable. But in 1999, we saw the Nasdaq double in just one year. And the time frame we’re talking about is much longer than that. If we didn’t know better, we’d throw our hats in the ring with all those pundits who still say the economy is not strong enough and interest rates are rising, so the Dow must crash. But, if you understand the four cycles we talked about … if you understand the Global Money Tsunami that will flow to the U.S. from a sinking Europe and later, a sinking Japan … you will also understand how to make a fortune over the next few years with select stocks that deliver life-changing profits.
“Forecast number three: Sovereign bond market will collapse. And that collapse will emerge as another driver of funds that rush into stocks. Why? Because solid private-sector assets, such as the shares of U.S.-based blue-chip companies, will actually be seen as safer than bonds. Because the governments of Europe, Japan and, ultimately, the U.S. are essentially bankrupt. There’s simply no way they’ll ever make good on their outstanding debts — not to mention their promises for retirement pensions (such as Social Security), healthcare, and more.
“Forecast number four is the collapse of the European Union and the euro. Many think the European Union will survive. Many hope that, because Germany’s economy is hanging in there, the European sovereign debt crisis is done and over. That view is dead wrong. That’s why we have long predicted that the biggest surprise of all will be not only the decline, but also the demise of the EU and the euro. Now, as you can plainly see, that day is much closer.
“Hitch your wagon to these cycles, and you will win. Ignore them, fight them, or simply drop out, and you will lose. I’m all in. I trust you are too.”
I thanked Mike for sharing these insights. He promised to provide many more in the weeks to come.
Good luck and God bless!
Martin

Today’s videos and charts (double click to enlarge):
SFS Key Charts & Tactics Video Analysis


SF60 Key Charts & Tactics Video Analysis


SF Juniors (Trading) Key Charts & Analysis


SF Juniors (Super Core) Key Charts & Analysis


SF Trader Time Key Charts Video Analysis


Morris
| Friday, Mar 10, 2017 Super Force Signals special offer for Money Talks Readers: Send an email to trading@superforcesignals.com and I’ll send you 3 of my next Super Force Surge Signals free of charge, as I send them to paid subscribers. |
The SuperForce Proprietary SURGE index SIGNALS:
25 Surge Index Buy or 25 Surge Index Sell: Solid Power.
50 Surge Index Buy or 50 Surge Index Sell: Stronger Power.
75 Surge Index Buy or 75 Surge Index Sell: Maximum Power.
100 Surge Index Buy or 100 Surge Index Sell: “Over The Top” Power.
Stay alert for our surge signals, sent by email to subscribers, for both the daily charts on Super Force Signals at www.superforcesignals.com and for the 60 minute charts at www.superforce60.com
About Super Force Signals:
Our Surge Index Signals are created thru our proprietary blend of the highest quality technical analysis and many years of successful business building. We are two business owners with excellent synergy. We understand risk and reward. Our subscribers are generally successfully business owners, people like yourself with speculative funds, looking for serious management of your risk and reward in the market.
Frank Johnson: Executive Editor, Macro Risk Manager.
Morris Hubbartt: Chief Market Analyst, Trading Risk Specialist.
website: www.superforcesignals.com
email: trading@superforcesignals.com
email: trading@superforce60.com
SFS Web Services
1170 Bay Street, Suite #143
Toronto, Ontario, M5S 2B4
Canada
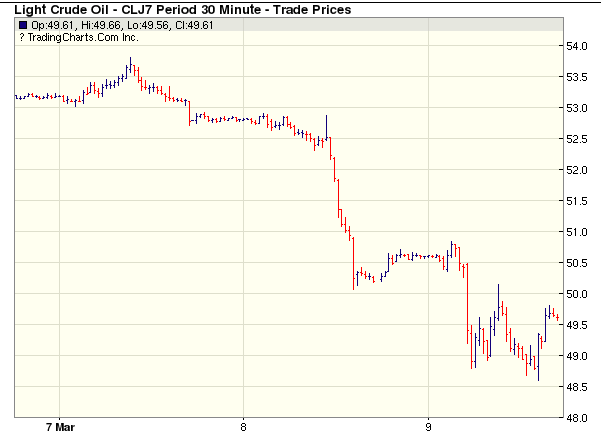
They took the oil and took it down, a stunning build and it turned straight down! When you count the barrels and the oil drilled, a landside brought it down!
A massive crude oil build rocked the oil market in what could be a major downside breakdown that is raising the stakes for OPEC and U.S. shale producers. Will it be cut back or face prices falling even further? Call it a landside if you will, as record long positions in oil ran for their lives and analysts like me are scratching their head to try to figure out how they did not see this historic and record breaking increase in weekly crude oil supply.
The following published for our subscribers March 2, 2017.
Perspective
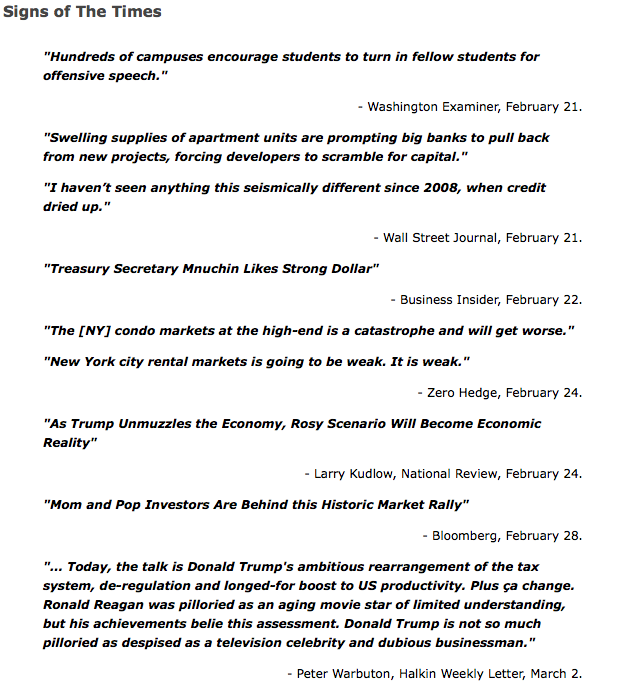
What a range of headlines!
The first one about “informing” is right out of Totalitarianism 101, common to both international or national socialism. The one about banks pulling back from lending to condo developers reminds of Mises’ view on a contraction. At the top, the banks don’t have to call the loans, they just become nervous and stop making them. Then there would be the reversals in the credit markets.
Mom and Pop are in the stock market and Kudlow is writing about “Rosy Scenarios”.
The question is not about can it get any better?
It is about how long can it stay wonderful?
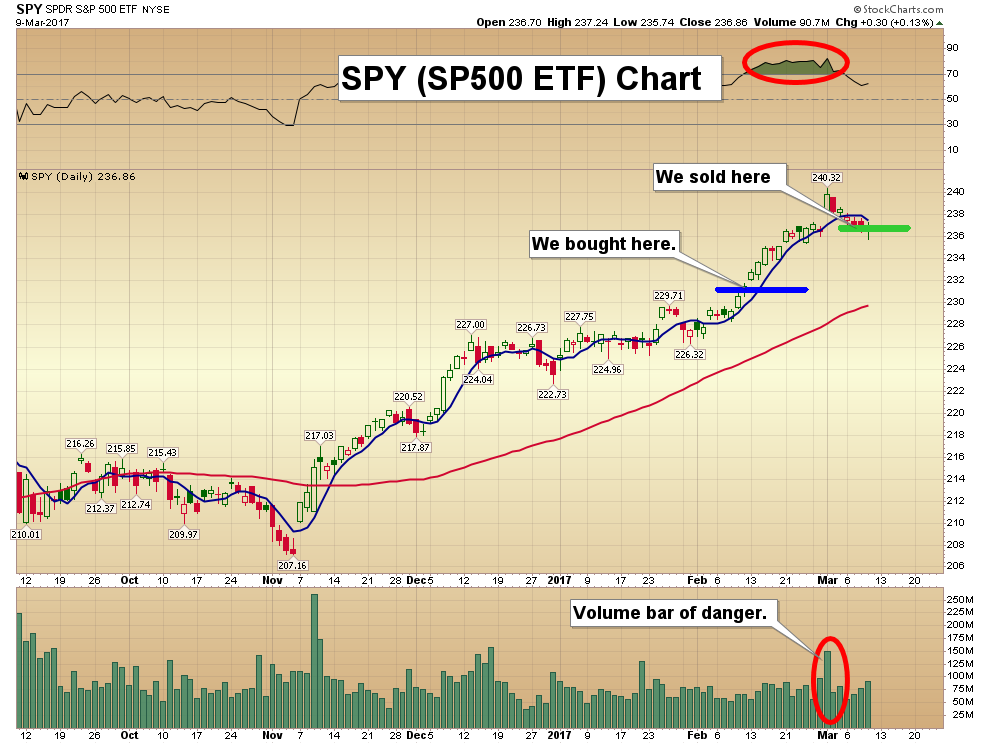
Stock Markets
Since November our theme has been “Rational Exuberance”, discounting the change from anti-business to a pro-business administration. Quite likely the most exciting such change in US history. But last week we concluded that with the action becoming sensational, “Rational” is no longer part of the theme. But “Irrational” seems not yet at hand, leaving us with “Exuberance”.
This, for example, has driven the Weekly RSI on the DJIA to 81, which is getting up there. But can be seen in previous strong advances out of a deflated condition. That was ending a year ago.
And how long can this phase run?
We will stay with the theme that the “good stuff” could run into March.
Industrial commodities, particularly crude, have been expected to be firm into March, providing support for the stock markets. However, the firming dollar could constrain further advances.
The other carrier of the good times has been narrowing credit spreads which have been likely to be a positive into March. The action is somewhat overbought, but March is not over.
The rise is encompassing most sectors and is becoming outstanding. This form of outstanding action can run until momentum takes a break. Also, there is the indicator attendant to extremes, and that is the “Hindenberg”, which has yet to register.
The February 16th ChartWorks outlined the possibility of an “ABC” type of correction. This would follow the completion of the momentum move. As noted, that would be signaled by the S&P taking out the 12-Day ma.
We used some seasonal influences to carry us this far in the rally. At times, the NYSE Margin Debt can guide and Ross has taken his thorough approach. The series is available from 1962 and the observation is that with the latest report at record highs the NYSE rally has further to go. The key will be a downtick in Margin combined with a MACD “Sell”.
Nice to have another technical tool.
Currencies
The DX got overbought at 103.85 at the end of December, which was within the ChartWorks long-term “model”. A correction was possible and we have been looking for the DX to base with the 20-Week ema. This was the case at the start of important rallies in 2014, 2015 and 2016.
The exponential moving average has based and is turning up. The DX has been staying above the line, which is constructive. Breaking above 102 is the next step, which was accomplished today. Above the last high at 103.85 and the uptrend will have resumed.
With this, the “model” provides a target of 112, which would be the best rally since 2014.
The Canadian dollar has weakened. And given the technical arithmetic, the 20-Week ema has guided the swings down. This began following the peak with commodities at 106 in 2011.
This week, the C$ slipped below the ema. It may take some work to fail, but the long-term trend is down.
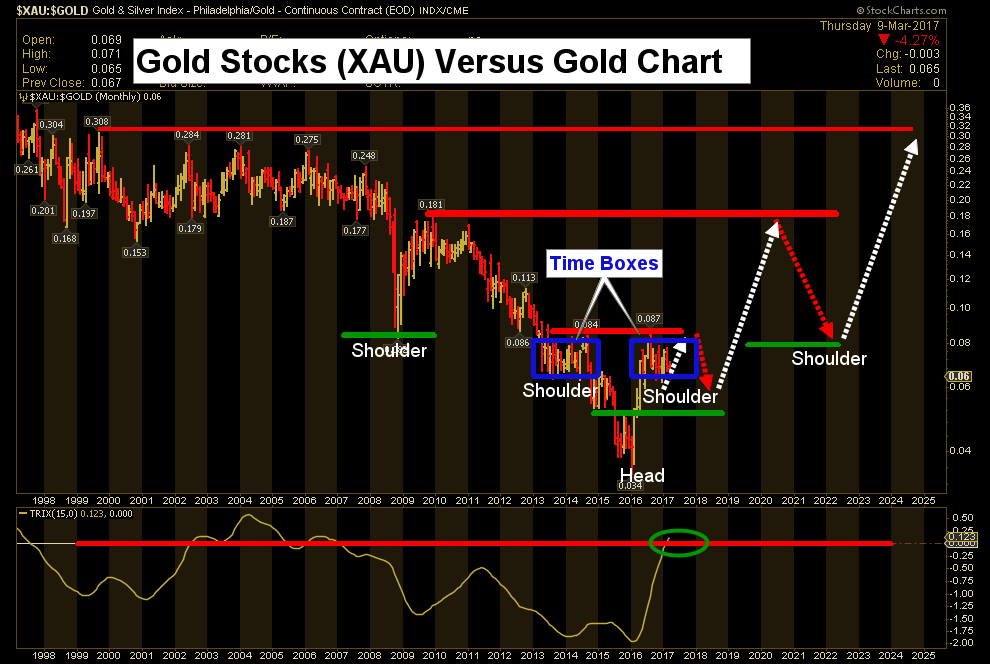
Precious Metals
Our February 9th Pivot reviewed that rally and noted that the gold stocks were not outperforming the bullion price. A correction for the sector was possible.
The high for the GDXJ was 43 on February 8th and it has declined to 34.40. This week’s drop took out the 200-Day at 39 and the 50-Day at 36.80.
The decline is down to 35 on the Daily RSI. Close to 30 would be oversold enough to end the move.
What prompted our concern was that HUI/Gold reached a high in early February and rolled over. We will be watching for the next low.
The gold/silver ratio has suddenly become volatile which often precedes a change in the financial markets.
The ratio slumped from 70 on Monday to 67.8 early today. At the close it had jumped to 70, a big move for this item.
Rising through 71 will set the uptrend and that would suggest a significant setback in the credit markets.
Home Sales & Interest Rates

Source: Zero Hedge
- Mortgage rates are plotted with a 3-month lead.


Link to March 3, 2017 Bob Hoye interview on TalkDigitalNetwork.com:http://www.howestreet.com/2017/03/03/market-exuberance/
Listen to the Bob Hoye Podcast every Friday afternoon at TalkDigitalNetwork.com

With Larry Edelson’s passing last week, I lost both a friend and a mentor. I met Larry my very first day at Weiss back in 2002. He was already a larger-than-life personality, but always took time out to mentor us with his unique view of the markets.
Larry taught me a great deal about markets and investing over the next fifteen years; about taking the long view to identify the big, macro trends. An avid student of history and the cyclical nature of markets, he taught me the value of evaluating markets from a historical perspective.
There’s really nothing new in financial markets that hasn’t happened before. While history may not repeat exactly, it does rhyme.
In fact, the recurring, cyclical nature of financial markets is a perfect reflection of its participants; millions of individual investors collectively making value judgments every single day.
Markets are much more than numbers, Larry would say, markets are people… it’s all about people.
Indeed, successful investing is mostly about studying human behavior … hope and fear, greed and envy … the emotions that make up market sentiment.
Take commodities. There is no better example of the cyclical nature of markets.

In 2007, after a nine-year long bull market in which commodities soared, especially gold, suddenly everyone wanted to own hard assets. Investors shoveled money into commodity stocks, funds and ETFs like never before.
Then along came the 2008 financial crisis. Commodities plunged nearly 50% that year, wiping out many of the newfound bulls who came late to the party. After a rebound of similar magnitude in 2009, commodities peaked in 2011, moved sideways for three years, then plunged again.
Gold crumbled first, dropping about 30% in 2013. Oil followed in 2014, as West Texas Intermediate Crude plunged from over $100 a barrel to less than $30.
After that experience, it was no surprise to find few die-hard commodity bulls left. Most had given up, thrown in the towel and moved on to other markets.
Sure enough, while few investors were paying attention, first gold bottomed in late 2015, soaring over 30% by mid-2016.
Oil followed, with gains of nearly 50% last year.
And it’s not just gold and oil. The new commodity boom is broad-based, with the S&P GSCI Index up 28% last year, its biggest gain since 2009.
Predictably, commodities markets are now popular again. In fact, bullish bets on oil, copper and cotton futures just hit all-time record highs in January. Probably just in time for the next sharp correction.
But another asset class, which has struggled through a long down-cycle of underperformance, appears to be just turning up again and is now outperforming: Emerging Markets. The cycle has turned and it has a lot to do with the revival in commodities.
Many emerging market countries rely heavily on commodity exports to fuel their economies. So it’s no surprise that Brazil is up 15.3% already this year. Argentina jumped 15.7% and Chile has gained 9% — all of them big resource exporters.
But the cyclical upswing in emerging market stocks isn’t limited to commodity countries, it too is broad-based, a very bullish sign.
Emerging Asia in particular is enjoying a cycle of outperformance, a region Larry has been consistently bullish on. China is up 11.3% year to date, India is up 11.4% and the Hang Seng China Enterprises Index of Hong Kong-listed Chinese stocks has gained 8.8% — all well above the 6% gain registered by the S&P 500 Index.
Bottom line: My friend Larry Edelson knew better than most investors that: To everything (and every market) there is a season; turn, turn, turn. The cycle is just beginning to turn up for emerging market stocks with higher prices ahead.
Good investing,
Mike Burnick

-
I know Mike is a very solid investor and respect his opinions very much. So if he says pay attention to this or that - I will.
~ Dale G.
-
I've started managing my own investments so view Michael's site as a one-stop shop from which to get information and perspectives.
~ Dave E.
-
Michael offers easy reading, honest, common sense information that anyone can use in a practical manner.
~ der_al.
-
A sane voice in a scrambled investment world.
~ Ed R.
Inside Edge Pro Contributors

Greg Weldon

Josef Schachter

Tyler Bollhorn

Ryan Irvine

Paul Beattie

Martin Straith

Patrick Ceresna

Mark Leibovit

James Thorne

Victor Adair