
Timing & trends
Since December, I have been discussing the opportunity that existing in the potential for a rotation from the “risk-on”Trump Rally to the “risk-off” safety trade. I stated that in December we began buying these “risk off” trades based on this expectation and adding bonds, utilities, health care, preferred stocks and REIT’s to our portfolios.
The addition of bonds was also done under the premise that while the majority of analysis was discussing the long-term bottom in rates and the obvious move higher, I have not agreed. This is because “real inflation” remains nascent outside of health care and rent. The recent bump in commodity prices has also been a contributing factor to a small degree but has the negative side of fueling input costs that reduce corporate profitability. The rise in commodity prices, primarily oil, has been driven by a strengthening dollar which was something I discussed would happen in May of 2015.
Interestingly, Jeff Gundlach caught up with my stance last week discussing the “stealth rotation.” To wit:
“Not only is the Trump rally over, but stocks are the last to get the memo. That’s the current market summary according to DoubleLine’s Jeff Gundlach who told Reuters that ‘there is a stealth flight to safety going on.’
Among key indicators, Gundlach pointed to German Bunds and especially Schatz (2Yr), noting that ‘German bond yields are leading the way down and Gold is rising.’ He also warned that ‘speculators remain massively short bonds and the market is going to squeeze them out.’”
He is absolutely correct, and both of these are points I have made previously.
“Here is the most important point to remember. Just two months ago, we were told that U.S. equities should rise because bond yields would be low forever, discount rates should trend toward 0%, and therefore equity valuations should trend toward infinity over time.
Now, we’re told that despite bond yields surging we can still count on U.S. equities trending toward infinity because they’re better positioned to absorb higher rates than emerging markets.
It can’t be both.”
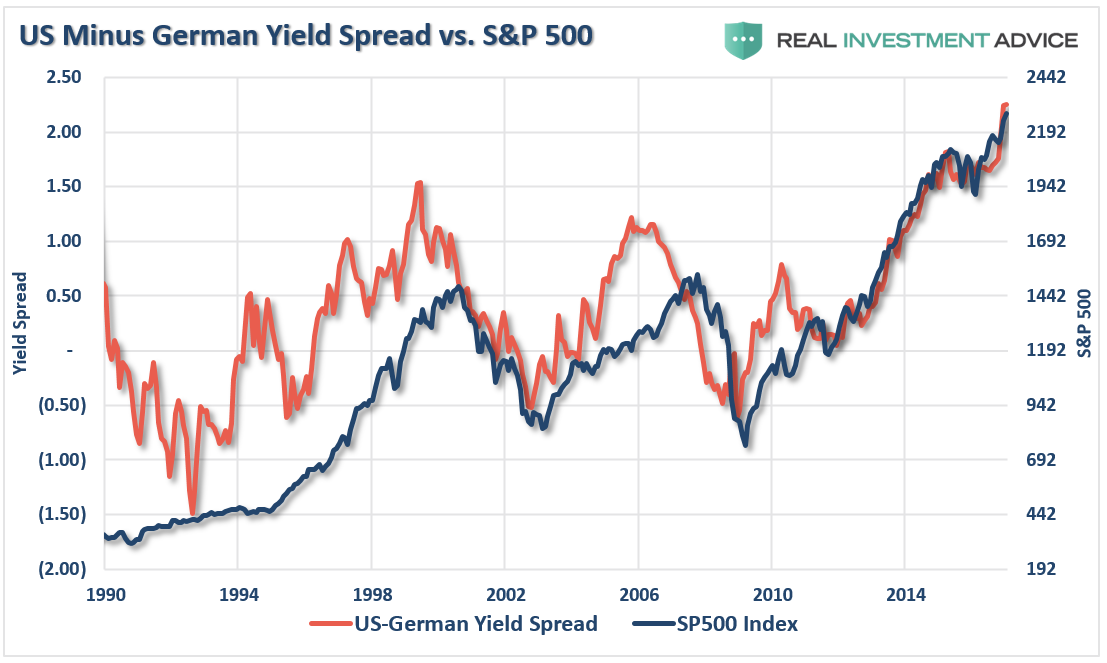
“The chart below shows the 10-year Treasury rate the German Bund rate. Not surprisingly, since rate spreads directly impact economic activity, trade, and currency flows, whenever spreads widen to such a degree, bad things have tended to happen.”

The following was published for our subscribers February 16, 2017.
Perspective
In July, the ChartWorks noted technical excesses in the Bond Future. We concluded that action in the US Treasuries was the least distorted and would be the best market to use to determine a major top. For technical analysis, the European market is too dominated by the ECB.
The peak in Treasuries was in July and we noted that the bull market in lower-grade stuff would likely continue. We also noted that the European government bonds would likely turn with US Treasuries. Which they have.
We are now getting technical excesses in Junk.
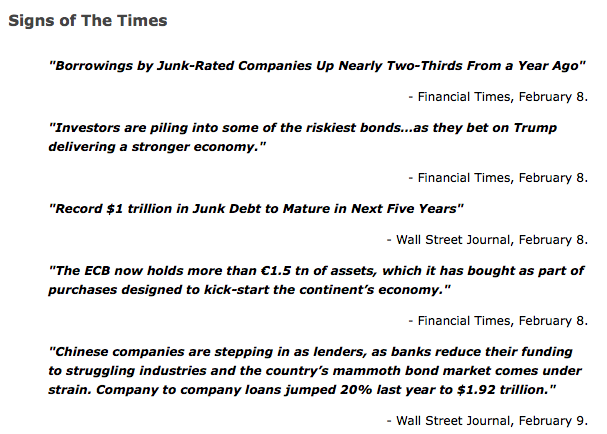
The headlines above, are recording the anecdotal aspects of a speculative blow-out in lower-grade bonds. It could be global.
The ECB wager that buying €1.5 trillion in assets would “kick-start” the economy rests upon the unproven notion that an economy can be “kick-started”. One might just as well try to kick-start a 747.
This kind of anecdotal record can be followed by panicdotal conditions.
Stock Markets
The American popular uprising now has a dynamic executive whose pro-business utterances have been catnip to equity traders.
We read about some big players on the wrong side of this move.
The rush to buy accomplished technical excesses in December, which we noted could be eased by a sharp correction. Instead, a modest correction has been followed by new highs, which have been driven by two things. Further announcements about reductions in taxation and regulation, which reality could be many months away. Still a positive prospect ahead.
More immediate, has been favourable action in industrial commodities, which has been likely to run into March.
Bond buying programs by central bankers are being thwarted, repeat thwarted, by market forces. Mother Nature has been fully engaged, Mister Margin is monitoring the action.
Over the past year, the combination of firming industrial commodities and narrowing spreads has been the main carrier of the uptrend. And, eventually, could be the agent of change, which we will be watching for.
The action has been likely to be positive into March. This is being confirmed by the Transports, which got out of their funk and are making new highs.
Central bank buying programs continue to look good. For how long?
As in 2015, we are now calling for a big Rounding Top.
Within this, the speculative surge that began in early November has been outstanding. In many ways, including in some series the best in a couple of decades. However, we have been wondering if the right-hand side of topping could extend beyond March. And to use economic jargon, “on the other hand” if crude rolls over, so does the stock market.
The “ABC” correction that the ChartWorks has been working on could start soon.
Credit Markets
The main driver for the banks (BKX) from June until mid-December was the steepening yield curve. From over-extended then, a correction followed to last week when the index found support at the 50-Day. That was at 92.5 and the jump to 97 suggests compulsive buying. Also, as we have been noting, there is the prospect of getting rid of Dodd-Frank, which is called the “Wall Street Reform and Consumer Protection Act”. Designed by congress it is more intrusion than protection.
Some who have studied Dodd-Frank have said it is worse than Obamacare.
As for reforming Wall Street – it has all been done – in 1934. The main intention of the SEC Act was to reform Wall Street so there would never be another financial bubble. One of the sponsors boasted that “It will put a cop at the corner of Wall and Broad Streets”.
Banks have done well despite the flattening curve, indicating that repealing D-F would be good for the sector. This has been almost discounted and the curve, so to speak, is away below the BKX.
Canadian banks such as RY are building outstanding technicals for an important high.
As noted last week, credit spreads as measured by JNK/TLT registered technical excesses in momentum and pattern. This was also registered with the peak of the Treasury action in July. The decline in the TLT has been from 143 to 117, at its worst.
A turn to widening seems imminent and would be a negative for global banks.
JNK accomplished technical excesses and the correction will be underway when the index takes out the 50-Day moving average.
Long Treasuries are poised for another brief bounce.
Commodities
Crude oil survived the huge and potentially negative COT numbers. Our position has been that after a seasonal setback in January, firming could run into March. So far, so good. A quick thrust to an overbought condition would complete the move.
Ross has a chart that says that 12 months after a crash low, an important high can be accomplished. Followed by an intermediate decline.
Base metals (GYX) have been expected to rally out to 332 in March. Severe pressures ended a year ago in January at 235 and the “Rotation” carried it to 283 in October. With the election results, it has rallied to 339, which accomplishes somewhat more than our goal.
It is overbought enough to suggest an intermediate correction.
Grains (GKX) have been acting well. We have had a target of 308, which has been the high-side of the trading range. A couple of weeks ago, we noted that it could be exceeded. At 318 now, there is resistance at 325.
Overall, commodities have had some good gains out of the disaster a year ago and are now eligible for an intermediate setback. The latest surge has been helped by the slide in the dollar, which is preparing for another significant rally.
Stock Leverage vs Spreads

- This measure of “Leverage” got crunched on the crisis into January 2016.
- Spreads have clocked remarkable narrowing.
- “Leverage” has eased a little but is still high.
- Spreads have reached technical excesses and are poised to reverse.
Oooops!

Source: Zero hedge
- Our work in July called for Treasury rates to increase.

Source: Zero hedge
US Drilling Rebounds

Source: Zero hedge
Governing Classes Need Governing

Link to February 17, 2017 Bob Hoye interview on TalkDigitalNetwork.com:
http://www.howestreet.com/2017/02/17/is-a-minor-market-correction-likely/
Anytime the Dow makes a new high you can be reasonably assured of hearing the B-word bounced around in the media. Memories of the last bubble are still vivid and painful enough to trigger flashbacks of the bubble’s collapse. It’s only natural then that investors fear a return of irrational exuberance. Despite these fears, the evidence of a newly formed bubble is surprisingly lacking, as we’ll uncover here.
Asset manager Jeremy Grantham famously defined a bubble as any asset whose price has moved at least two standard deviations above its longer-term statistical mean, or norm. This definition is too rigid, however, and can sometimes be misapplied to see bubbles where none actually exist. Markets can sometimes exceed the 2 standard deviation rule in non-bubble environments, as when the utilities sector last year experienced a 3 standard deviation event.
This definition also is overly reliant on statistics and is lacking in the psychology department. Investor psychology, after all, is a primary driving force of the pricing mechanism in all free markets. What Grantham’s 2 standard deviation event rule fails to consider is that if a market experiences a record-breaking and sustained run-up, it can sometimes occur without widespread participation by small traders and investors. And without large scale participation among retail traders the psychology of a bubble is lacking, i.e. there is no bubble.
The latest rally in the major stock market averages has once again fueled talk of a mania for equities in the popular press. As discussed in previous commentaries, though, there is as yet no evidence of widespread direct participation in the equity market by small investors. Much of the movement behind the rally to new highs is courtesy of institutional activity, with the public participating only indirectly via retirement savings funds. Nowhere to be seen is the incessant preoccupation with day trading, swing trading and stock picking which were symptoms of the last two bubbles.
One explanation for this startling lack of bubble psychology despite the all-time highs in stock prices is the K-wave. Readers of this commentary should be familiar with this most basic of all long-term economic cycles, which answers roughly to the 60-year equity market cycle. The K-wave deflationary descent bottomed in 2014 based on the Kress cycle count. K-waves are often divided into four sections or “seasons” with each section being assigned a season of the year (e.g. winter, spring, summer, fall). The following graph was devised many years ago by P.Q. Wall and does an admirable job of describing the K-wave seasons.

If we assume that K-wave winter season ended in 2014, we’re now in the early phase of K-wave spring. Early spring can easily be confused with winter due to the occasional freeze or snow storm that sometimes happens during the transition period between the two seasons. But as the season progresses the signs of new life and warmth that always accompany spring gradually become more evident. In that same vein, the last couple of years might easily have been confused with winter due to periodic outbursts of deflation in the global economy. Yet we’re starting to see unmistakable signs that K-wave spring has truly sprung, even in the weakest performing foreign markets.
To take one example, China’s stock market is starting to show renewed signs of life after being in a bear market the last two years. China has also recently begun trying to increase its economic growth by providnig plenty of credit. As Dr. Ed Yardeni has observed, “During January, total ‘social financing’ rose by a record $542.3 billion. That’s not on a y/y basis, but rather on a m/m basis! On a y/y basis, social financing totaled $2.7 trillion over the past 12 months through January. Bank loans, which are included in social financing, rose $335.7 billion during January m/m and $1.8 trillion over the past 12 months.”
The emerging markets have experienced a similar rebound along with several euro zone markets. As the U.S. leads the rest of the world out of global recession, there can be no denying that the K-wave is beginning to work its spring-time magic.
The aggressive policy stance by China’s central bank has led to worries that China’s real estate and stock markets may soon experience another bubble. This in turn has added to fears that the U.S. will soon experience another bubble event in the stock market. This need not concern us, however, since painful memories of the credit crisis are still strong enough among central bankers to prevent a bubble from forming, let alone get out of control. Even China’s last taste of an equity market bubble ended prematurely when frightened policy makers quickly tightened money and credit in fear of the consequences.
Now let’s assume for a minute, though, that a bubble was allowed to form in the U.S. equity market this year. Would this be such a bad thing? Considering that the biggest advances in technological progress and development, to say nothing of widespread prosperity, have occurred during bubbles it’s easy to answer that question in the negative. While the naysayers focus on the negative aspects of a bubble’s implosion they neglect to mention that even after the inevitable popping, society is still immeasurably better off than before the bubble began. Indeed, a bubble might be just what is needed to put the U.S. economy back on the right track for vigorous growth.
It should be added that when it comes to economic policy, it’s always best to err on the side of too much growth than on too much austerity. The events in Europe of recent years serve as a stark reminder of this fact. Thus whenever fears of a bubble are discussed, it would do policy makers well to consider that the benefits of a loose monetary policy always outweigh that of a tight one.
Probably the biggest argument used by the bubblemongers right now is the chart of the NASDAQ 100 Index (NDX). This chart can easily be used to justify the fear of an incipient bubble, yet the investor psychology and mass participation factors are curiously missing right now.
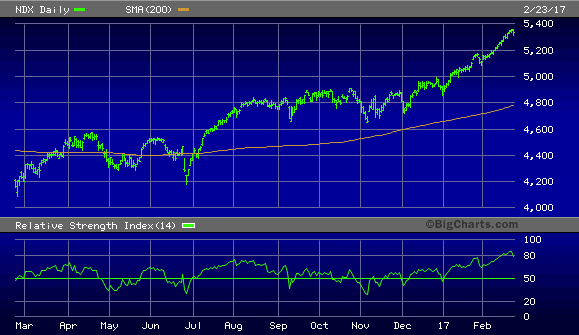
Before we arrive at the bubble stage, we should see increased interest bordering on obsession among small investors as the stock market becomes a primary focus among the masses. As this hasn’t yet happened, the inescapable conclusion is that the long-term bull market hasn’t reached bubble proportions yet and therefore has a ways to go before expiring.
….related: Big Bases: Big Moves in the World Stock Markets
Mastering Moving Averages
The moving average is one of the most versatile of all trading tools and should be a part of every investor’s arsenal. Far more than a simple trend line, it’s a dynamic momentum indicator as well as a means of identifying support and resistance across variable time frames. It can also be used in place of an overbought/oversold oscillator when used in relationship to the price of the stock or ETF you’re trading in.
In my latest book, Mastering Moving Averages, I remove the mystique behind stock and ETF trading and reveal a completely simple and reliable system that allows retail traders to profit from both up and down moves in the market. The trading techniques discussed in the book have been carefully calibrated to match today’s fast-moving and sometimes volatile market environment. If you’re interested in moving average trading techniques, you’ll want to read this book.
Order today and receive an autographed copy along with a copy of the book, The Best Strategies For Momentum Traders. Your order also includes a FREE 1-month trial subscription to the Momentum Strategies Report newsletter: http://www.clifdroke.com/books/masteringma.html
Short term Elliott wave view in DJIA (Dow Jones Industrial Average) suggests that the rally from 1/19 low is unfolding as a 5 waves Elliott wave impulse structure where Minute wave ((i)) ended at 20125.28, Minute wave ((ii)) ended at 19784.7, and Minute wave ((iii)) remains in progress.
Internal of wave ((iii)) is showing an extension and subdivided also as an impulse structure where Minuette wave (i) ended at 20155.3, Minuette wave (ii) ended at 20015.3, Minuette wave (iii) ended at 20639.8 and Minuette wave (iv) ended at 20532.6. Index has broken above Minuette wave (iii) to confirm that wave Minuette wave (v) has started. Up from 20532.6, Subminuette wave (i) of (v) ended at 20747.6, and Subminuette wave (ii) of (v) is proposed complete at 20677.4.
Near term, while dips stay above 20541.2, expect Index to resume higher. We don’t like selling the Index and expect buyers to appear in 3, 7, or 11 swing while Index remains above Minuette wave (iv) at 20532.6. If Index breaks below 20538.7, it can be an indication that Minute wave (iii) has ended, and that Index has started Minute wave (iv) pullback.
DJIA 1 hour chart

Elliott Wave Degree

At Elliottwave-Forecast, we offer 24 hour coverage of 52 instruments from Monday – Friday using Elliott Wave Theory as primary tools of analysis. We provide Elliott Wave chart in 4 different time frames, up to 4 times a day update in 1 hour chart, two live sessions by our expert analysts, 24 hour chat room moderated by our expert analysts, market overview, and much more! With our expert team at your side to provide you with all the timely and accurate analysis, you will never be left in the dark and you can concentrate more on the actual trading and making profits. Check out our 14 day Trial to sample everything we have to offer.
The following graph shows the SI/GC ratio versus the S&P500 index beginning in August 1971 when President Nixon severed the final gold backing of the US dollar. Currency in circulation, debt, consumer cost of living, and most prices including gold, silver, crude oil, and the S&P rose in devalued dollar units.
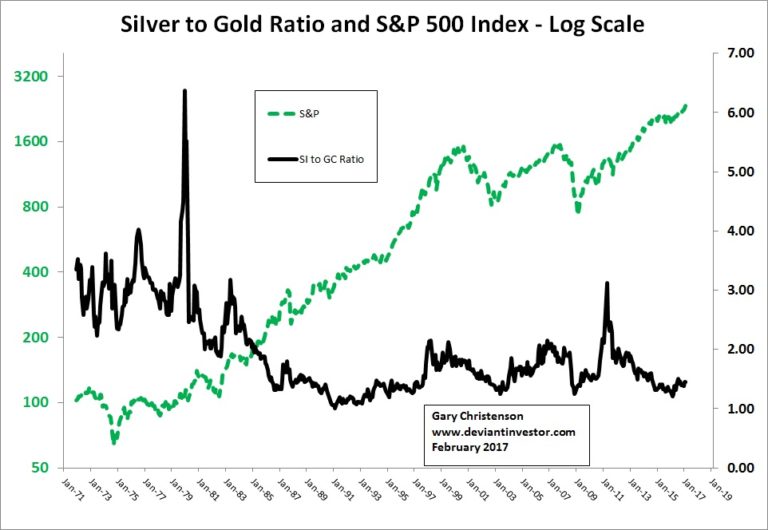
The two lines follow each other over long periods, and diverge during other periods. The next graph shows the same monthly data but smoothed with a ten month moving average. I divided the graph into four sections:
- August 1971 – January 1980. The dollar “floated” lower, silver and gold rose in a parabolic bubble, the economy grew slowly, and “stagflation” was dominant in the United States.
- February 1980 – February 1991. Gold and silver corrected and silver hit a low of $3.51 in February 1991. The S&P moved higher.
- March 1991 – April 2011. Silver rallied from $3.51 to nearly $50.00.
- May 2011 – February 2017. Silver and gold corrected and the S&P rallied.

Statistical Correlation:
These dates are important for silver and gold prices. Examine the statistical correlation (excel calculated) for the SI/GC ratio compared to the S&P500 Index.
- August 1971 – January 1980. Correlation = +0.28
- February 1980 – February 1991. Correlation = -0.79
- March 1991 – April 2011. Correlation = +0.91
- May 2011 – February 2017. Correlation = -0.93
These are interesting positive and negative correlations! How are these periods similar and different?
- Stagflation: The 1970s was the decade of “stagflation.” Interest rates and commodity prices rose, the nation was deeply divided politically, and the S&P was mostly flat. It was a difficult time for most Americans as debt and prices increased while incomes slowly followed. American prestige declined. 2017 – 2025 could be a repeat of the 1970s.
- Correction: The correction period saw the collapse of gold and silver prices and a bull market in stocks.
- Rally phase: Almost all markets rallied when measured in devalued dollar units. Gold set a new all-time high (August 2011) and silver approached its 1980 bubble high. Central banks exercised more control over markets, engaged in monetary nonsense such as QE, near zero interest rates, direct purchase of equities, trillions of dollars in swaps, guarantees, taxpayer funded bail-outs, and policies that supported a “no banker left behind” mentality.
- Levitation phase: Central bankers panicked and forced interest rates down to negative yields in Europe and Japan, purchased equities and ETFs, levitated stock and bond markets and created all-time highs in stock indices. Gold and silver dropped 40 – 70% while China, India, Russia and Turkey purchased massive quantities of gold bullion in the west, refined it into kilo bars, and shipped it to Asia.
WHAT CHANGED DURING THE LEVITATION PHASE BETWEEN MID-2011 AND TODAY?
- U. S. national debt increased by $5.6 trillion, about 39%. (Borrow and spend and spend and spend…)
- U. S. student loans increased by $0.60 trillion, about 70%. (Let the defaults begin.)
- U. S. auto loans increased by $0.3 trillion, about 40%. (More defaults coming.)
- U. S. corporate debt increased by $1.5 trillion, about 125%. (Buy back stocks to boost CEO compensation.)
- The Federal Reserve balance sheet increased by $1.8 trillion. (Buy toxic debt with “funny money” and make the debt disappear.)
- The S&P 500 Index increased by 1,000 points, about 74%. (Levitation works. Too bad about employment, good jobs, pension plans, savers, small businesses and middle America…)
- Silver dropped from nearly $50 in April 2011 to about $18 in February 2017, down about 63%. (A rally too far and too fast followed by a deep correction.)
- Gold dropped from over $1,900 in August 2011 to about $1,240 in February 2017, down about 36%. (Don’t let gold reach $2000 and fantasize all is well in central banker land. Read “Fed Up.”)
- The silver to gold ratio declined. The next major moves should be rallies in silver and gold, a correction in the S&P 500, weak growth and a repeat of stagflation.
SUMMARY:
BUSINESS AS USUAL: The U. S. government borrowed and spent and the Federal Reserve bailed out the largest banks. Students, auto owners, and corporations increased their debt loads, and newly “borrowed into existence” dollars levitated the stock and bond markets. Debt enlarged, fiscal and monetary nonsense prevailed, banker bonuses increased, pension plans were crippled and savers were hurt by near-zero interest rates.
BONDS TURNED DOWN: Bonds turned down last July and stocks could correct at any time. Trillions of digital dollars could disappear in days if stock and bond markets collapse, but the debts will remain.
Regardless of how quickly and harshly the fiat currency, bond, and stock bubbles collapse, gold and silver will remain real money and valuable.
“I view gold as the primary global currency.”
Alan Greenspan
THE UNITED STATES IN EARLY 2017:
Equities sell for all-time highs and at historically high valuations by many measures. Bonds have probably entered a bear market, like the 1970s. Equities trade in the zone where we should expect a correction or crash even though central banks are blowing bubbles and levitating markets via direct purchases and ever increasing debt.
Interest rates bottomed in July-August 2016 and probably finished a 35 year bull market. Rising interest rates will hurt government finances, real estate purchases, derivatives, corporate stock buy-backs and central bank credibility. Remember the 2008 crisis and read Charles Hugh Smith regarding a “Shrinking Pie.”
Silver, gold, and their mining stocks turned upward after their December 2015 lows. New all-time highs lie ahead.
THE RETURN OF STAGFLATION:
- Expect higher interest rates, lower stock prices and more political turmoil. Debt ceiling debates, increased military spending, more wars, tax increases, token budget cuts, and other issues such as the dreaded transgender bathroom controversy will occupy our leaders.
- Expect aggressive national participation in the “blame game.” Blame will be directed toward Russia, China, ISIS, Trump and Obama.
- Expect the S&P 500 Index and the Dow Jones Industrial Average to correct and possibly crash toward normal valuations.
- Expect the economy to grow slowly or decline due to overwhelming debt. A weak economy + higher prices = Stagflation!
- Expect a vicious repeat of the “stagflation” of the 1970s but with prices rising far more rapidly than incomes, except for the top 1%.
- Expect silver, gold, mining stocks and the silver to gold ratio to rise rapidly in 2017 and 2018.
- Expect melting snowflakes in late spring and summer.
Gary Christenson
The Deviant Investor


-
I know Mike is a very solid investor and respect his opinions very much. So if he says pay attention to this or that - I will.
~ Dale G.
-
I've started managing my own investments so view Michael's site as a one-stop shop from which to get information and perspectives.
~ Dave E.
-
Michael offers easy reading, honest, common sense information that anyone can use in a practical manner.
~ der_al.
-
A sane voice in a scrambled investment world.
~ Ed R.
Inside Edge Pro Contributors

Greg Weldon

Josef Schachter

Tyler Bollhorn

Ryan Irvine

Paul Beattie

Martin Straith

Patrick Ceresna

Mark Leibovit

James Thorne

Victor Adair