
Timing & trends
 1. Hang Onto Your Hat – Trump Rally Nowhere Near Over
Things are not good in Europe and investors there are flooding into the North American Stock Markets. Much higher numbers in the next 4-5 years. What about the Free Trade agreement with Europe?
2. Is the Gold Silver Ratio Predictive?
Precious metals bear markets always hit silver hard, while bull markets always see Silver outperform gold. As a result, the Gold Silver Ratio rises during bear markets and then falls during bull markets.
3. Is This What They Mean By “Crack-Up Boom”?
In the past year, stock prices have risen from “near-record, overvalued-by-every-historical-measure” levels, to “new-record, grossly-overvalued” levels – and show no signs of slowing down

 Gold is setting up for a historic rally based on my analysis. Recent news provides further evidence that the Precious Metals and Currencies are in for a wild ride. Just this week, news that China’s reserves fell below $3 Trillion as well as the implications that the fall to near $2T in reserves could happen before the end of 2017. Additionally, we have recent news that the EU may be under further strain with regards to Greece, the IMF and debt. The accumulation of Precious Metals should be on everyone’s mind as well as the potential for a breakout rally.
Based on my analysis, I would estimate that near June or July 2017, Gold will be near $1315 ~ $1341 (+13% from recent lows). This level correlates to a Fibonacci frequency that has been in place for over 3 years now. A second Fibonacci frequency rate would put the project advancement levels, possibly closer to October/November 2017, near $1421 (+21% from recent lows). After these levels are reached, I expect a pullback to near $1261 if the Gold rally ends near $1315~1341 or to near $1308~1309 if the Gold rally ends near $1421. This pullback would setup a massive next wave rally to $1585 or $1731. So, if you need confirmation of this move, just wait for any rally to end above $1315, then wait for a pullback below $1280 or $1315 and BUY.
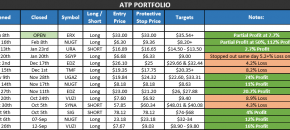
Subscribers and followers of my work profited handsomely this month locking a 112% profit with NUGT ETF with my service at ActiveTradingPartners.
QUESTION: Marty is the rumor true that there is huge short-covering going on that is taking the US share market higher?
ANSWER: Of course. As I have stated, our model tends to show the point of no return is in the 23000 level, not here. This rally since 2009 has been the most BEARISH rally ever in history. Think of this like the mirror image of gold. Gold has declined for 5 years and you have people screaming here we go with ever $20 rally. In the stock market, it has been exactly the opposite. Every time the market decline, they say here we go it will crash by 70-90%.
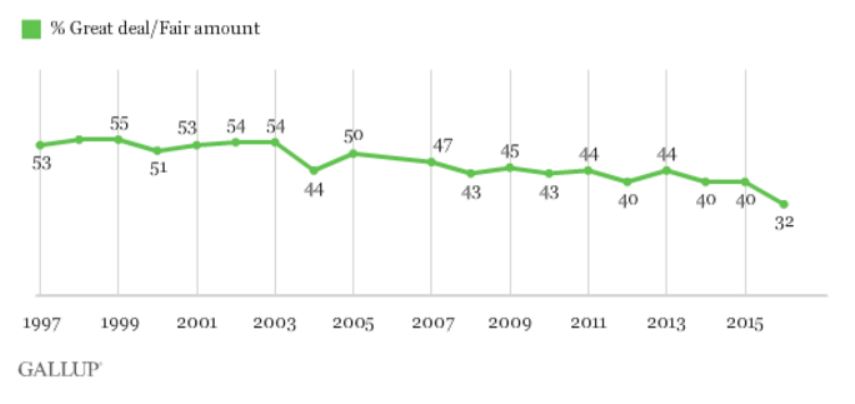
This is what I mean that the MAJORITY must always be wrong for they are the fuel that moves markets. I have been stating persistently that the Dow cannot “C R A S H” when the majority are bearish and retail participation is at historic lows (see Gallup poll).
The only real buyers have been due to the dollar, and sophisticated traders. The bulk of everyone else are BEARISH and cannot bring themselves to buy for they are still fighting the last rally in 2007 when they got caught. Therefore, the bulk of buying is short-covering – not fresh longs. This is very important. Fresh longs buying new highs turn sellers on a downturn. Short-covering does not. They may attempt to short against, but typically into a low – not highs.
So yes, there has been serious short-covering. That has been the bulk of this immediate rally and the relentless new highs each day. Only when the market crosses the 23,500 level do we see people surrendering and saying S H I T this is just going up. Until then, it will rally to each of our levels, stop briefly, and then proceed as long as we do not hit a turning point in TIME.
Others will point to this short-covering to then proclaim – See. This rally is not real and it will crash by 90% any moment now. This is why it is not over until the fat lady sings – or perhaps in this case, goes broke and screams.
All collapses unfold from highs with longs in panic. Major lows take place with shorts in panic. Short-covering at this stage demonstrates this is by no means a MATURE rally and we have a lot to go. Those who lost in 2007, just cannot bring themselves to say buy. This is why retail participation remains at historic lows. As long as that prevails, there is no way we have sufficient longs buying the highs from which a panic can then unfold by scaring the herd.
Here is the gold low in 1985. It bottomed on February 26th and on March 18th-19th a panic short-covering began. It was not people going long. It was shorts in panic. Merrill Lynch at that time hired me to TEACH one of their clients in Switzerland how to trade. They said they would pay all expenses and pay my hourly rate for the entire time even sleeping. I ask who the hell was this? It turned out he created the biggest deficit in history up to that point $25 million in gold. He was short and that is the loss over and above what he had in the account. Keep in mind the biggest hedge fund was $100 million back then.
It is routinely short-covering that created the major breakouts and lows, just as it is panic selling from longs that cement major highs. This is why I say after years of being called in to some of the biggest disasters in trading over the last 40 years, my conclusion is simply the MAJORITY must always be wrong.

The stock market continues to make new highs, yet none of the signs which accompany a market bubble are evident. Investors are asking, “When will the Dow finally correct?” By “correct” they mean “decline.” However, a market correction doesn’t always entail a decline for the major averages and can sometimes take the form of a lateral consolidation or trading range. That appears to be the case for the 2-month period from December through early February when the Dow and S&P made little headway.
In fact, in January the Dow Jones Industrial Average (DJI) recorded its tightest trading range of only 1.1% in over 100 years. This continues a prolonged sideways pattern in the Dow and other averages since mid-December when the post-election rally reached a plateau. The question everyone was asking was whether this plateau was merely a temporary “pause that refreshes” in an ongoing rally or the end of the rally and the prelude to another market setback. The Dow provided the answer to that with the last week’s breakout above the top of the trading range ceiling. It has rallied each day since, putatively on the hopes generated by President Trump’s forthcoming tax-related announcement.
While the bull market in equities continues, a surprising number of investors are either mistrustful of the rally or outright bearish. According to a recent article in BBC News, there are a growing number of wealthy and politically liberal U.S. citizens who are doing things in the wake of Donald Trump’s election that were commonly seen by politically conservative citizens during the Obama years. That is, they are buying guns, becoming survivalists, and preparing for an impending catastrophe related to the Trump presidency, the article reported.
It was also reported that a number of wealthy Americans are preparing for what they believe is the apocalypse. According to Business Insider, some have purchased underground bunkers while other wealthy individuals are planning to emigrate to New Zealand. “Saying you’re ‘buying a house in New Zealand’ is kind of a wink, wink, say no more,” said Steve Huffman, CEO of the Reddit web site. “Once you’ve done the Masonic handshake, they’ll be, like, ‘Oh, you know, I have a broker who sells old ICBM silos, and they’re nuclear hardened, and they kind of look like they would be interesting to live in.”
The common denominator in these accounts is fear among the upper class. The dread of an uncertain future which was pervasive among America’s middle class for much of the last eight years has now been transferred to the upper class. While it might be premature to ascribe this to the recent rush back into gold, bond funds and other safe-haven investments, it would seem that there is just enough uncertainty among the upper crust to account for the lack of movement in the major stock market indices since December.
Tight, narrow trading ranges in the major indices are launching pads for major moves in either direction. In the context of a bull market, they typically represent rest and consolidation before the next move higher. The odds technically favored this outcome, yet a substantial number of investors still don’t believe in the strength of the bull market. This is reflected in the manifestations of fear among the upper class mentioned above, as well as in the path the market rally is taking.
There is talk among some observers that the market is undergoing a “melt-up”. This is an erroneous application of that term. A classic melt-up is characterized by a runaway, almost straight-up and sustained market rally on high volume with widespread participation. The trajectory of the major indices since November can hardly be described as “melting up.” Rather, the market’s path has been measured and well-ordered, as the daily chart of the NYSE Composite Index (NYA) attests.

The real melt-up phase of this bull market hasn’t even started yet. We’ll know it has arrived when we see runaway stock prices coupled with increased participation among the legion of retail investors still on the sidelines. Even institutional investors are surprisingly tempered in their usual optimism, as expressed in their collective 2017 forecasts. Melt-ups have a way of surprisingly even the bulls in how high they carry the market averages before peaking. For now, though, a combination of fear and cautious optimism holds sway among investors and this alone is enough to argue that the bull market still has legs.
Mastering Moving Averages
The moving average is one of the most versatile of all trading tools and should be a part of every investor’s arsenal. Far more than a simple trend line, it’s a dynamic momentum indicator as well as a means of identifying support and resistance across variable time frames. It can also be used in place of an overbought/oversold oscillator when used in relationship to the price of the stock or ETF you’re trading in.
In my latest book, Mastering Moving Averages, I remove the mystique behind stock and ETF trading and reveal a completely simple and reliable system that allows retail traders to profit from both up and down moves in the market. The trading techniques discussed in the book have been carefully calibrated to match today’s fast-moving and sometimes volatile market environment. If you’re interested in moving average trading techniques, you’ll want to read this book.
Order today and receive an autographed copy along with a copy of the book, The Best Strategies For Momentum Traders. Your order also includes a FREE 1-month trial subscription to the Momentum Strategies Report newsletter:
http://www.clifdroke.com/books/masteringma.html
Clif Droke is a recognized authority on moving averages and internal momentum. He is the editor of the Momentum Strategies Report newsletter, published since 1997. He has also authored numerous books covering the fields of economics and financial market analysis. His latest book is Mastering Moving Averages. For more information visit www.clifdroke.com
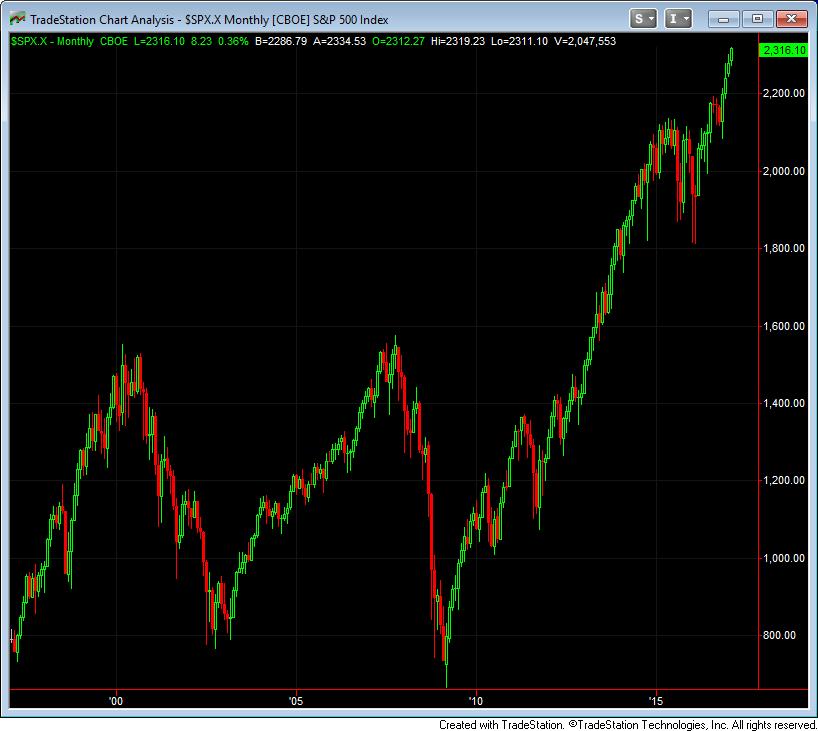
If there’s any point in U.S. stock market history, next to the market peaks of 1929 and 2000, that has deserved a time-stamp of speculative euphoria that will be bewildering in hindsight, now is that moment. Perhaps there’s room for this burning wick to shorten further, but across every effective, value-conscious, historically-informed classification method we use, the estimated downside risk of the market overwhelms its upside potential. The chart below shows monthly candlesticks for the S&P 500 Index since 1996, including the tech bubble and collapse, the Fed-induced mortgage bubble and collapse, and the speculative first half of the current, wholly uncompleted cycle. I believe the equity market now faces the likelihood of deeper losses over the completion of this cycle than any other in history, save for the collapse that followed the 1929 peak.
….also from Martin Armstrong: Eastern Europe & World War III

-
I know Mike is a very solid investor and respect his opinions very much. So if he says pay attention to this or that - I will.
~ Dale G.
-
I've started managing my own investments so view Michael's site as a one-stop shop from which to get information and perspectives.
~ Dave E.
-
Michael offers easy reading, honest, common sense information that anyone can use in a practical manner.
~ der_al.
-
A sane voice in a scrambled investment world.
~ Ed R.
Inside Edge Pro Contributors

Greg Weldon

Josef Schachter

Tyler Bollhorn

Ryan Irvine

Paul Beattie

Martin Straith

Patrick Ceresna

Mark Leibovit

James Thorne

Victor Adair