
Timing & trends
As we have repeatedly warning, anyone who is betting on the Trump Presidency unleashing a massive $USD bull market in the near future is going to get taken to the cleaners.
This has already begun…
One of the single most dangerous traps for traders to avoid is a “False Breakout.”
False breakouts are moves in which an asset “breaks out” of a formation, leading many to believe that the move is legitimate… then suddenly KA-BLAM, the move reverses violently.
See the $USD today. This looks more and more like a false breakout, which means YES, the $USD is going to sub 90s if not lower within 12 months.
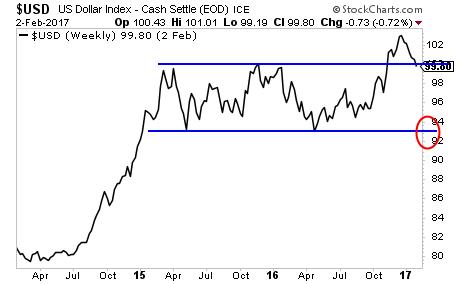
Those who believe Trump wants the $USD above 100 are not paying attention. Similarly, those who believe that the Fed can and will raise rates three times in 2017 are missing the big picture.
NEITHER OF THOSE IS GOING TO HAPPEN. And if you’re investing based on them, you’re in for a LOT of pain.
Originally posted on http://gainspainscapital.com
Best Regards
Graham Summers


- We believe active investors’ success in adding value in Canada’s markets in 2017 will hinge on their ability to navigate an increased probability of extreme economic outcomes – both good and bad.
- Left-tail outcomes could result from protectionist U.S. trade policy, including Donald Trump’s promised renegotiation of NAFTA, and the potential for higher interest rates that would affect Canada’s debt-laden consumers and detract from GDP growth by lowering consumption and residential investment.
- Right-tail opportunities could develop if pro-growth policies in the U.S. drive economic growth north of the border by spurring exports and business fixed investment.
- As U.S. rates rise, we would expect Canadian rates to rise and for the yield curve to steepen. However, the Bank of Canada’s more accommodative stance would likely translate to a slower pace of increases than in the U.S.
….continue reading for the & “Invesment Implications” HERE
…related from Michael:
For Canada the Trump Effect Is Unavoidable
Our recent analysis bases on a previous report of the potential for a further run in the US markets based on a number of technical and fundamental factors leads to the question of “what could happen with Gold and Silver”. A broad US market rally may put some pressure on the metals markets initially, but, in our opinion, the increase in volatility and uncertainty will likely prompt more potential for upward price action in precious metals.
As with most things in the midst of uncertainty and transition, the US Presidential election has caused many traders to rethink positions and potential. As foreign elections continue to play out, wild currency moves are starting to become more of a standard for volatility. Combine this with a new US President and a repositioning of US global and local objectives and we believe we are setting up for one of the most expansive moves in recent years for the US general markets and the metals markets. This week, alone, we have seen a flurry of action in DC and the US markets broke upward on news of the Dakota Pipeline and other Executive actions.
As we wrote week or so ago, we believe the US markets will push higher in 2017 a business investment, US strategy and foreign capital runs back into the US equity market chasing opportunity and gains. Additionally, we believe the strength of the US market, paired with continued strength of the US Dollar, will drive a further increase in global volatility and wild swings in foreign markets. This volatility, uncertainty and equity repositioning will likely drive Gold and Silver to continued highs throughout 2017 – possibly much longer if the new trend generates renewed follow-through.
Our belief that the US markets will continue to melt-up while certain foreign markets deteriorate relates to our belief that currency variances will become more volatile and excessive over the next few months. This, in combination with a renewed interest in developing US economic solutions, will likely drive the US markets higher while the metals markets will continue to become a safe-haven for US and foreign investors to protect against deflation and foreign market corrections.
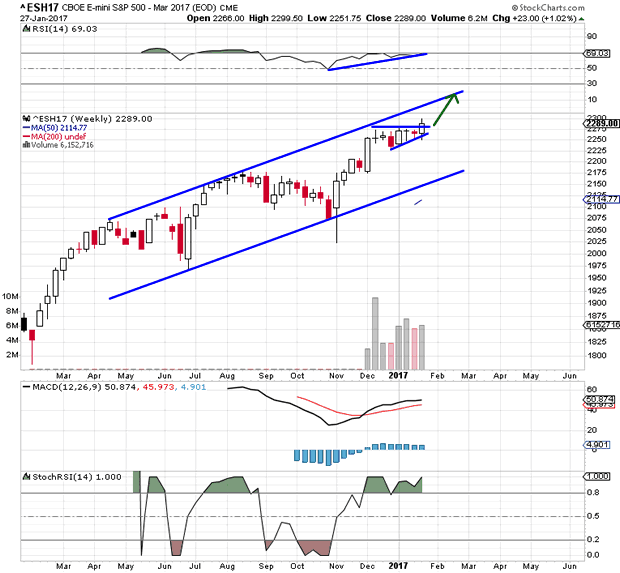
S&P Futures are setting up a clear bullish pennant/flag formation that will likely prompt an explosive price move within 2~3 weeks. This bullish flag formation is likely to drive the ES price higher by roughly 100+ pts. Currently, strong resistance is just above 2275, so we’ll have to wait for this level to be breached before we see any potential for a bigger price move.
SP500 Weekly Chart
SP500 Daily Chart

GOLD is channeling in a very clear and narrow upward price channel and trading in the middle of a support zone. The recent reversal, near the end of 2016, was interesting because GOLD trailed lower after the US election, but then reversed course just before the new year. The interesting fact about this move is that this new upward swing in GOLD correlates with the beginning of the Bullish Flag in the S&P Futures as well as a decrease in volatility. We believe as this Bullish Flag will prompt a jump in volatility and price action that will result in is a strong push higher in GOLD.
GOLD Weekly Chart

Gold Daily Chart

SILVER is setting up in a similar manner as GOLD. Although the SILVER chart provides a clearer picture of the downward price channel that is about to be breached – and likely drive both SILVER and GOLD into a new bullish rally. The support Zone in SILVER, between $16.60 ~ $17.40 is still very much in play. SILVER will likely stay within this zone while the Bullish Flag plays out. Yet, when the breakout begins, a move above $18.00 will be very quick and upside targets are $18.50~18.75 and $19.50~$20.00 (possibly much higher in the long run).
Silver Weekly Chart

Silver Daily Chart

EUR/USD correlation to the US moves should be viewed as measure of strengthening US economy/USD as related to foreign market volatility and potential. As the USD strengthens, this puts pressure on foreign governments and global transactions based in USD. This also puts pressure on the METALS markets because billions of people around the globe consume precious metals as a “safe-haven” related to currency volatility. We expect the EUR/USD levels to fall near “parity” (1.00) again and possibly dip below parity based on future foreign election results. This volatility and uncertainty will translate to increased opportunity for GOLD and SILVER to run much higher over the next few months.
EURUSD Daily Chart

USDMXN Daily Chart

USDGBP Daily Chart

Right now is a fantastic opportunity to take advantage of these lower prices. We may see rotation near to the lower support zone levels as price rotates over the next few weeks. The key to any trade in the metals market is to understand the potential moves and watch for confluence and volatility in other markets. We believe the next few weeks/months will be very telling. If we are correct, we’ll see new highs in the US markets fairly quickly and we’ll see a new potential bullish breakout in GOLD and SILVER.
You can follow our weekly analysis and trade ideas at www.TheMarketTrendForecast.com

 1. All major economies, USA, China, Japan, Europe and Emerging markets have debt which have grown exponentially and will never be repaid.
2. The financial system has a gross exposure of over $2 quadrillion. This will all collapse when counterparty fails.
3. With the Trump administration leading, the world will soon enter the final spending spree which will accelerate the velocity of money and lead to hyperinflation. This will in turn finish off the value of most major currencies until they reach zero.
4. 1-3 above will result in a deflationary implosion of the financial system. This will get rid of all debt and reduce the value of most assets by at least 90%.
5. This total debt destruction is the only way to put a world on a sound footing for future growth and prosperity.
….read more including the antidote HERE
also:
January 27, 2017
Today’s videos and charts (double-click to enlarge):
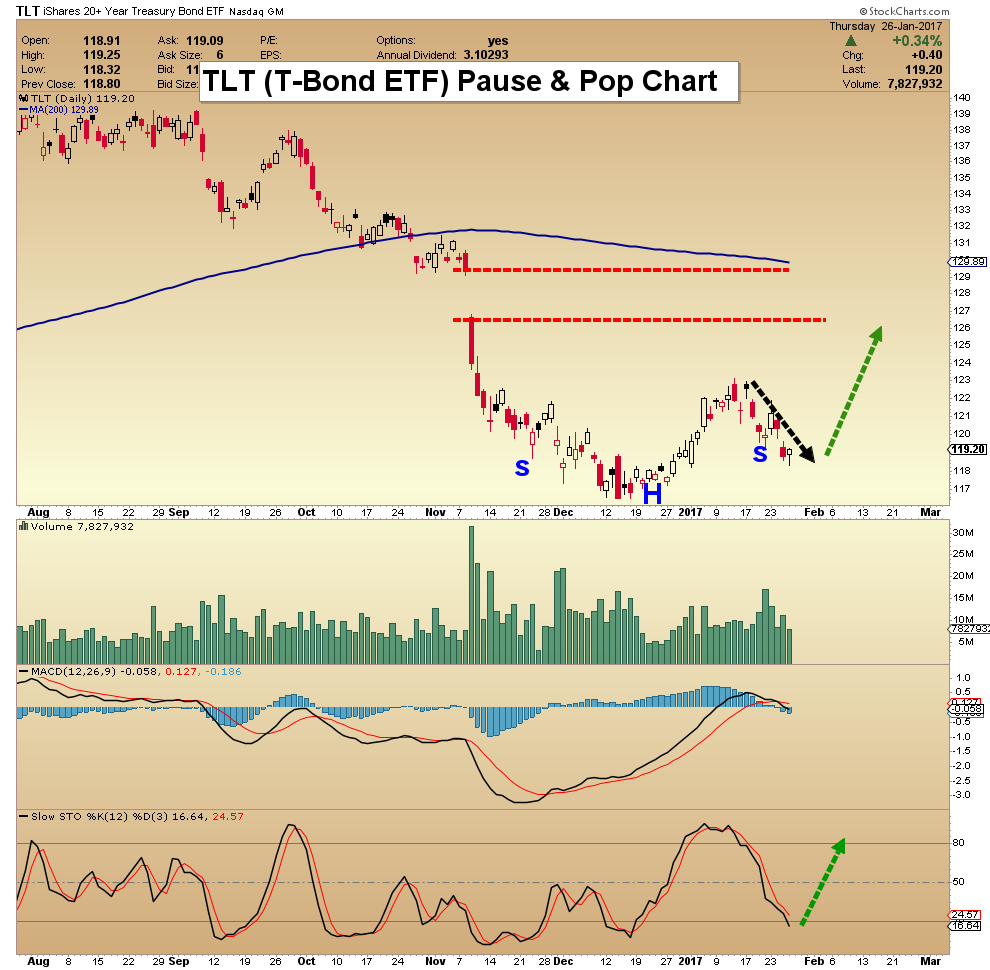
Gold, Silver, & T-Bonds Key Charts Video Analysis


SFS Key Charts & Tactics Video Analysis

SF60 Key Charts & Tactics Video Analysis


SF Trader Time Key Charts Video Analysis


Thanks,
Morris
The SuperForce Proprietary SURGE index SIGNALS:
25 Surge Index Buy or 25 Surge Index Sell: Solid Power.
50 Surge Index Buy or 50 Surge Index Sell: Stronger Power.
75 Surge Index Buy or 75 Surge Index Sell: Maximum Power.
100 Surge Index Buy or 100 Surge Index Sell: “Over The Top” Power.
Stay alert for our surge signals, sent by email to subscribers, for both the daily charts on Super Force Signals at www.superforcesignals.com and for the 60 minute charts at www.superforce60.com
About Super Force Signals:
Our Surge Index Signals are created thru our proprietary blend of the highest quality technical analysis and many years of successful business building. We are two business owners with excellent synergy. We understand risk and reward. Our subscribers are generally successfully business owners, people like yourself with speculative funds, looking for serious management of your risk and reward in the market.
Frank Johnson: Executive Editor, Macro Risk Manager.
Morris Hubbartt: Chief Market Analyst, Trading Risk Specialist.
website: www.superforcesignals.com
email: trading@superforcesignals.com
email: trading@superforce60.com
SFS Web Services
1170 Bay Street, Suite #143
Toronto, Ontario, M5S 2B4
Canada

-
I know Mike is a very solid investor and respect his opinions very much. So if he says pay attention to this or that - I will.
~ Dale G.
-
I've started managing my own investments so view Michael's site as a one-stop shop from which to get information and perspectives.
~ Dave E.
-
Michael offers easy reading, honest, common sense information that anyone can use in a practical manner.
~ der_al.
-
A sane voice in a scrambled investment world.
~ Ed R.
Inside Edge Pro Contributors

Greg Weldon

Josef Schachter

Tyler Bollhorn

Ryan Irvine

Paul Beattie

Martin Straith

Patrick Ceresna

Mark Leibovit

James Thorne

Victor Adair