
Timing & trends
It’s been an up and down week for crude oil futures with the price action playing out as expected. Going into the new year, we were looking for a choppy, two-sided traded largely because of the uncertainty regarding compliance with the OPEC/Non-OPEC plan to cut production, trim supply and return price stability to the market.
On the upside, we expected prices to be capped by rising U.S. production, while on the downside, prices were expected to be supported by reports that countries who had agreed to limit production would announce compliance with the plan. Based the price action this week, we can conclude that we’ve seen a little of both.
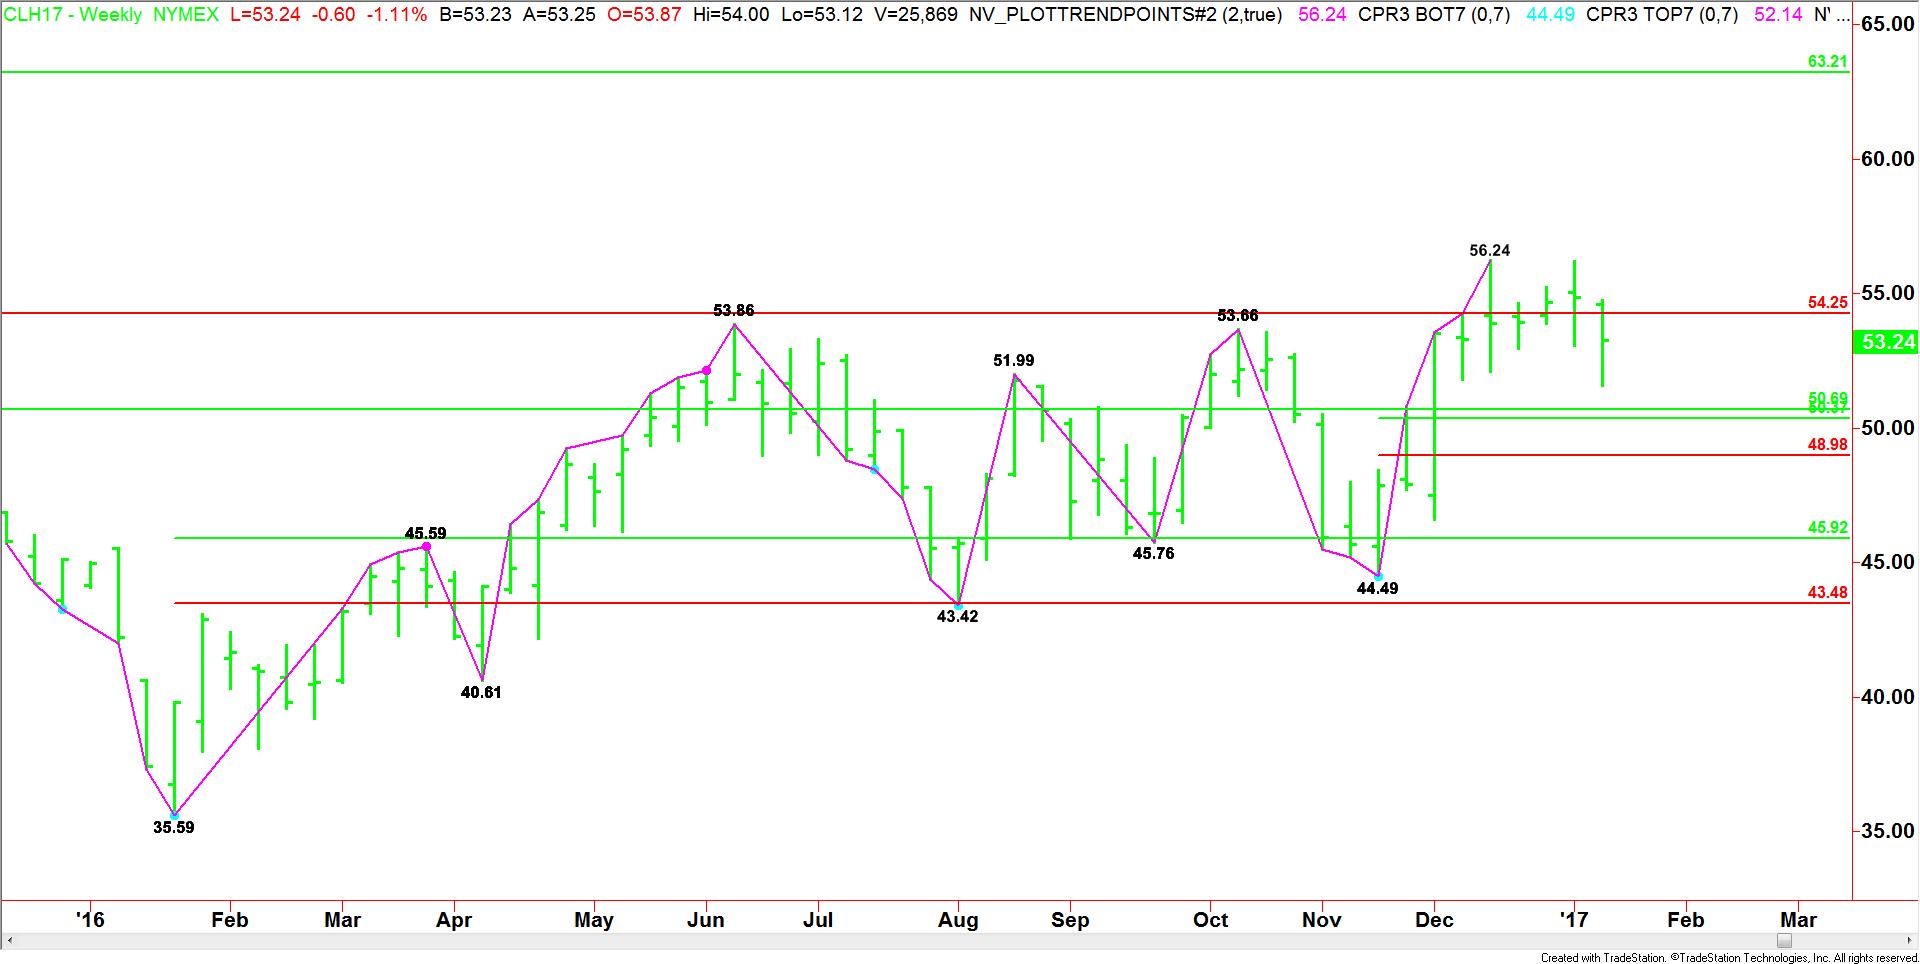
Weekly West Texas Intermediate Crude Oil
The main trend is up according to the weekly swing chart. However, momentum has been sideways for the last four weeks. A trade through $56.24 will signal a resumption of the uptrend. A trade through $44.49 will change the trend to down.
Given the average weekly range, it’s pretty safe to say the uptrend is safe next week.
The major 50% to 61.8% retracement zone is $50.69 to $54.25. The market is currently straddling this zone and to be specifically, it is straddling the Fibonacci level at $54.25.
Based on the price action since December 16, the direction of March Crude Oil next week will be determined by trader reaction to the Fib level at $54.25.
Bearish Scenario
A sustained move under $54.25 will indicate that momentum is shifting to down. This could trigger a break into a 50% support cluster at $50.69 to $50.37. Since the main trend is up, we could see enough buyers come in on a test of this level to trigger a technical bounce.
If enough buyers come in at $50.69 to $50.37 then look for the formation of a secondary higher bottom. This may mean that traders are setting up to make a run at $56.24 over the near-term. If support fails at $50.37 then look for the selling to extend into $48.98.
The short-term Fib at $48.98 is very important to the structure of the chart pattern. If it fails then look out to the downside because the next major support doesn’t come in until $45.92 to $43.48.
Bullish Scenario
Overcoming $54.25 will indicate the presence of buyers. This could generate enough upside momentum to challenge the high at $56.24. This price is the trigger point for the start of a strong rally with the next likely target $63.21 over the near-term.
Conclusion
I think we’ve seen enough price action and order flow over the past month to conclude that trader reaction to $54.25 will tell us if the bulls are maintaining control or if the sellers are taking control.
Despite the uptrend on the weekly chart, the eye test tells us that March WTI Crude Oil is rangebound. On the support side, it is being held up by expectations that the OPEC/non-OPEC deal to curb production will attract 100% compliance. The OPEC spin machine is also peppering the news with positive stories.
The market, however, is being capped and perhaps taken over by worries about increased U.S. production. In my opinion, all it is going to take is only one negative story about non-compliance with the plan to trim production to trigger a steep sell-off.
This is likely to come from the meeting to be held in Vienna on January 21 to 22. Look for the market to chop around next week, but start preparing for bearish news if the meeting reveals less than 100% compliance and evidence of cheating.

My analysis of the recent VIX action is clearly warning of a potentially massive price volatility increase in the US and global markets. Many traders use and trade the VIX as a measurement of volatility. The VIX is a measurement of the expected market volatility over the next 30 days. As the VIX rises, traders expect larger and more volatile price swings. As the VIX declines, traders expect smaller and more narrow price swings.
Currently, the VIX is near historical low levels and has recently past a critical cycle midpoint.

One can see from my cycle analysis, I am tracking to cycle events; a longer term top-to-top cycle event and a smaller bottom-to-top cycle event. I call these dual-phase and single-phase cycle events, respectively.
This analysis tells me we recently past a single-phase bottom cycle (near Nov 30th) and are expecting a dual-phase top cycle event near Feb 17th. Given the expected opportunity to retest the VIX high channel, the potential price move in the SSO would relate to a 11%~16.5% price swing (approx) – or larger. The dark blue downward VIX channel is a boundary that we would expect the VIX move to attempt to reach. It could blow past this level and develop a much larger price correction in the US and Global markets but lets just focus on one target at a time for now.
Now, let’s take a look as how this relates on the SSO chart.
On the below SSO chart, I have highlighted the critical VIX “Peak” levels with rectangles and I have drawn the VIX Single and Dual phase event cycles. You can clearly see how these event cycles align with critical price swings and, most recently (after the US election cycle) correlated with a cycle event low and high.

On the hard-right edge of the chart, I have drawn what I believe will be the likely VIX cycle event target range and target date range. I expect the VIX to increase moderately over in the next week or so and explode as stock prices rotate lower. I expect the US and global markets to react to these time cycles and for an increase in volatility. The chart shows a sharp correction as that is the max potential, but we could only see a 2-5 day dip before it heads higher. Either way volatility should jump soon and I plan to get involved with an ETF.
Our last few ETF trades generated some big profits with EDZ 20.7%, NUGT 11%, and UGAZ 74% return. I feel the VIX is starting to show signs of an opportunity unfolding.
Join www.ActiveTradingPartners.com
John Winston
Chief Investment Stratgist

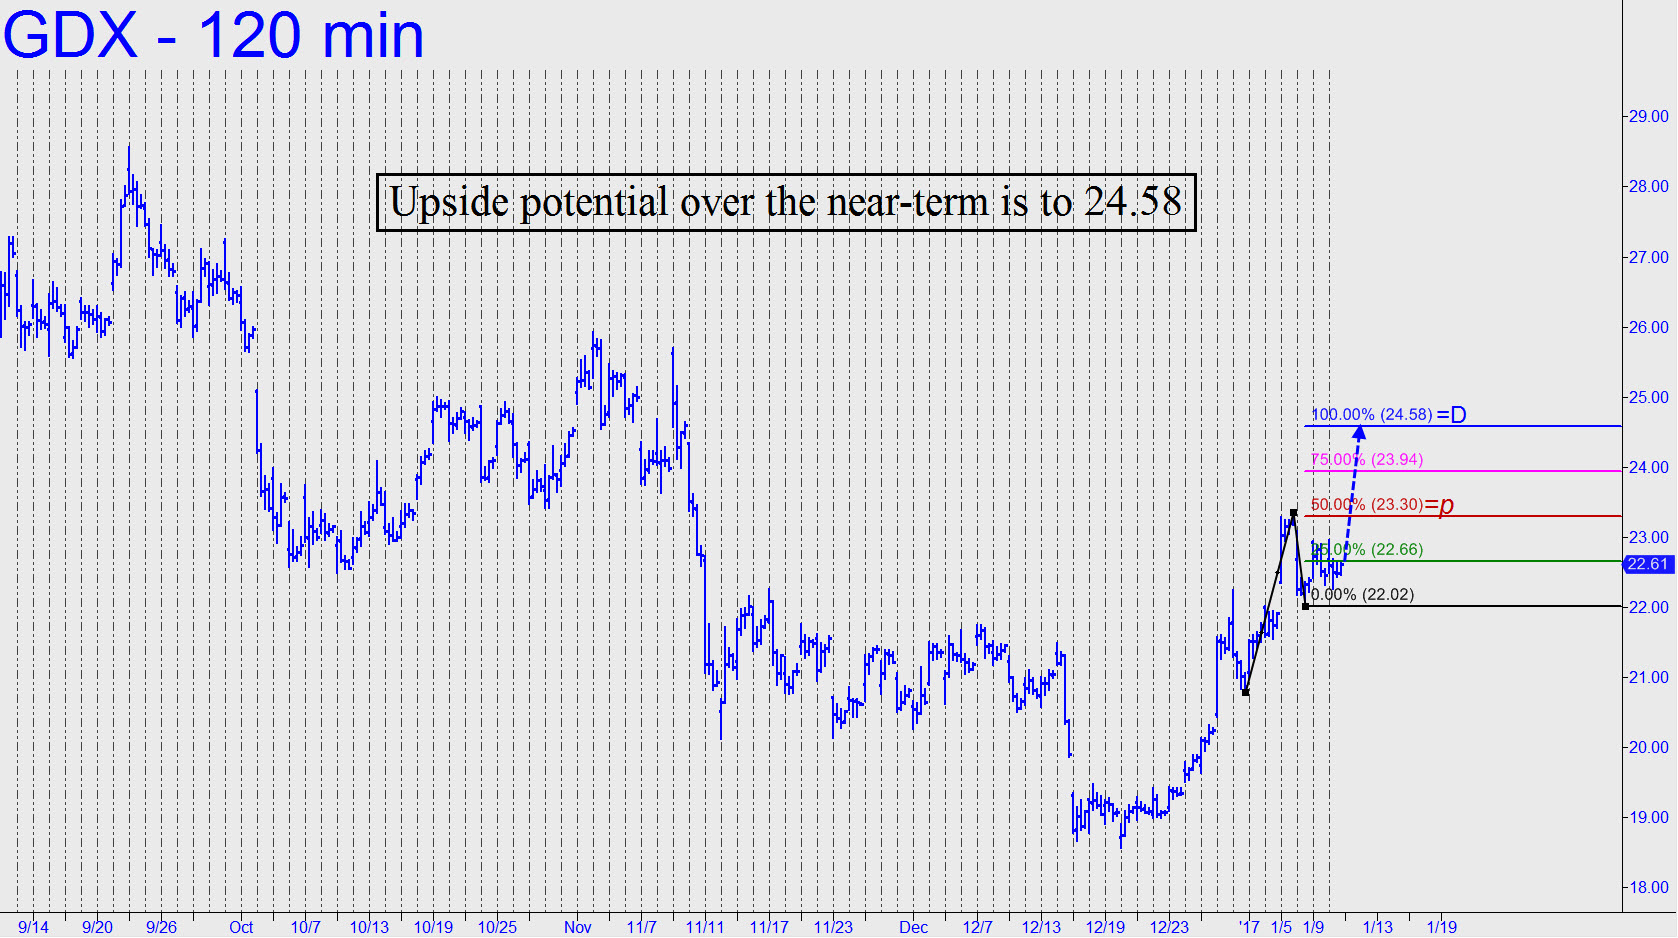
Subscribers are long 400 shares from 22.61, stop 22.01, based on a real-time guidance for a ‘mechanical’ entry that was posted to chat room Scoreboard at 11:21 a.m. GDX, an ETF proxy for the gold mining sector, is having trouble getting airborne, but if the buying should catch fire, it has the potential to reach 24.58 (see inset) over the near term. For now, I’d suggest entering an order to sell half the position at p=23.30, the pattern’s ‘midpoint Hidden Pivot’ resistance. The order should be held o-c-o with a 22.01 stop-loss on the whole position. You should also offer another 100 shares at 24.58 g-t-c. If the order fills, we’d be left with 25% of the original position — or 100 shares, based on the original order.
Click here for a no-risk, two-week trial subscription.
….related: More short term trading ideas from Victor Adair: Live From The Trading Desk: Long & Short Term Positions Now

![]()
In This Week’s Issue:
– Stockscores’ Market Minutes Video – Trade the Evidence
– Stockscores Trader Training – Strength in Weakness
– Stock Features of the Week – Stockscores Simple Weekly Canada
Stockscores Market Minutes – Trade the Evidence
Traders can easily take trades for emotional reasons, we have to force ourselves to slow down and look for evidence that the trade is the right one to make. That plus my regular weekly market analysis and the trade of the week on GBX. Click Here to Watch
To get instant updates when I upload a new video, subscribe to the Stockscores YouTube Channel
Trader Training – Strength in Weakness
Simple approaches to any practice usually work the best. Finding the simple solution is not always easy, doing so can take the most experience. This is true in trading too and one simple concept to keep in mind when trading stocks is that there is strength in weakness (and weakness in strength).
What do you do when you are optimistic about a stock? Assuming you invest in stocks at all, you probably buy. When you are pessimistic, there is a good chance you sell.
Suppose there are 100 people who are allowed to trade the stock market and approach the market in this rational way. If 30 of them are optimistic about the market and 70 are pessimistic then there are 30 potential buyers and 70 likely sellers. The sellers are stronger and will likely push the market lower.
What happens when a pessimist sells or an optimist buys? The seller no longer has shares to sell and becomes a more a person who is more likely to buy in the future. The buyer now has shares and is a more likely seller in the future.
If most people in the market are optimistic, they are also likely owners of the market and less likely to buy in the future. The more optimistic the market, the more likely people will sell in the future.
If most people in the market are pessimistic, they have likely already sold and are therefore likely to be future buyers as prices fall.
Market strength is driven by optimism that is likely to turn to pessimism once prices get high enough. Market weakness is driven by pessimism that will eventually turn to optimism once prices get low enough.
That is why weakness brings strength, and strength brings weakness.
Keep this in mind when analyzing a stock. It is why I don’t like to chase stocks that have been going up for a while. I prefer to buy just when stocks start to go up. I also like to sell just when upward trends are broken rather than sell after a stock has been going down for a while.
You can apply this thinking with a very simple chart analysis method. Use trendlines to define who is in control of the market and then look for a change of control. A downward trend means the sellers are in control so watch for a break of the downward trend to indicate the buyers are going to come in off of the sidelines and turn the market around. There is strength in weakness as long as you get the timing right.

I ran the Stockscores Simple Weekly Market Scan for Canada this week, using the 3 year weekly chart to indicate if a new trend may be developing. Here are two stocks that have a good potential to do well in the months ahead:
![]()
1. T.LAM
T.LAM had a pick up in volume with price strength last week as it moved up through $0.35 resistance. Good turnaround candidate with support at $0.25.

2. T.SJR.B
T.SJR.B recently made a move up through resistance from a rising bottom after breaking its downward trend line last year. It has a 4.34% historical yield and good potential for capital appreciation as long as support at $26.50 is not broken.
References
- Get the Stockscore on any of over 20,000 North American stocks.
- Background on the theories used by Stockscores.
- Strategies that can help you find new opportunities.
- Scan the market using extensive filter criteria.
- Build a portfolio of stocks and view a slide show of their charts.
- See which sectors are leading the market, and their components.
Disclaimer
This is not an investment advisory, and should not be used to make investment decisions. Information in Stockscores Perspectives is often opinionated and should be considered for information purposes only. No stock exchange anywhere has approved or disapproved of the information contained herein. There is no express or implied solicitation to buy or sell securities. The writers and editors of Perspectives may have positions in the stocks discussed above and may trade in the stocks mentioned. Don’t consider buying or selling any stock without conducting your own due diligence.
Victor Adair covers the recent action in Gold, Interest Rates, Crude Oil, CDN Dollar, US Dollar and the very powerful Stock Markets. Also Victor on what he is doing long term to protect all assets.
….related: Agri-Equities and Agri-Food Prices: Both Strong


-
I know Mike is a very solid investor and respect his opinions very much. So if he says pay attention to this or that - I will.
~ Dale G.
-
I've started managing my own investments so view Michael's site as a one-stop shop from which to get information and perspectives.
~ Dave E.
-
Michael offers easy reading, honest, common sense information that anyone can use in a practical manner.
~ der_al.
-
A sane voice in a scrambled investment world.
~ Ed R.
Inside Edge Pro Contributors

Greg Weldon

Josef Schachter

Tyler Bollhorn

Ryan Irvine

Paul Beattie

Martin Straith

Patrick Ceresna

Mark Leibovit

James Thorne

Victor Adair