
Timing & trends
Every investor has at least one horror story to tell.
Usually they involve an event that came out of nowhere – a “black swan” – that completely crashed or changed the market in an unpredictable way.
Today’s infographic covers nine of the most recent black swans and their deep impacts on markets.
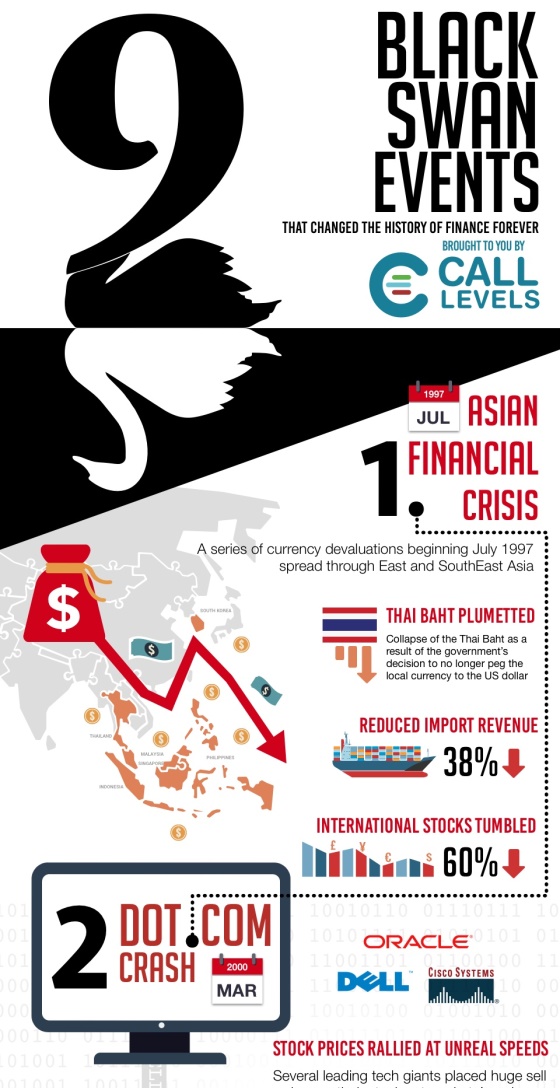
Click image to view all 9 Black Swans That Changed Finance

Tuesday October 4, 2016 3:00pm Pacific
DOW – 85 on 1300 net declines
NASDAQ COMP – 11 on 600 net declines
SHORT TERM TREND Bullish
INTERMEDIATE TERM TREND Bullish
STOCKS: British P.M. Theresa May stated that there would be a hard date set for exiting the EU. That collapsed the pound and caused a dollar surge.
This in turn caused bonds and gold to drop sharply and the stock market followed suit.
There was also a rumor that the ECB would taper its efforts to provide stimulus and a Cleveland Fed President Loretta Mester called for higher rates.
I’m guessing that a Fed official may appear on Wednesday and call for rates to stay the same. When they cause a market decline, there is a tendency for an opposite view the next day.
GOLD: Gold was hit because of a rise in rates and a dollar surge.
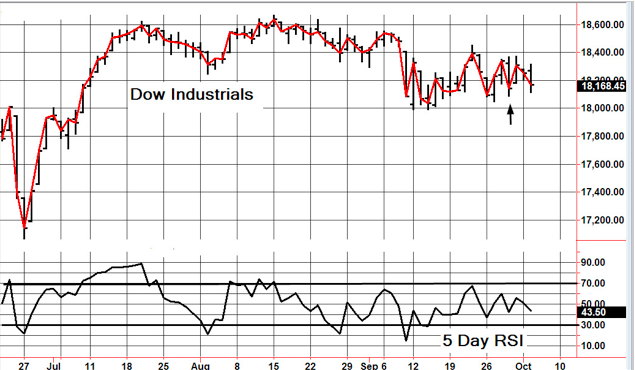
CHART: The Dow held a previous low (arrow). I think that there is a good chance that it will rebound on Wednesday.
BOTTOM LINE: (Trading)
Our intermediate term system is on a buy.
System 7 Let’s do a scalp. Buy the SSO at the opening and remain with it for the session.
System 8 We are in cash. Stay there.
News and fundamentals: There were no important economic releases on Tuesday. On Wednesday we get the ADP employment report, the oil inventory report and the trade deficit.
Interesting Stuff: When you are courting a nice girl an hour seems like a second. When you sit on a red-hot cinder a second seems like an hour. That’s relativity.———- Albert Einstein
TORONTO EXCHANGE: Toronto lost 37.
BONDS: Bonds were sharply lower.
THE REST: The dollar was much higher. Silver was lower and crude oil moved higher again.
Bonds –Change to bearish as of today Oct. 4.
U.S. dollar -Bullish as of August 30.
Euro — Bearish as of August 30.
Gold —-Change to bearish as of today Oct. 4.
Silver—- Change to bearish as of today Oct. 4.
Crude oil —- Bullish as of August 3.
Toronto Stock Exchange—- Bullish from January 22.
We are on a long term buy signal for the markets of the U.S., Canada, Britain, Germany and France.
…also: Monthly Charts Argue for Lower Prices in Precious Metals Complex
|
|
Tue. |
Wed. |
Thu. |
Fri. |
Mon. |
Tue. |
Evaluation |
|
Monetary conditions |
0 |
0 |
0 |
0 |
0 |
0 |
0 |
|
5 day RSI S&P 500 |
54 |
62 |
45 |
57 |
51 |
43 |
0 |
|
5 day RSI NASDAQ |
60 |
63 |
46 |
58 |
54 |
50 |
0 |
|
McCl- lAN OSC. |
-11 |
+50 |
-52 |
+10 |
-22 |
-91 |
0
|
|
Composite Gauge |
8 |
5 |
14 |
7 |
11 |
12 |
0 |
|
Comp. Gauge, 5 day m.a. |
9.8 |
9.8 |
11.4 |
10.0 |
9.0 |
9.8 |
0 |
|
CBOE Put Call Ratio |
.98 |
.92 |
1.03 |
1.01 |
1.04 |
.90 |
0 |
|
VIX |
13.10 |
12.39 |
14.02 |
13.29 |
13.5 |
13.63 |
|
|
VIX % change |
-10 |
-5 |
+13 |
-5 |
+2 |
0 |
0 |
|
VIX % change 5 day m.a. |
-3.2 |
-1.0 |
+3.6 |
+2.2 |
-1.0 |
+1.0 |
0 |
|
Adv – Dec 3 day m.a. |
-613 |
+159 |
+30 |
+264 |
-332 |
-185 |
0 |
|
Supply Demand 5 day m.a. |
.54 |
.55 |
.45 |
.56 |
.68 |
.55 |
0 |
|
Trading Index (TRIN) |
1.12 |
.63 |
.74 |
.80 |
1.07 |
.92 |
0
|
|
S&P 500
|
2160 |
2171 |
2151 |
2168 |
2161 |
2150 |
Plurality 0 |
INDICATOR PARAMETERS
Monetary conditions (+2 means the Fed is actively dropping rates; +1 means a bias toward easing. 0 means neutral, -1 means a bias toward tightening, -2 means actively raising rates). RSI (30 or below is oversold, 80 or above is overbought). McClellan Oscillator ( minus 100 is oversold. Plus 100 is overbought). Composite Gauge (5 or below is negative, 13 or above is positive). Composite Gauge five day m.a. (8.0 or below is overbought. 13.0 or above is oversold). CBOE Put Call Ratio ( .80 or below is a negative. 1.00 or above is a positive). Volatility Index, VIX (low teens bearish, high twenties bullish), VIX % single day change. + 5 or greater bullish. -5 or less, bearish. VIX % change 5 day m.a. +3.0 or above bullish, -3.0 or below, bearish. Advances minus declines three day m.a.( +500 is bearish. – 500 is bullish). Supply Demand 5 day m.a. (.45 or below is a positive. .80 or above is a negative). Trading Index (TRIN) 1.40 or above bullish. No level for bearish.
No guarantees are made. Traders can and do lose money. The publisher may take positions in recommended securities.St
Quick take: At the end of September the inflation-adjusted S&P 500 index price was 88% above its long-term trend
The chart of the S&P Composite stretching back to 1871 based on the real (inflation-adjusted) monthly average of daily closes.

…for larger charts and full analysis click HERE
..also:
What a Trump Win Means for The Stock Markets? Disaster or Buying Opportunity
The trading month doesn’t always end on a Friday but when it does we like to take a look at the monthly charts. Generally, I prefer daily and weekly charts because they have more data points. However, monthly charts carry more significance than weekly charts which carry more significance than daily charts. You get the point. One reason and a good reason we expect the current correction to continue is the sector monthly charts.
The chart below plots the monthly candle charts of GDX and GDXJ. Earlier this year the miners exploded above their 20-month moving averages and into a new bull market. They were trading at three year highs before a bearish reversal in August that reversed the entire gains from July. September saw a recovery but failure to hold most of those gains. This tells us that selling pressure remains present and miners will likely see lower prices in October.
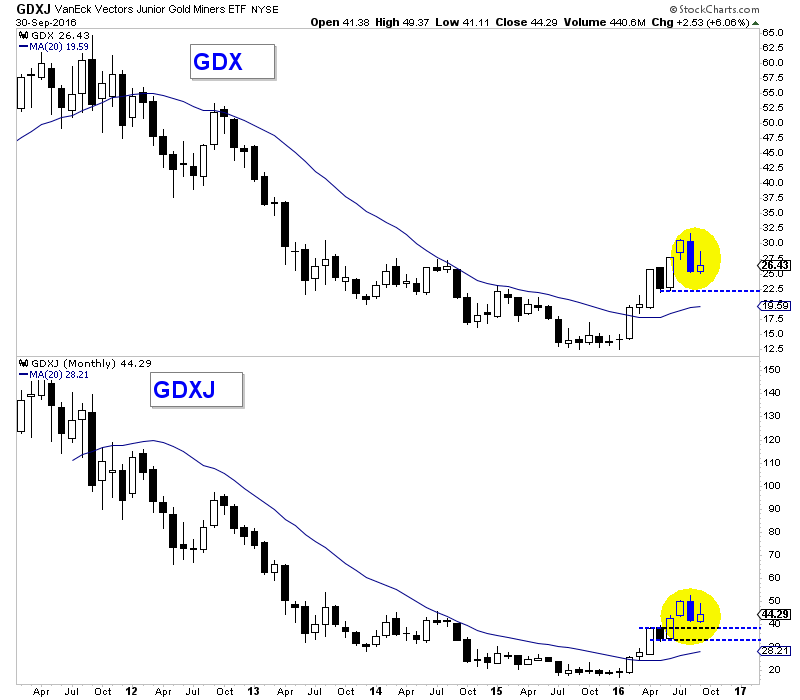
GDX, GDXJ Monthly
The metals show a similar picture. Markets moved well above their 20-month moving averages but the August candle engulfed July’s candle while September recovered only to a small degree. That implies lower prices in October. Gold has support around $1290 while Silver has support near $18. Like the miners, the metals remain a healthy distance above their rising long-term moving averages.
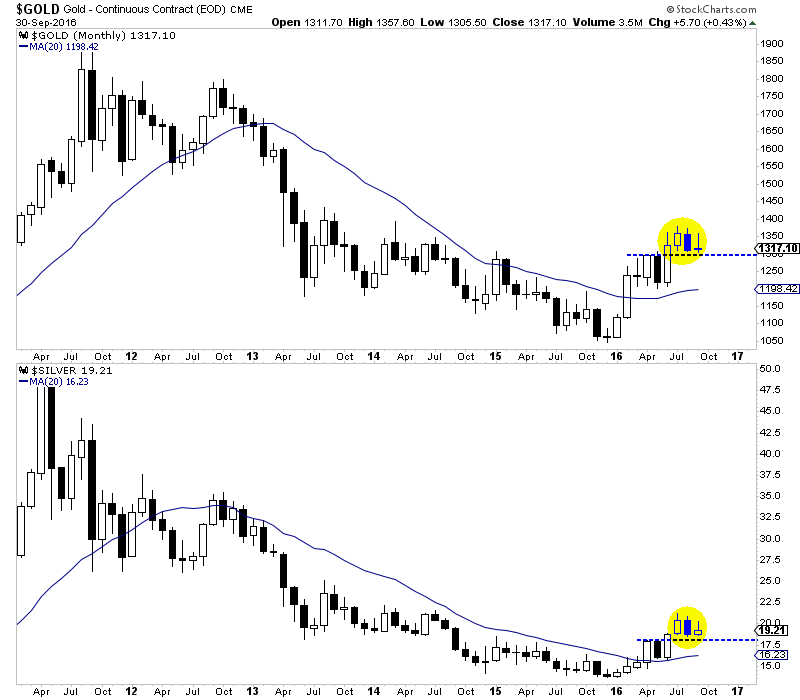
Gold, Silver Monthly
The monthly charts and in particular the action of the past two months leads us to believe lower prices in October are more likely than not. The monthly charts obviously take more time to develop (we have to wait an entire month) but they are the most significant. Time will tell but we see the potential for an important low in October. Traders and investors are advised to wait for lower prices and an oversold condition. We will focus on opportunities scattered amongst individual companies. Jordan Roy-Byrne, CMT, MFTA
…related: Greg Weldon’s recent take on Gold, a metal he was bullish on at the lows:

 1. 10 Top Retirement Mistakes
These days, planning for retirement isn’t just a luxury. It’s a necessity. Retirement has become too complex to just pick a day and stop showing up to work. And it’s more than complex—retirement is also expensive. You have to factor in expenses, taxes, and other spending. There are many ways to pay for it, but which ways are the best ways? How much do you need to save, and how should you invest?
2. Why Are the Markets Coiling?
by Martin Armstrong
The markets have been coiling, and quite frankly, this reminds me of when Pope John Paul II was shot, which was the first attempted assassination of a pope,
3. The Islamic Hatred of Modernity
via John Mauldin
It is no understatement to say that ISIS and radical Islamic terrorism in general are a threat to the Western world, and it’s a threat against which we have so far not really developed any serious defense mechanisms. Rather, we are mostly just reacting to seemingly random events.

-
I know Mike is a very solid investor and respect his opinions very much. So if he says pay attention to this or that - I will.
~ Dale G.
-
I've started managing my own investments so view Michael's site as a one-stop shop from which to get information and perspectives.
~ Dave E.
-
Michael offers easy reading, honest, common sense information that anyone can use in a practical manner.
~ der_al.
-
A sane voice in a scrambled investment world.
~ Ed R.
Inside Edge Pro Contributors

Greg Weldon

Josef Schachter

Tyler Bollhorn

Ryan Irvine

Paul Beattie

Martin Straith

Patrick Ceresna

Mark Leibovit

James Thorne

Victor Adair