
Timing & trends
The B.C. government is laying a brand new additional 15% tax on foreign buyers but they aren’t the only ones getting screwed. Ozzie Jurock talks about the biggest flaw in the new tax.
Don’t miss Michael’s Editorial: They Just Don’t Get It


The following is part of Pivotal Events that was published for our subscribers July 21, 2016.

Perspective
It is one thing to see trouble developing in the credit markets and it is something else to conclude that the consequence of the trend is calamity. That’s the term the establishment used described the 2008 “unpredicted” contraction.
Even with today’s unprecedented distortions of the credit markets, markets are doing generally what they should be doing. When outgo exceeds income there is default and defaults are becoming noticeable.
Another consistency is that the financial boom can run for some 12 to 16 months against a flattening yield curve. The reversal to steepening indicates that speculative demand for short-term funds is diminishing, which says that the boom is failing.
For us, this has worked well. In January 2000, we counted it out to around that fateful March. In 2007, it counted out to around that fateful May. In both cases, the contraction turned severe later in the respective years. It is worth noting that the count was into a window of around 3 months.
Flattening ran for a year into early 2015 and the reversal preceded the stock market high in May.
This flattening has run for a year and is now trying to reverse, which is a warning on the latest stock rally. Flattening need not run to inversion.
Stock Markets
Reliable calculations place the P/E for the S&P at 25, which is very high. And as noted last week, the plot is at the upper right-hand corner of the chart. This reminds of “back in the day” when we plotted by hand on K&E graph paper. When starting a new graph one had to estimate just how far the trend would run. Then you had to choose the scale, hoping it would accommodate the trend.
Inevitably, the observation would be, “Hey, this rally can’t go any further.”
Why?
“It’s at the top of my page.”
Well, the plot is at the top of the page now and last week’s conclusion was that the fun could run into August.[1]
But, we will stay with the non-confirmation by the Transports on the old Dow Theory. Also, Banks and Broker/Dealers are well-below last year’s highs. Last week we noted that Banks could firm up with the initial phase of curve steepening. They have.
On the overall thrust, the widely-publicized “Fear & Greed” indicator has soared into the low 90s on the Greed reading.
Things to watch continue to include spreads, the curve, the dollar and crude oil.
Things to not watch continue to be Fed announcements and speculation about such announcements. Perhaps the move to have Russian athletes “Banned for Doping” should be applied the Janet Yellen?
Commodities
Our general theme for commodities through August is a trading range.
Crude’s rally from very oversold at 26 to 51.76 was outstanding. The decline has been to 44.56, which seemed to be enough for the correction. The upside which could run through August could be limited by resistance at the 50 level.
Taking out the 200-Day at 41 would trash the trading range.
It was poorly performing gasoline prices that supported our negative view on crude in mid-2014 and in mid-2015.
Gasoline reached 1.67 in May and declined to 1.35 a couple of weeks ago. That was right at the 200-Day and the rebound made it to 1.45. Yesterday’s low was 135 and the moving average is at 136.
Today’s weakness in crude is concerning. A sharp decline would impair wide spread euphoria.
We haven’t reviewed the thermal coal price since earlier in the year. It firmed slightly to 43.8 at the end of May and it is now at 39.5, a new low for the bear. The cyclical high was close to 80 in 2011.
So far, the correction has been to 249 and today’s rally seems to be based upon the decline in the general stock market.
Our November study reviewed the conditions needed to end the bear and set up a cyclical bull market. All, hopefully, in place by around January.
One of these was that gold stocks would begin to outperform the bullion price.
US Industrial Production

- Tenth straight month of decline.
- Recession?
Linn Energy bond 8.625%, due in 2020

- The full price drop appears to be from 99 to 1.80 (no typo).
- Is it over?
- Can it be contained?
- The report with the chart included: “The default rate could continue to climb, but the impact on the markets will be negligible.”
US Car Sales

- Boomed into mid-2015.
- Close to breaking down.
Global Corporate Defaults

- The number for 2015 exceeded that for 2008.
- Will it be resolved quietly or in a panic?
Speculative Grade Default Rate

- Note the lag from the turn up in the default rate to the onset of the recession.
- Except in 2008, when typical of the end of a great bubble, the economy collapses with the stock market.
- In the “normal” cycle for business and stock certificates, stocks lead the economy by around 12 months.
- “Normal” is not on.
[1] The classic example was with Ross in the 1970s. The scale on the first chart on gold was set at 0 to 200. A number of pages had to be added as the price zoomed to 850 in 1980. Some years later, when the Scotch tape had become yellow and the paper frail, it was taken down.
Link to July 22 Bob Hoye interview on TalkDigitalNetwork.com: https://www.youtube.com/watch?v=V0irmQTvF-Y&feature=youtu.be
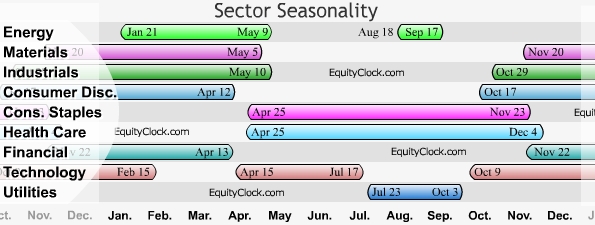
also, Michael Campbell’s interview with Don Vialoux July 30th/2016:
In their monster hit, “Turn,Turn,Turn” The Birds famously sang – “to everything, there is a season.” That’s certainly true with gold, stocks, currencies and every other investment, which is why Mike loves to talk with the foremost expert on seasonality – Don Vialoux. Find out which groups to drop and which ones are about to get hot.
…also Mike’s Editorial: They Just Don’t Get it
You gotta be wondering – how did this happen? 324 million people and the choice for President is between a blowhard who has never been held hostage by the truth and the pathological liar who’s used government as her own personal ATM machine. The answer reveals it’s part of a bigger story you can’t afford to miss.
Also Mike’s Quote of the Week: The Road To Significant Losses


 1. Martin Armstrong: Throw Out the Fundamentals—Negative Rates Could Push the Dow Up to 40,000
Armstrong covers a lot of ground, projecting a Trump win over Hillary, an eventual collapse of the euro, global monetary reform between 2018-2020, and, perhaps the most controversial, a “phase transition” in the stock market (like going from liquid to gas) as global capital escapes low or negatively yielding government bonds for corporate debt and equity.
2. A Truly Great Interview With Uber Money Manager, James Thorne
by Michael Campbell
Brexit, Federal Reserve, Turkish Coup…what does it mean for your investments? What’s coming next? Not an easy answer but Caldwell Investment’s chief strategist, James Thorne says there’s one the key variable that you must keep a close eye on.
…..continue reading or listening HERE
3. A Potential Life Changing Market
The markets have a way to push you just beyond your limits to get you to do the wrong thing at the wrong time and then reverse on a dime. The bearish sentiment from just a casual observation over the last few weeks has felt like there was no way the bulls could rally the PM sector higher before there was a decent correction. In a new bull market the surprises come to the upside and not the downside.

-
I know Mike is a very solid investor and respect his opinions very much. So if he says pay attention to this or that - I will.
~ Dale G.
-
I've started managing my own investments so view Michael's site as a one-stop shop from which to get information and perspectives.
~ Dave E.
-
Michael offers easy reading, honest, common sense information that anyone can use in a practical manner.
~ der_al.
-
A sane voice in a scrambled investment world.
~ Ed R.
Inside Edge Pro Contributors

Greg Weldon

Josef Schachter

Tyler Bollhorn

Ryan Irvine

Paul Beattie

Martin Straith

Patrick Ceresna

Mark Leibovit

James Thorne

Victor Adair