
Timing & trends
Everyone is Bullish, perfect time to short with stops in place of course. Below is a simple chart of one way to look at market internals. Lets see what is going on under the hood.
The chart shows OEX or SPY with NYSE 3 month new highs using a line chart. The purple line going up is OEX or SPY. Basically what this is saying is the market is going higher on less participation not more.
The ovals are current recent market highs, 3 including today, showing clear divergence.
Notice the trend of NYSE 3 month new highs near the left side, leading up to 4/20/16, it showed bullish momentum. That seems to be breaking down thus far as prices have been in rally mode since “Brexit”.
This does not give me a reason to buy this current rally high, I already closed my long position and made my profits.
Sentiment is off the scale as we are getting divergences on oscillators and market internals. This is the bread and butter right here, no fluff.

related:
A more in depth analysis of a topping US Stock Market by Lance Roberts – “Breakout” – Let’s Try This Again

Here we go again. Another Friday. Another attempted breakout above the 2100 level on the S&P 500. Over the last couple of months this has become a regular occurrence.
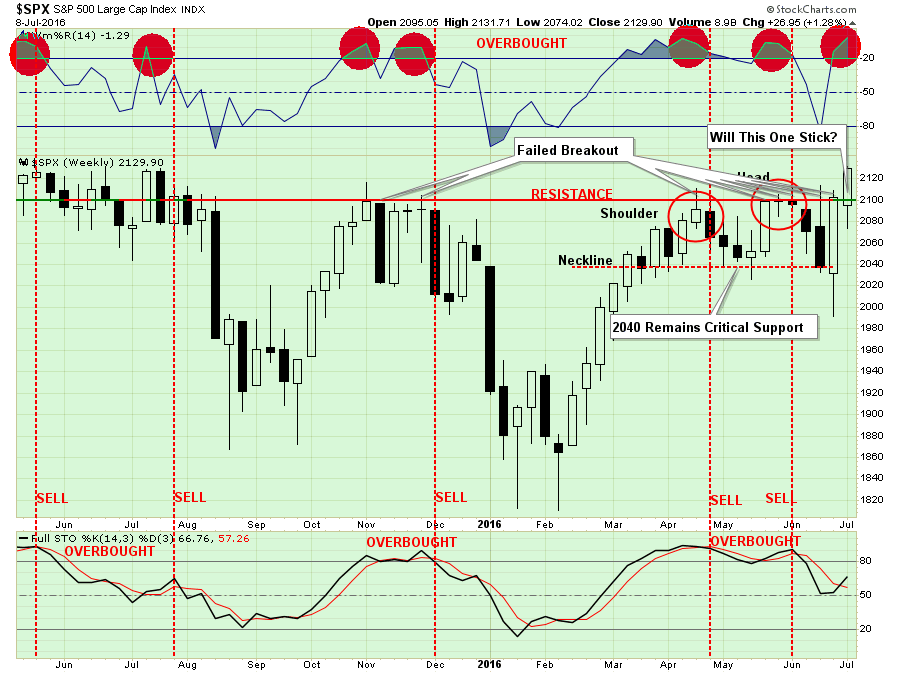
While the market is once again extremely overbought on a weekly basis, the employment report on Friday which showed a historically abnormal surge in June jobs growth, despite a weaker than expected wage increase and further negative revisions to May’s report, sent investors scrambling into the market. That push on Friday was enough to trigger a short-term buy signal and set the market up for a push to all-time highs.
However, don’t get too excited just yet. There are several things that need to happen before you going jumping head first into the pool.
also:
be sure to read Mike’s Interview Solid Quality Yield Recommendations
While I’m expecting some kind of pullback at the $1390-$1400 level, I don’t think gold’s intermediate cycle will top until at least retracing the 50% Fibonacci level and probably back to $1550 by September. This will almost certainly be driven by an aggressive moved down in the US Dollar as it really starts to accelerate into the next 3 year cycle low due sometime net summer or fall.
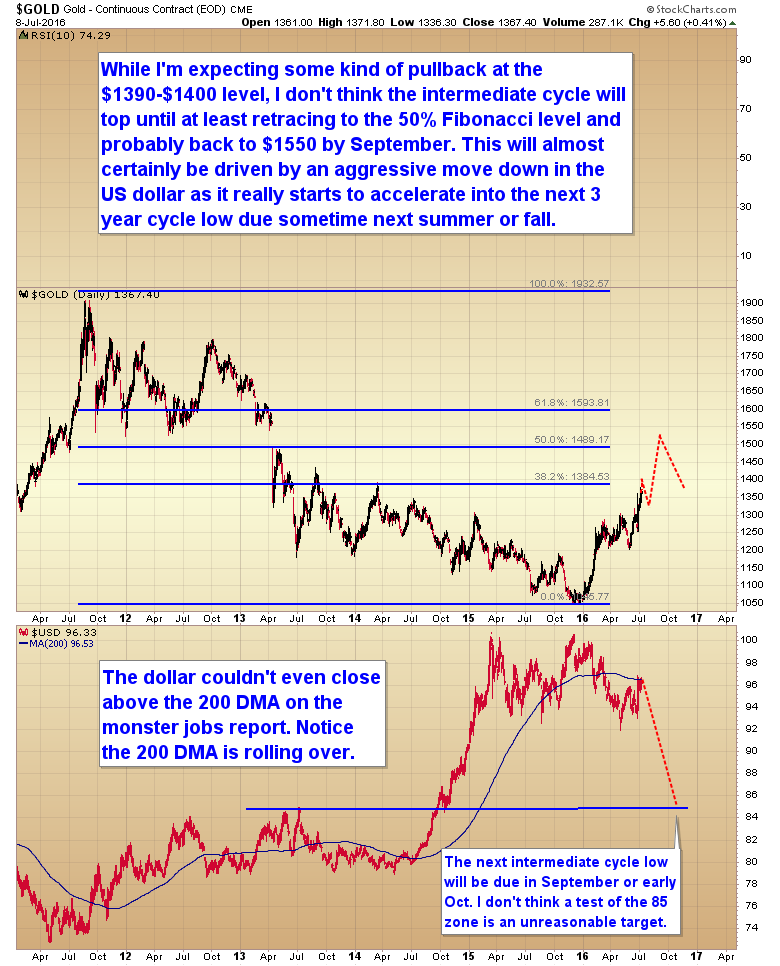
The dollar couldn’t even close above the 200 DMA on the monster jobs report. Notice the 200 DMA is rolling over.
The net intermediate cycle low will be due in September or early October. I don’t think a test of the 85 zone is an unreasonable target.
http://blog.smartmoneytrackerpremium.com/
related:
The refusal to acknowledge the abject failure of the European welfare state economic model by public sector unions, politically connected businesses and the mainstream commentariat is foreboding. In their continuing drive to implement the same failed policies in Canada, they are essentially declaring acceptable entrepreneurship regulated out of existence, vast swathes of the populace unemployed and drawing cheques as well as rapidly spreading banking failures as in Italy, arguably the most dangerous of all…...
Also, don’t miss Solid Quality Yield Recommendations from featured guest Aaron Dunn. Several fine examples of higher yield investments with risks acceptable for conservative investment through to more aggressive portfolios
Below, Winston Churchill Quote:


Michael asks Aaron Dunn of Keystone Financial for several fine examples of higher yield investments with risks acceptable for both conservative investment through to more aggressive portfolios
Don’t miss Mike’s Big Fat Idea where hidden value is discovered in the recovering Oil & Gas Service Sector


-
I know Mike is a very solid investor and respect his opinions very much. So if he says pay attention to this or that - I will.
~ Dale G.
-
I've started managing my own investments so view Michael's site as a one-stop shop from which to get information and perspectives.
~ Dave E.
-
Michael offers easy reading, honest, common sense information that anyone can use in a practical manner.
~ der_al.
-
A sane voice in a scrambled investment world.
~ Ed R.
Inside Edge Pro Contributors

Greg Weldon

Josef Schachter

Tyler Bollhorn

Ryan Irvine

Paul Beattie

Martin Straith

Patrick Ceresna

Mark Leibovit

James Thorne

Victor Adair