
Timing & trends
Media analyst Mark Dice offers random people their choice of a Hershey chocolate bar or a 10 oz silver bar (Worth $150) in an experiment. You have to see what happened next!
Related: Take a look at Michael Campbell’s commentary on “The Madness of 16 Year Olds Voting”


1. Naomi Klein’s Unfettered Capitalism
by Michael Campbell
What! With over 40 billion dollars spent annually to comply with CDN Government regulations. More than a million Provincial regulations from bicycles to Ice Cream stands. Billions in tax compliance costs and state cronyism…..
Listen to this potent 90 second commentary HERE
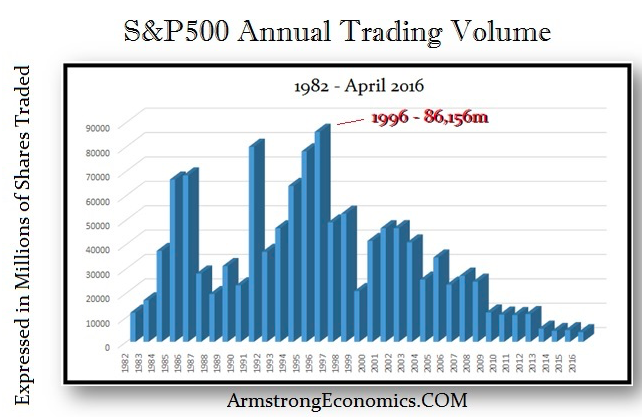 2. Trading Volumes Decline as Hoarding Rises Due to Uncertainty
by Martin Armstrong
This is the most bearish rally in stocks ever. That is why the stock market has kept rising. The shorts always have to buy back….
3. Fresh Gold Buy Signal Now
Gold stock investors should be eager buyers of GDX and its component stocks in the $21.50 area, and aggressive traders should be buyers right now. Nervous investors can “stay in the game” by moving some capital from gold stocks to gold, but the overall gold market is very well supported.

Despite maintaining an overbought condition and despite the recent bearish posture of many sector pundits, the gold stocks have yet to correct more than 11%. Since the end of January the gold stocks have held above their 50-day moving averages, which is often support during a strong trend. If the gold stocks break their lows of the past two weeks then it should usher in a 20% correction and correct the current overbought condition. However, if gold stocks do not break initial support they could begin a melt-up that would lead to a more serious correction in the summer.
The chart below plots the three major rebounds in the HUI from the three most significant lows. The time and price scale begins from where the current rebound started. At this juncture, the two other rebounds corrected at least 20%. The current rebound has tracked the 2008 rebound very closely. That bull endured two 20% corrections over the next few months which proved to be good buying opportunities.

HUI Bull Analogs
If the gold stocks do not break initial support and correct more, they would be at risk of a deeper correction following another push higher. The following chart is GDM, the parent index for GDX. Unlike GDX, GDM has a history that dates back to 1993. GDM closed Thursday at 684. It has a major resistance target at 800-810. A move to 800 is 17% upside while a move to 810 equates to GDX 29.

GDM Daily
Also note the three oscillators at the bottom of the chart which plot GDM’s distance from its 100-day, 200-day and 400-day exponential moving averages. The gold stocks are not as overbought as they were in 2002 but they are more overbought than at any other time in the past 23 years. That is a good sign considering we are early in a new bull market but it does warn of a probable sharp correction.
The support and resistance for GDX and GDXJ continue to be clear. GDXJ has support at $32-$33 with upside targets at $43-$45 and $50. Meanwhile, GDX has support around $22 with upside targets at $27-$28 and $30. A final push higher (before a correction) could take GDX to $29-$30 and GDXJ to $45.

GDXJ & GDX
The past few months has been an amazing ride in the gold stocks but all good things come to an end. Unless the gold stocks break initial support and correct by 20% (from recent peaks) then the risk of a final push higher or melt-up type move increases. That is great for us bulls but the problem is it would likely lead to a 30% correction and a potential multi-month consolidation during the second half of 2016.
Jordan Roy-Byrne, CMT Jordan@TheDailyGold.com
Have a look at Stephen Todd on Gold in Current Markets in a Flash
QUESTION: Everyone in the gold industry says you are wrong. The stock market will crash by 90% and gold will soar. Will you address that scenario just once?
ANSWER: I have answered this frivolous question countless times. This is the most bearish rally in stocks ever. That is why the stock market has kept rising.
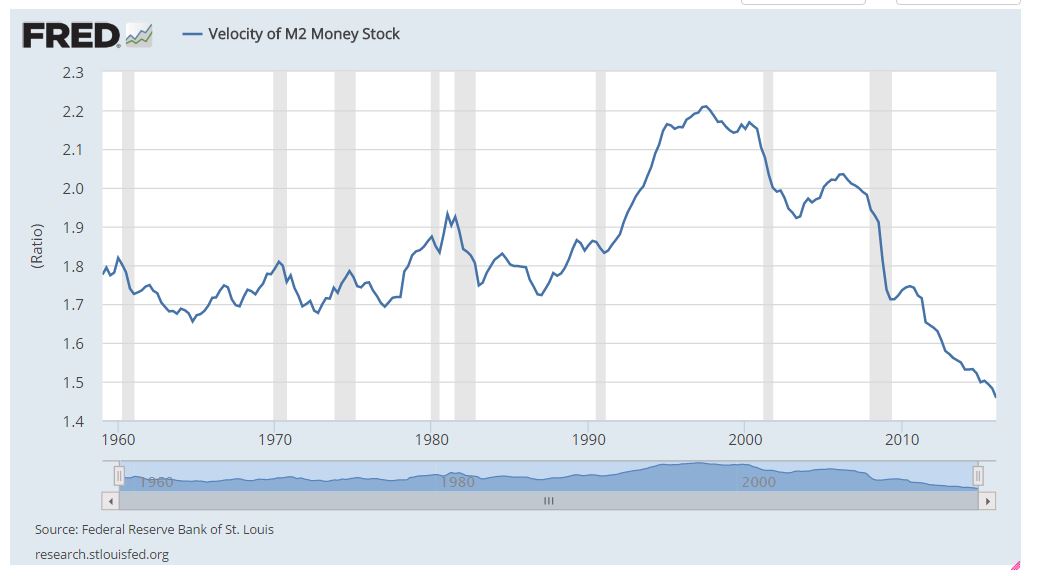 The shorts always have to buy back. Just look at the big hedge funds. Their performance has declined markedly because they have taken that typical view. I displayed how the Velocity of money peaked in 1998 and has been in a bear market ever since. Naturally, people believe what they want to believe and ignore anything that shows them to be wrong. Well now look that the ANNUAL accumulative trading volume in the S&P500. It too peaked in 1996. Volume finally bottomed in 2014 and is at last edging up. We expected the turn upward in 2015 as this was also 86 years from 1929 (8.6 * 10).
Even the speculative bets on the direction of currencies have also dropped to the lowest in years, while average daily trading among dealers in U.S. Treasuries is close to a seven-year low.
I’m sorry. But please explain to me how the stock market will fall to 10 cents on the dollar when there is no massive retail speculation? This is by no means 1929 with people jumping out of windows. You want to believe that so no matter what evidence I show you, you will say I am wrong and just ignore me.
There is something far more sinister at foot. Just keep listening to that nonsense since it makes you feel better. The rest of us will be reviewing the world economy to get a glimpse at just what the heck is really going on here that has confounded all the theories devised by classic thinkers.
more from Martin Armstrong PE Ratio – Mania vs Panic M/T Ed
Todd Market Forecast for Thursday May 12, 2016
DOW + 9 on 250 net declines
NASDAQ COMP – 23 on 1000 net declines
SHORT TERM TREND Bullish
INTERMEDIATE TERM TREND Bearish
STOCKS: Today was disappointing. It opened up sharply, but waffled around. A couple of things may have been at work.
First, jobless claims were up sharply and there is some concern about the retail sales figure to be released on Friday. A lot of retail stocks have been taking it on the chin.
GOLD: Gold was down $11. The dollar rebounded.
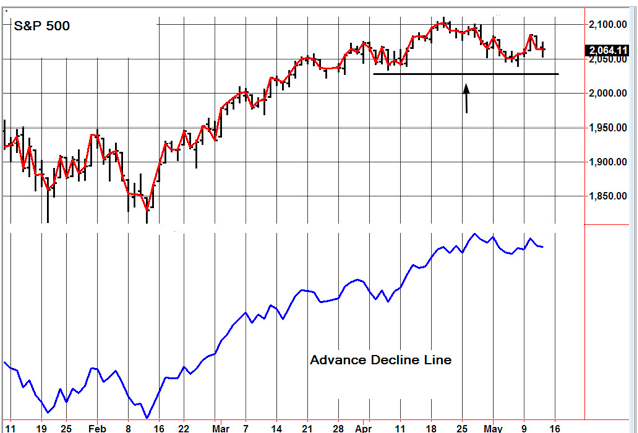
CHART: The market is very choppy and indecisive right now. It can’t seem to break down or up. Seasonality suggests that it will break down below the support line (arrow), but we have some very high put call ratios which argue the other way.
BOTTOM LINE: (Trading)
Our intermediate term system is on a sell. (related, a technical index flashes a Danger Signal – CBOE Volatility Index – Money Talks Ed.)
System 7 We sold the SSO at 64.28 for a loss of 80 cents. Stay in cash.
System 8 We are in cash. Stay there.
News and fundamentals: Jobless claims were 294,000, worse than the expected 267,000. On Friday we get retail sales, PPI final demand and consumer sentiment.
Interesting Stuff: The use of mathematics has brought rigor to economics. Unfortunately, it has also brought mortis — Attributed to Robert Heilbroner
TORONTO EXCHANGE: Toronto was down a fraction.
BONDS: Bonds fell back somewhat.
THE REST: The dollar was up. Silver was lower. Crude oil was mildly higher.
Bonds –Bullish as of April 27.
U.S. dollar – Bearish as of March 7.
Euro — Bullish as of March 7
Gold —-Bearish as of May 9.
Silver—- Bearish as of May 9.
Crude oil —- Bearish as of April 4.
Toronto Stock Exchange—- Bullish from January 22.
S&P TSX Venture Fund — Bullish from January 29.
We are on a long term buy signal for the markets of the U.S., Canada, Britain, Germany and France.
|
|
Thu. |
Fri. |
Mon. |
Tue. |
Wed. |
Thu. |
Evaluation |
|
Monetary conditions |
0 |
0 |
0 |
0 |
0 |
0 |
0 |
|
5 day RSI S&P 500 |
26 |
37 |
40 |
68 |
47 |
46 |
0 |
|
5 day RSI NASDAQ |
18 |
29 |
37 |
61 |
43 |
38 |
0 |
|
McCl- lAN OSC. |
-126 |
-82 |
-95 |
-15 |
-75 |
-87 |
0
|
|
Composite Gauge |
11 |
6 |
11 |
5 |
15 |
11 |
0 |
|
Comp. Gauge, 5 day m.a. |
11.4 |
10.4 |
11.2 |
9.2 |
9.6 |
9.6 |
0 |
|
CBOE Put Call Ratio |
1.20 |
1.19 |
1.14 |
1.09 |
.94 |
1.27 |
+ |
|
VIX |
15.91 |
14.72 |
14.57 |
13.63 |
14.69 |
14.41 |
|
|
VIX % change |
-1 |
-7 |
-1 |
-6 |
+8 |
-2 |
0 |
|
VIX % change 5 day m.a. |
+0.8 |
-1.2 |
+0.2 |
-2.4
|
-1.4 |
-1.6 |
0 |
|
Adv – Dec 3 day m.a. |
-786 |
+5 |
+153 |
+726 |
+132 |
+124 |
0 |
|
Supply Demand 5 day m.a. |
.55 |
.62 |
.54 |
.66 |
.55 |
.59 |
0 |
|
Trading Index (TRIN) |
1.25 |
.94 |
1.32 |
.61 |
.94 |
1.32 |
0
|
|
S&P 500
|
2051 |
2057 |
2059 |
2084 |
2064 |
2064 |
Plurality +1 |
INDICATOR PARAMETERS
Monetary conditions (+2 means the Fed is actively dropping rates; +1 means a bias toward easing. 0 means neutral, -1 means a bias toward tightening, -2 means actively raising rates). RSI (30 or below is oversold, 80 or above is overbought). McClellan Oscillator ( minus 100 is oversold. Plus 100 is overbought). Composite Gauge (5 or below is negative, 13 or above is positive). Composite Gauge five day m.a. (8.0 or below is overbought. 13.0 or above is oversold). CBOE Put Call Ratio ( .80 or below is a negative. 1.00 or above is a positive). Volatility Index, VIX (low teens bearish, high twenties bullish), VIX % single day change. + 5 or greater bullish. -5 or less, bearish. VIX % change 5 day m.a. +3.0 or above bullish, -3.0 or below, bearish. Advances minus declines three day m.a.( +500 is bearish. – 500 is bullish). Supply Demand 5 day m.a. (.45 or below is a positive. .80 or above is a negative). Trading Index (TRIN) 1.40 or above bullish. No level for bearish.
www.toddmarketforecast.com – Available Mon- Friday after 6:00 P.M. Eastern, 3:00 Pacific.
No guarantees are made. Traders can and do lose money. The publisher may take positions in recommended securities.

-
I know Mike is a very solid investor and respect his opinions very much. So if he says pay attention to this or that - I will.
~ Dale G.
-
I've started managing my own investments so view Michael's site as a one-stop shop from which to get information and perspectives.
~ Dave E.
-
Michael offers easy reading, honest, common sense information that anyone can use in a practical manner.
~ der_al.
-
A sane voice in a scrambled investment world.
~ Ed R.
Inside Edge Pro Contributors

Greg Weldon

Josef Schachter

Tyler Bollhorn

Ryan Irvine

Paul Beattie

Martin Straith

Patrick Ceresna

Mark Leibovit

James Thorne

Victor Adair