
Timing & trends
Today’s commentary and charts (double click to enlarge):
US Bonds, Dollar & Dow Video Analysis
Gold & Silver Bullion Video Analysis
Precious Metal ETFs Video Analysis
Trader Time Swing Trades Video Analysis
Key Individual Stocks Video Analysis
Morris
The SuperForce Proprietary SURGE index SIGNALS:
25 Surge Index Buy or 25 Surge Index Sell: Solid Power.
50 Surge Index Buy or 50 Surge Index Sell: Stronger Power.
75 Surge Index Buy or 75 Surge Index Sell: Maximum Power.
100 Surge Index Buy or 100 Surge Index Sell: “Over The Top” Power.
Stay alert for our surge signals, sent by email to subscribers, for both the daily charts on Super Force Signals at www.superforcesignals.com and for the 60 minute charts at www.superforce60.com
About Super Force Signals:
Our Surge Index Signals are created thru our proprietary blend of the highest quality technical analysis and many years of successful business building. We are two business owners with excellent synergy. We understand risk and reward. Our subscribers are generally successfully business owners, people like yourself with speculative funds, looking for serious management of your risk and reward in the market.
Frank Johnson: Executive Editor, Macro Risk Manager.
Morris Hubbartt: Chief Market Analyst, Trading Risk Specialist.
website: www.superforcesignals.com
email: trading@superforcesignals.com
email: trading@superforce60.com
SFS Web Services
1170 Bay Street, Suite #143
Toronto, Ontario, M5S 2B4
Canada

April 6, 2016 …
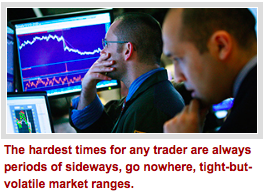
It’s times like these — sideways markets trading in tight-but-volatile ranges — that try the souls of traders and investors everywhere.
Most traders, always overly eager to trade, try to step in and out of these kinds of markets for very short-term profits. The typical end result of all their actions: Making their broker rich.
Then there are others who take on new long positions, thinking that it’s just a pause in existing trends and that by adding to positions now, they’re setting themselves up for a home run. When in reality, many markets are actually getting ready to change trend, violently.
The hardest times for any trader or investor are ALWAYS periods like the recent months of sideways, go nowhere, tight-but-volatile market ranges. And almost always the best, most-profitable course of action is not to push the markets, but to lie in wait, like a lion tracking and stalking its prey.
 And so it is with me. For all my paying customers, I am lying in wait, stalking the best opportunities, ready to jump on them before you can bat an eye, to help make oodles of money for them. Money that can be kept and built on, not money made in a flash in the pan that can just as easily go up in smoke.
With all that in mind, this week’s column is a follow up to last week’s market road map column. Let’s see just how much has changed in the most important markets of all, starting with …
Gold: Last week, I told you that gold had elected a sell signal by closing below $1,227.10. Since then gold has fallen to as low as $1,210 (basis June futures), only to bounce back to the $1,234.70 level as I pen this column (Tuesday, April 5 at 5:00 am EST).
A stinking $24 trading range, with no gusto, in a week’s time. No opportunities there, even for short-term traders. Maybe for day traders, but for overnight or position traders, nothing but noise.
Any changes in trend in gold? None whatsoever. Merely a sloppy, go nowhere mess. Worth sticking your neck out? Hardly.
The trend remains negative, with the next move likely to bring gold down to support at $1,202, then bust through that to the most important support level at the $1,180 to $1,160 level …
Where, if that happens, I expect to release a MAJOR FLASH ALERT.
All of the above general comments equally apply to silver, platinum and palladium.
Crude oil: Last week I told you that crude oil had an important pivot point at the $39.25 level. When below it, the trend, short-term would be bearish. When above, the trend, short-term would be bullish.
Oil has opted to correct more than I had expected, staying below $39.25, and moving down toward the lower end of the trading range that I cited last week at the $36 level.
Overhead resistance still stands at $39.25 naturally, followed by $42. Overall, oil is doing what my neural net models called for, a largely sideways correction that will lead to a new level up in the spring to the $50 level.
Oil appears to be basing now, just below that $36 level, so don’t be surprised if oil soon takes off to the upside. Take advantage of it with any of the leveraged long crude oil ETFs.
Perhaps the most important market of all right now, and for the weeks and months to come …
The U.S. Dollar: Last week I told you how the dollar, as measured by the Dollar Index, was largely caught in a trading range for now, but within the context of a long-term bull market. Short-term support can be found at 93.197 on the Dollar Index, followed by 91.257.
Resistance will be found at 96.955 and then the former highs just above the 101 level.
Nothing has changed there. Over the past week, the dollar has traded in an extremely tight trading range, chopping up traders left and right and spitting them out as wounded animals.
And that is just the opening act of another major move for the dollar that will destroy even more investors and traders who continue, for some odd reason, to listen to all the pundits coming out of the woodwork who are again screaming about the death of the dollar — one well-known analyst, with alleged ties to the CIA, shouting the loudest, an analyst who has NEVER been right about any market let alone the dollar.
If you want to avoid losing money, simply ignore these harum-scarum analysts who don’t have a clue about real economic history and the forces that drive them. Listening to them is the fastest way to the poorhouse.
There is NO way the U.S. dollar is back in a major bear market. It is, conversely, in a major bull market and is merely taking a pause. The next move up in the U.S. dollar is going to knock your socks off with the Dollar Index moving from its current roughly 94 level to well over 105.
Chief reason: Deflation and the demise of …
The euro: Since last week, the euro has managed to eke out a new, short-term-range high at the 1.14385 level but there has been no change in trend to the upside. Just a short-term spike higher, the euro essentially catching its last breath of fresh air before rolling over and dying.
The new high at 1.14385 should prove formidable, while support remains under the market at 1.1030 followed by 1.08995. After that, support plunges to the 1.05 level, then 1.03 and then even lower.
The only thing holding the euro up, or should I say, suspending it in thin air, right now — is the fact that Janet Yellen has softened her tone on rate hikes here in the U.S.
But in the end, that won’t matter one bit. Yellen could lower rates here, and the euro will still meet its maker: It was a flawed currency from the outset, and now, every threat under the sun is combining at the same time to exploit the currency’s falls and take it under.
Markets have no mercy and take no prisoners. The euro is destined for failure due to the ignorance of the leaders who put it together; their ignorance of history, their ignorance of economics, and, perhaps most tragic of all, their ignorance of Europe and its many disparate cultures.
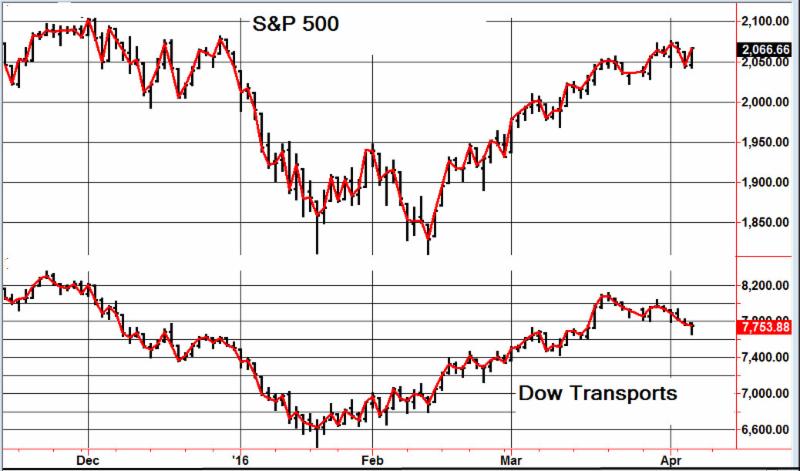
Dow Industrials: Last week, I told you the key resistance figures for the Dow Industrials are still the 17,901 and 18,500 level and …
Unless the Dow can get above both of those figures on a weekly closing basis, the bias toward the downside will remain the more probable path of direction.
The Dow hovered near the 17,900 level last week, but then started turning slightly lower. Major support still lies at the 16,652 and 14,687 levels.
Therefore, in the very short-term, the trading range is from 16,652 to 17,901.
A sloppy, wide trading range.
Nevertheless, every indicator I maintain and every neural net and AI model I run on the major U.S. stock indices points to a rout that will take the Dow Industrials down to the 13,900 area.
So stay alert, and stay tuned, and most of all, be patient. The best profits always come to those who are patient and not to those who are trigger happy.
Best wishes,
Larry
P.S. One year from today, you could be cracking open a bottle of Dom Pérignon and feasting on caviar to celebrate the outrageous gains you’ve made in the bull market of a lifetime … profits that could let you retire early and rich! OR you could be kicking yourself, muttering, “I wish someone had told me this would happen and how to take full advantage of it.” Well, that’s exactly what I am going to tell you in this report! Click here for information!

| Wed. | Thu. | Fri. | Mon. | Tue. | Wed. | Evaluation | |
| Monetary conditions | 0 | 0 | 0 | 0 | 0 | 0 | 0 |
| 5 day RSI S&P 500 | 81 | 72 | 80 | 67 | 41 | 61 | 0 |
| 5 day RSI NASDAQ | 79 | 79 | 85 | 71 | 49 | 69 | 0 |
|
McCl-
lAN OSC.
|
+80 | +70 | + 33 | -51 | -116 | -44 |
0
|
| Composite Gauge | 8 | 10 | 9 | 14 | 17 | 6 | 0 |
| Comp. Gauge, 5 day m.a. | 10.0 | 8.6 | 8.4 | 9.0 | 11.6 | 11.2 | 0 |
| CBOE Put Call Ratio | 1.12 | 1.14 | .95 | .96 | 1.13 | 1.00 |
+
|
| VIX | 13.56 | 13.95 | 13.10 | 14.12 | 15.42 | 14.09 | |
| VIX % change | -2 | +3 | – 6 | +8 | +9 | -9 | – |
| VIX % change 5 day m.a. | -0.8 | -1.2 | -2.2 | -1.2 | +2.4 | +1.0 | 0 |
| Adv – Dec 3 day m.a. | +927 | +883 | +273 | -503 | -968 | -412 | + |
| Supply Demand 5 day m.a. | .60 | .61 | .51 | .48 | .23 | .42 | + |
| Trading Index (TRIN) | .84 | 1.18 | 1.08 | 1.04 | 1.05 | .86 |
0
|
|
S&P 500
|
2064 | 2060 | 2073 | 2066 | 2045 | 2067 | Plurality +2 |
The Good, the Bad, the Ugly and the Silver Bullet Award goes to a researcher on the Economic Effects of Lower Oil Prices – M/T Ed
The calendar continues in something of an alternating mode. Last week had plenty of important data; this week has little. Instead we get multiple speeches from Fed Presidents and Governors and the release of the last FOMC minutes. Little data plus lots of Fed news is a natural draw for the punditry. This week they will be asking:
Is the Fed too optimistic?
Prior Theme Recap
In my last WTWA I predicted a week chock-full of data with a focus on the market reaction. Would good news finally be treated as good? That was a popular topic throughout the week, from Chair Yellen’s speech to Friday’s employment report. Before the opening on Friday, pundits were observing that the solid data was sending stocks lower. By day’s end the market had reversed course, despite weakness in oil prices. The answer to last week’s question is a very tentative “yes.” Doug Short has the full story with an emphasis on April Fool’s Day in his excellent weekly chart. (With the ever-increasing effects from foreign markets, you should also add Doug’s World Markets Weekend Update to your reading list).

Doug’s update also provides multi-year context. See his full post for more excellent charts and analysis.
We would all like to know the direction of the market in advance. Good luck with that! Second best is planning what to look for and how to react. That is the purpose of considering possible themes for the week ahead. You can make your own predictions in the comments.
This Week’s Theme
 1. Time to Sell the Family Home?
Last year, more than one-third of the houses sold in Vancouver went to Chinese buyers.
All over Canada, the story was similar… though not as extreme. Houses are being sold to people who may or may not intend to live in them.
2. A Collapse In Government Is Incoming, Markets Are Going To Start Responding!
Martin Armstrong began his studies into market behavior when first becoming fascinated by the events during the Crash of 1966. He pursued his studies of economics searching for answers behind the cycle of boom and busts that plagued society both in Princeton and in London.
3. Yellen Drops the “C” Word
Yesterday, we’ve discovered yet again that the stock market is a casino where the house always wins. Janet Yellen, the chief of the Federal Reserve, has yet again shown us that “price discovery” is meaningless and the advantages are for the well connected.

-
I know Mike is a very solid investor and respect his opinions very much. So if he says pay attention to this or that - I will.
~ Dale G.
-
I've started managing my own investments so view Michael's site as a one-stop shop from which to get information and perspectives.
~ Dave E.
-
Michael offers easy reading, honest, common sense information that anyone can use in a practical manner.
~ der_al.
-
A sane voice in a scrambled investment world.
~ Ed R.
Inside Edge Pro Contributors

Greg Weldon

Josef Schachter

Tyler Bollhorn

Ryan Irvine

Paul Beattie

Martin Straith

Patrick Ceresna

Mark Leibovit

James Thorne

Victor Adair