
Timing & trends
 A bit of paint drying over the last two trading sessions; but notable is gold trying to find support in here despite our expectation of a deeper correction lower (page 4 new levels added). And oil (USO) traced out a classic doji candletoday (page 5).
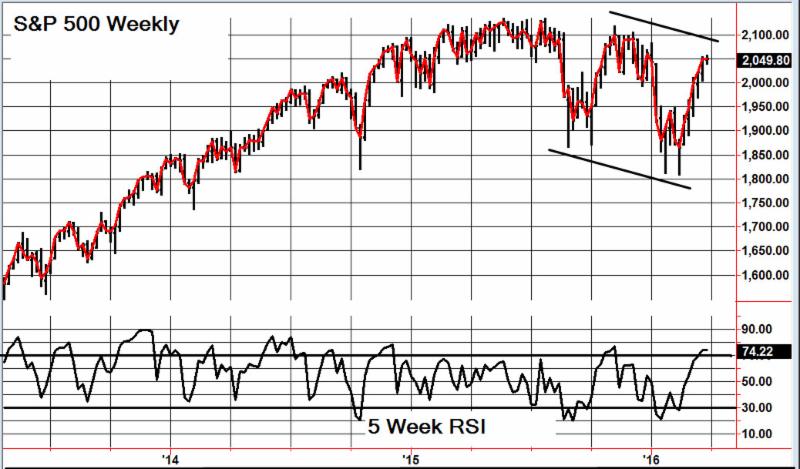
Stocks–SPY Daily [last 203.24]: No change to view. Correction lower likely underway. Stocks rallied to bang on the 78.6% resistance level at 205.23 we have been watching.

 1. Canadian Banking Regulators Sound the Alarm
The shouts of warning are finally starting to come out from official bodies. Since the collapse of the oil and gas market, we have been writing about the fact that we haven’t seen the worst yet.
2. How to Win the Loser’s Game – Part 7
So, how can ordinary investors apply the academic evidence – the lessons learned from more than a hundred years of rigorous research? How can they apply that to achieving their financial goals?.
3. This is Where Marc Faber sees Opportunities
“Over the last 12 to 24 months, many sectors have had huge declines, and I see here, there are some opportunities.”
The Dow Jones Transportation Average (DJT) and Dow Jones Utility Average (DJU) indexes are often seen as leading indicator of the overall stock market. With that in mind, let’s analyse the technicals of each index.
The Dow Jones Transportation Average (DJT) is a stock market index of the American transportation sector. Price last traded at $7957.
Let’s review just the bigger picture using the quarterly and monthly charts.
DJT Quarterly Chart
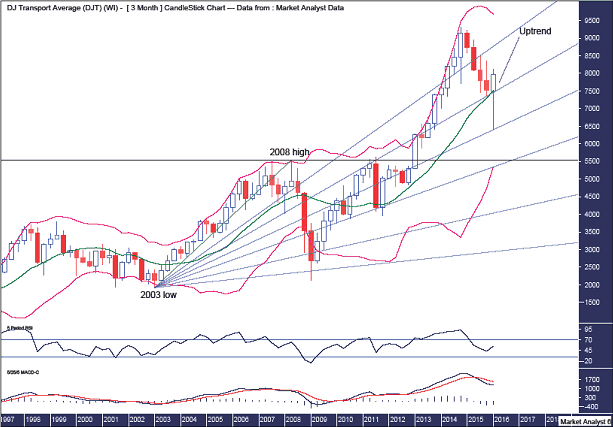
The horizontal line denotes the 2008 high and the recent low came in well above that level indicating strength in the uptrend.
The Bollinger Bands show the middle band providing support. Price dipped a bit below this band but immediately reversed back up bullishly. There may be a bit more work to do around this middle band before price heads back up to the upper band and new price highs.
I have drawn a Fibonacci Fan from the 2003 low to 2008 high. And we can see the recent low was bang on support from the 50% angle. I now expect the uptrend to make its way up to the 23.6% angle and price may end up just crawling along that angle into the final high. Let’s see.
The RSI showed a new high at the previous price high and I now expect new price highs to set up a bearish divergence here.
The MACD indicator is bearish so caution needs to be heeded.
DJT Monthly Chart

The Bollinger Bands show the recent low traded well below the lower band which is often seen at important lows. Price is now back at the middle band and I am looking for resistance to come in here and send price back to the lower band to set up a higher low.
I have drawn a Fibonacci Fan from the 2009 low. It shows the 2014 high at resistance from the 50% angle. Price subsequently traded back down breaking below support from the 61.8% angle with the recent low just above the 76.4% angle. The next challenge will be to get back up to the 61.8% angle which will now act as resistance.
I have added Fibonacci retracement levels of the move up from 2009 low to 2014 high and the recent low clipped the 38.2% level which keeps the overall bull trend in a strong position.
The RSI is zoomed up out of oversold territory while the MACD indicator looks to be threatening a bullish crossover.
Summing up, a new bull trend looks to be in its infancy with a higher low now needed to confirm that.
Let’s move on to the Dow Jones Utility Average.
The Dow Jones Utility Average (DJU) is a stock index that keeps track of 15 prominent utility companies. Price last traded at $658.83.
Let’s take a top down approach beginning with the quarterly chart.
DJU Quarterly Chart

Anyone see a bear market currently in play? Not me. On the contrary, price is setting new record highs. The long term bull market remains steady and sure.
The horizontal line denotes the 2008 high and the recent low was right around support from the level. There isn’t a better example of old tops often providing support in the future.
The Bollinger Bands show the recent low was just above the middle band and price is now already back up at the middle band. Price may encounter some small resistance at the first time back but should then swoop higher as it clings to the upper band.
I have drawn a Fibonacci Fan from the 2002 low to 2008 high. It shows the majority of the bull market crawled up along the 61.8% angle before launching up to the 50% angle which has been providing some resistance. I now favour price moving even higher and the only question I have is does price now crawl along the 50% angle or explode even higher up to the 38.2% angle. Time will tell.
The RSI is looking reasonably strong while the MACD indicator is back in bullish mode.
DJU Monthly Chart
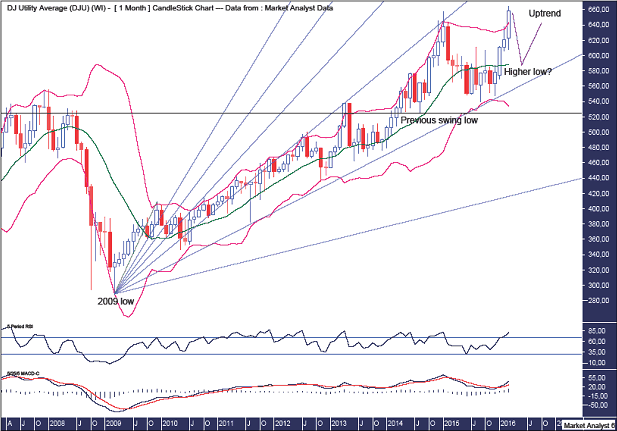
The horizontal line denotes the previous swing low which was not breached so the overall bull trend remains intact.
I have drawn a Fibonacci Fan from the 2009 low to first new swing high and it shows the bull market being contained within the 61.8% and 76.4% angles. The 2015 high was right around resistance from the 61.8% angle while the subsequent low was around support from the 61.8% angle. Nice.
The Bollinger Bands show the recent low was at support from the lower band and price is already back up at the upper band. I believe some further consolidation is needed before the uptrend really gets going again and hence I am looking for a move back to around the middle band to put in another higher low. The middle band is currently around 588.
The RSI is looking strong while the MACD indicator is bullish.
DJU Weekly Chart

The Bollinger Bands show the recent move higher climbing higher along the upper band. I expect a correction imminently and will be looking for the higher low to be back at the lower band.
I have drawn two Fibonacci Fans. Let’s run through them both.
The bearish fan drawn from the 2015 high shows the 2015 low at support from the 76.4% angle while reactions higher were held by resistance from the 88.6% angle. This resistance eventually gave way which ultimately led to new price highs.
The Bullish fan drawn from the 2015 low shows the first higher low dipped marginally below the 88.6% angle and it is this angle where I suspect the next major higher low will form. Let’s see.
The RSI is looking very strong while the MACD is looking very bullish. Both indicator look in need of a break and a correction shortly will provide just that.
So, everything looks decidedly bullish for both the Dow Jones Utility Average and Dow Jones Transportation Average. This would suggest those expecting a big, bear market are completely off base and the bull is back!
About Austin Galt
Austin Galt is The Voodoo Analyst. I have studied charts for over 20 years and am currently a private trader. Several years ago I worked as a licensed advisor with a well known Australian stock broker. While there was an abundance of fundamental analysts, there seemed to be a dearth of technical analysts. My aim here is to provide my view of technical analysis that is both intriguing and misunderstood by many. I like to refer to it as the black magic of stock market analysis.

“Over the last 12 to 24 months, many sectors have had huge declines, and I see here, there are some opportunities.”
“[The U.S. dollar] is not a desirable currency,” said Faber, perplexed why the world has been so “enthusiastic” about the greenback. “I think the most desirable currency will be gold, silver, platinum and palladium. I still think the mining sector has embarked on a new bull market.” (Ed Note: Marc talks about precious metal stocks having declined 80-90% prior to the recent rally)
“I think that in Asia, the sentiment turned very bearish at the end of last year and especially concerning China and the Chinese economy. And as a result of that, Macau gaming companies got slaughtered,” Faber said. “And now they are, in my view, at a relatively attractive level. They started to move up: [Las Vegas] Sands China, Wynn China.”
“I don’t think it’s a bargain by any means, but I believe China despite its near-term problems that could be very substantial, will in the long run be a very rewarding investment destination.”
….go to Marc’s page to listen to the
| Tue. | Wed. | Thu. | Fri. | Mon. | Tue. | Evaluation | |
| Monetary conditions | 0 | 0 | 0 | 0 | 0 | 0 | 0 |
| 5 day RSI S&P 500 | 70 | 76 | 82 | 85 | 85 | 81 | – |
| 5 day RSI NASDAQ | 63 | 71 | 73 | 78 | 80 | 83 | – |
|
McCl-
lAN OSC.
|
+40 | +106 | +167 | +168 | +130 | +90 |
0
|
| Composite Gauge | 10 | 6 | 6 | 7 | 8 | 11 | 0 |
| Comp. Gauge, 5 day m.a. | 8.8 | 8.4 | 7.4 | 7.8 | 7.4 | 7.6 | – |
| CBOE Put Call Ratio | 89 | .91 | .67 | .78 | .90 | 1.08 |
+
|
| VIX | 16.84 | 14.99 | 14.44 | 14.02 | 13.79 | 14.17 | – |
| VIX % change | 0 | -11 | -4 | -3 | -2 | +3 | 0 |
| VIX % change 5 day m.a. | -2.0 | -3.8 | -4.2 | -3.0 | -4.0 | -3.4 | – |
| Adv – Dec 3 day m.a. | -30 | -51 | +680 | +1410 | +800 | +136 | 0 |
| Supply Demand 5 day m.a. | .78 | .79 | .83 | .78 | .82 | .73 | 0 |
| Trading Index (TRIN) | 1.04 | 1.42 | .94 | 1.10 | .79 | 1.25 |
0
|
|
S&P 500
|
2016 | 2027 | 2041 | 2050 | 2052 | 2050 | Plurality -4 |

-
I know Mike is a very solid investor and respect his opinions very much. So if he says pay attention to this or that - I will.
~ Dale G.
-
I've started managing my own investments so view Michael's site as a one-stop shop from which to get information and perspectives.
~ Dave E.
-
Michael offers easy reading, honest, common sense information that anyone can use in a practical manner.
~ der_al.
-
A sane voice in a scrambled investment world.
~ Ed R.
Inside Edge Pro Contributors

Greg Weldon

Josef Schachter

Tyler Bollhorn

Ryan Irvine

Paul Beattie

Martin Straith

Patrick Ceresna

Mark Leibovit

James Thorne

Victor Adair