
Timing & trends

Assets, including illiquid ones like art, cars and houses have become volatile. A Picasso that traded for GBP 18.9 million in January had traded for GBP 28 million in 2013.
And then there is the mania in Vancouver. Nice house with a view into English Bay lists for $7 million and trades for $9 million.

 ECB/Draghi Band-Aids Not Able To Stem Bubble Bursting On Europe’s Zombie Banks
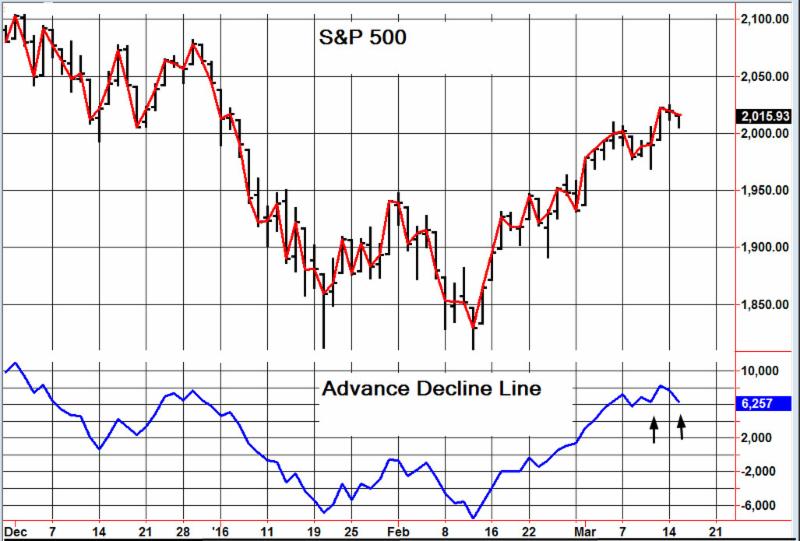
Stock Market Vulnerable To 15%+ Plunge
Oil Price Should Retest Lows At US$26/b Over Next Two Months
What’s Inside:
-
The weakness worldwide in the banking sector as central banks move further to negative interest rates will depress bank earning even further which will result in falling world stockmarkets.Intermarketmargincalls arelikely.
BUY Favourite Names On This Next Phase Of Market Weakness!
-
Maison Universe High Impact Drilling Watch List
-
Terminating Coverage:
Long Run Exploration Ltd. (LRE)
LRE shareholders approved the sale of the company to
Calgary Sinoenergy Investment Corp. on Feb/29, 2016.
Petromanas Energy Inc. (PMI)
PMI sold its key asset in Albania to a subsidiary of Royal Dutch Shell plc., and on March 14, 2016 shareholders approved a special distribution of most of the funds.
Sterling Resources Ltd. (SLG)
SLG has entered a recapitalization agreement with debt holders and as a result value creation has been delayed.
-
Research Updates:
-
Gran Tierra Energy Inc. (GTE)
-
Pengrowth Energy Corporation (PGF)
-
Top Picks: No Picks This Month – Downside Risk High
-
Recommended Buy List
-
Coverage List
Following last month’s inflation ‘jolt’ to the marketplace, Core CPI increased 2.3% YoY in Feb – the biggest jump since October 2008 (led by the biggest monthly surge in apparel prices since 2009). Bond & Stock markets are dropping in the news as it corners The Fed further into a hawkish stance, despite the recessionary warning signals screaming from the manufacturing (and increasingly Services) sector.
The Core CPI print has not been higher since October 2008…


| Tue. | Wed. | Thu. | Fri. | Mon. | Tue. | Evaluation | |
| Monetary conditions | 0 | 0 | 0 | 0 | 0 | 0 | 0 |
| 5 day RSI S&P 500 | 55 | 62 | 62 | 78 | 75 | 70 | – |
| 5 day RSI NASDAQ | 50 | 58 | 53 | 73 | 73 | 63 | 0 |
|
McCl-
lAN OSC.
|
+176 | +202 | +138 | +205 | +143 | +40 |
0
|
| Composite Gauge | 15 | 8 | 11 | 5 | 10 | 10 | 0 |
| Comp. Gauge, 5 day m.a. | 7.6 | 8.2 | 9.6 | 9.2 | 9.8 | 8.8 | 0 |
| CBOE Put Call Ratio | .98 | .93 | .99 | 1.01 | .92 | 89 |
0
|
| VIX | 18.67 | 18.34 | 18.05 | 16.50 | 16.92 | 16.84 | 0 |
| VIX % change | +8 | -2 | -2 | -9 | +3 | 0 | 0 |
| VIX % change 5 day m.a. | +1.4 | +1.6 | +1.6 | -0.4 | -.04 | -2.0 | 0 |
| Adv – Dec 3 day m.a. | +111 | +176 | +353 | +776 | -262 | -30 | 0 |
| Supply Demand 5 day m.a. | .68 | .63 | .54 | .62 | .60 | .78 | 0 |
| Trading Index (TRIN) | 1.83 | 1.09 | .67 | .72 | 1.31 | 1.04 |
0
|
|
S&P 500
|
1979 | 1989 | 1990 | 2022 | 2020 | 2016 | Plurality -1 |
- As it often does, gold is pausing ahead of this week’s FOMC meeting. I don’t expect Janet Yellen to raise rates this week, although recent jobs reports and the oil price rally are likely tempting her to do so.
- The limited recovery from the meltdown in global stock markets after her first rate hike is likely to convince Janet to hold off, but only until the next meeting.
- That is when a fresh and potentially horrific US stock market meltdown is most likely.
- Please click here now. Please double-click to enlarge. That’s the daily gold chart. The sell-off that began last week is building the right shoulder of a solid inverse head and shoulders pattern, which is strengthening the overall technical picture.
- For a look at key liquidity flows into and out of gold, please click here now. That’s a snapshot of the latest COT report, and I’ve highlighted the commercial bank actions in green.
- The banks clearly are not afraid to “chase some price” in this general price area, as they added long positions as well as short ones quite recently.
- The COT reports offer a look at what the banks have done in the past, but to understand what they are likely doing in the present, please click here now. Please double-click to enlarge. That’s a short term gold chart, using five minute bars.
- Note the sizable volume bars that are appearing. In my professional opinion, the banks have already covered tens of thousands of short positions, just in the past few trading sessions.
- If my right shoulder projection plays out, I think they will have covered off many more, and will be adding long positions quite aggressively as they do that.
- Please click here now. From a fundamental perspective, gold’s rally from December has been mainly based on three factors:
- First, Janet’s rate hike created a huge panic in risk-on markets. Second, influential economists began suggesting that a new upcycle for commodities could begin later this year.
- That caused money managers to commit to the entire commodity sector, on an ongoing basis as a value play.
- Third, Chinese New Year buying was a strong seasonal factor.
- Indian demand is often limited at this time of the year, but it has been more soft than usual because of hopes for a duty cut, and now a jeweller strike. If the strike continues, official Indian demand could be under 20 tons in March.
- In the short term, it’s difficult for gold to make strong headway with Chinese New Year buying finished, and India being this quiet…unless some new fear trade catalyst is on the near-term horizon.
- What could that be? For the likely answer, please click here now. Japanese central banker Kuroda left rates unchanged at the latest BOJ meeting, but many top bank economists feel he could be poised to do something drastic at the next meeting in April with his QEE program.
- I’ve argued that rate hikes in America and NIRP (negative rates) in Europe and Japan are a potent combination for higher gold prices.
- If Indian jewellers end their strike in April, as Janet hikes rates and Kuroda drastically ramps up QEE, gold could begin a much more aggressive rally than what has already occurred in the past few months.
- Please click here now. While these comments about China tying gold reserves to GDP were arguably made by somebody “talking their book”, the PBOC has released official written statements about the key role of gold in the internationalization of the yuan.
- The SGE gold price fix is scheduled, tentatively, for an April 19 launch date, and that time frame coincides with many other key events for price discovery in the West.
- Tactics? As always, amateur investors who tend to panic during gold price pullbacks should buy put options. While I’m always massively net long gold, I also always make sure I add some short positions into rallies, following the “financial footsteps” of the commercial bank traders.
- Please click here now. Please double-click to enlarge. That’s the GDX weekly chart. It looks spectacular, but the most likely price action in the short term is a bit of a “sideways chop”.
- That chop should see a couple of right shoulders form, as part of a big inverse head and shoulders bottom pattern. While anything is possible in any market at any time, including new lows for gold, I think the Western gold community is starting to look pretty good here, given the sizable institutional buying taking place “across the board” in gold stocks.
- Because a lot of that buying is value-oriented, even if gold did “impossibly” go to a new low, the substantial institutional commitment to gold stocks that is in play now is likely to accelerate. Simply put, there’s a wave of confidence sweeping through the institutional investor community about gold stocks, and I think it’s time for the Western gold community to grab an extra gold stocks surfboard, and have some fun!
Mar 15, 2016
Stewart Thomson
Graceland Updates
website: www.gracelandupdates.com
email for questions: stewart@gracelandupdates.com
email to request the free reports: freereports@gracelandupdates.com

-
I know Mike is a very solid investor and respect his opinions very much. So if he says pay attention to this or that - I will.
~ Dale G.
-
I've started managing my own investments so view Michael's site as a one-stop shop from which to get information and perspectives.
~ Dave E.
-
Michael offers easy reading, honest, common sense information that anyone can use in a practical manner.
~ der_al.
-
A sane voice in a scrambled investment world.
~ Ed R.
Inside Edge Pro Contributors

Greg Weldon

Josef Schachter

Tyler Bollhorn

Ryan Irvine

Paul Beattie

Martin Straith

Patrick Ceresna

Mark Leibovit

James Thorne

Victor Adair