
Timing & trends
 The majority of traders over-trade, over-analyze and generally make things way too complicated. The mystery of making money in stocks must have a deep and complicated answer, right?
Wrong.
After nearly 20 years as a trader, analyst, investment banker and money manager, I can tell you that what’s keeping most people from making money in the markets is largely a function of having a repeatable process in place and keeping it simple.

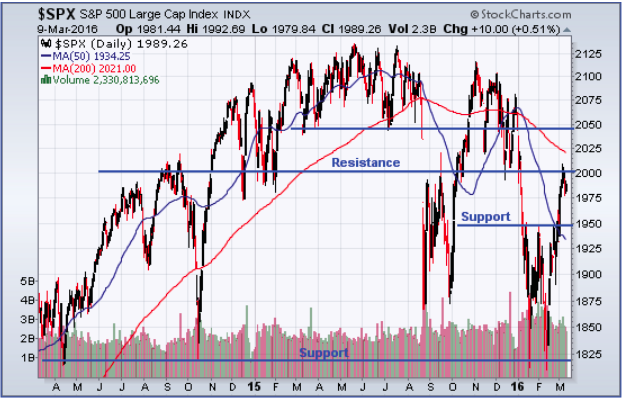
In this week’s report the key points are that the stock market, as represented by the S&P 500, has climbed further into the 2000-2030 target zone. It is time for the analytical rubber to meet Reality Road. This week should tell us a lot about whether the trend – which should be obeyed until it not longer exists – is going to remain intact. That trend is down.
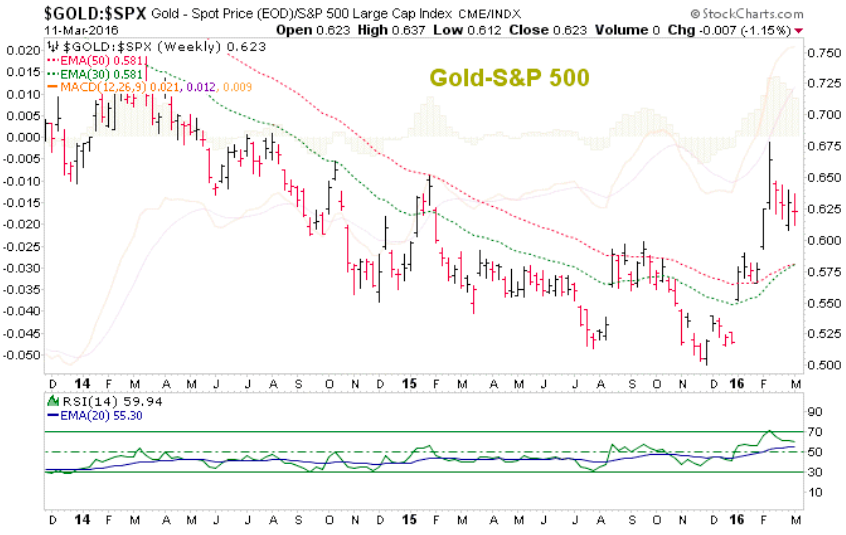
Over in the precious metals and commodity patches, things have been exhilarating but are over done. I do believe I spotted a few raging commodity bulls last week. Not to sound like a broken record but that trend also remains down. We can expect that the Fed is fully aware of the bounce in crude oil, base metals, agriculture and especially the big move that led it all; that would be the one in gold, which has changed its trend to up.
…..read the entire comphrehensive report HERE
The S&P 500 has broken above 1950, a key resistance level which should now provide support. The next level of resistance is 2000. If the S&P 500 is able to get above this level it will then have a good chance of moving higher to trade in the 2040 to 2135 range that dominated most of 2015. Given the weak fundamen- tal backdrop, it is going to be hard for the S&P 500 to break above its all time highs set last year at 2135. Nevertheless, in the next month and a half, up until the beginning of May, the S&P 500 should be able to
move higher in the short-term.
We are fast approaching the unfavorable six month period for stocks, which starts on May 6th. At this point in time, it is difficult to determine if the S&P 500 will finish its seasonal run early, or if will continue with strong momentum into May. The strength of the earnings and the stock markets reaction should provide some clues. Currently, it is better to give the S&P 500 the benefit of the doubt to move higher, especially if it is able to move and stay above 2000.

The following is part of Pivotal Events that was published for our subscribers March 3, 2016.
“Diminishing Liquidity”
Perspective
Diminishing liquidity in what used to be the very liquid Treasury market continues concerning. Of course this is due to interventionists being able to drive nominal interest rates to exceptional lows. Real rates, as adjusted by CPI inflation, have declined on every great bubble since the first brewed up in 1720. In the 1873 extravaganza they declined to minus 9 percent. In the 1825 example it was to minus 6 percent. For consistency, these are in the senior currency.
It should be emphasized that through financial history the record has been that once speculation has been pushed far enough the senior central bank has had little influence upon the yield curve, credit spreads and real long-dated interest rates.
Flattening and spread-widening have been the feature since June and at times the moves have unsettled equity markets. Despite all the talk about changing the Fed rate, credit markets reversed to contraction mode.
This suggests that when the serious move in real rates gets underway it will overwhelm the radical experiment in nominal rates.
With the last contraction, which is a polite way of describing the 2008 Crash, real long rates increased from minus 1.5 percent to 6 percent. The rise of over 7 percent was described as the worst financial calamity since the 1930s. The Great Recession.
As that eased rates decline to minus 1 percent in 2011. At around 3 percent now, the increase amounts to 4 percentage points. Let’s call this modest distress. Beyond an 8 percentage point increase would be serious.
However, the typical increase in real rates in the severe post-mania collapses has been 12 percentage points. This is possible.
The abuse of credit markets by financial adventurers at central banks, academe and Wall Street has been without precedent.
It needs correcting.
As a wrap, if policymakers really wanted to improve liquidity in the Treasury market they could end the arbitrary standard and make the US dollar convertible.
Stock Markets
On the nearer term, our target on the S&P has been the 50-Day moving average when it was at 1949. Last week we thought that a target had been accomplished and that a setback was possible. The decline in the VIX was enough to register a Spring Board Buy. Some 20 percent of these do not work and this one did not.
So we are back to riding the rally that was likely to run into March.
Banks (BKX) have rallied from 56 in early February to 64. The 50-Day at 67 has been the target. This and a high 60 on the Daily RSI could complete the rally.
Broker-Dealers (XBD) have accomplished much the same on the rally from 135 to 155. The 50-Day is at 156, which is doable. The Daily RSI in the high 60s would be a caution.
Base metal miners (XME) have been outstanding with a rally from 11.38 in mid-January to the 18 level. This has had two constructive steps, but yesterday’s jump from 17.55 to 18.32 shows short covering. The action is getting compulsive.
There is substantial resistance at the 20 level. The 200-Day is at 18.60. And the Daily RSI clocked a huge swing from 25 in January to 77. This is the level that has stopped all rallies on a chart back to 2006.
It is a percentage blessing and it is time to take some money off the gaming table.
Action in the Oil Patch (XLE) has been modest but constructive. The low was 50 in mid- January and it has worked its way to above the 50-Day at 57. Now at 59 it needs to get above resistance at 62 to extend the rally.
The overall market (NYA) has recovered from 8937 in January to 9865. There is a tested low in and this week the index got above the 50-Day. Action is constructive and there is resistance at 10300.
Golds (HUI) have jumped from 99 to 172 and will be reviewed below.
On the bigger picture, we used NYSE margin debt and breadth to remain positive until June. In May we used the Dow Theory to conclude that the bull market was ending. In July we used the curve and spreads to conclude that the bear was starting. Also in July the Chartworks got the third set of Upside Exhaustions needed to end the Shanghai Bubble.
This is a rally within a cyclical bear market.
Precious Metals
Our February 18th Pivot noted that the action had become impetuous. Everybody suddenly wanted in. The swing in the Daily RSI on the HUI was so outstanding that it even showed up in the Weekly chart.
The HUI low was 99 on the January hit. In reaching 173 today the gains have been outstanding. The latest enthusiasm is the “Golden Cross” whereby two moving averages – well – cross. The ChartWorks has a thorough study and the results have not been consistent.
The Daily momentum high was two weeks ago, the price high could be set soon. A consolidation of some weeks would be constructive.
The gold/silver ratio is again acting as the metallic credit spread.
A key low was set at 60 in June 2014 as the key low in credit spreads was set. Both have been “widening” since with the GSR now out to 84. On the same move, the “CCC” spread has widened from 7.91 to 21.68.
Both have further to go on this credit cycle.
Our target on the gold/silver ratio has been “around 100”.
Link to March 4, 2016 Bob Hoye interview on TalkDigitalNetwork.com:
http://talkdigitalnetwork.com/2016/03/us-dollar-drop-raises-loonie/
BOB HOYE, INSTITUTIONAL ADVISORS E-MAIL bhoye.institutionaladvisors@telus.net WEBSITE: www.institutionaladvisors.com
Listen to the Bob Hoye Podcast every Friday afternoon at TalkDigitalNetwork.com
Everyone and their brother now thinks that gold and silver are headed to the moon. All because they’ve had a decent rally of late. Gold jumping from its low $1,044 last December (nearest futures) to as high as roughly $1,268 recently …
Silver from a low of $13.62 (nearest futures) last December to a recent high of as much as $15.99.
And truth be told, gold and silver have indeed most likely bottomed, right on target with my forecast for last year, to bottom in late November/early December.
So why am I panning gold and silver now? Actually, I am not. I am panning all the pundits and investors out there who now say gold and silver are headed straight up to new record highs … and that if you don’t buy now, you’ve missed the train.
Nothing could be further from the truth. You have not missed the train. But what I do NOT want you to do is jump on the gold and silver bandwagon at an intermediate-term top!
Instead, I want you to be buyers on the next pullback, buying when everyone else is turning bearish again … buying near the next set of lows … so you can then maximize your profit potential.
Good, healthy, strong, long-lasting bull markets are made up of zigs and zags higher. Strong rallies. Followed by sharp, deep pullbacks.
And that’s exactly what’s about to happen in gold and silver. Not to mention platinum and palladium.
Here’s one way I know: My trusty cycle analysis of gold, based on my artificial intelligence and neural net models that analyze tens of thousands of trading data points on gold and silver and then crunch them billions of times over to find the most probable cycles and forward path for prices.
 Take a look. What do you see? Gold topping now, and heading lower into early June.
From there, we should then see gold’s next major leg higher begin.
Ditto for all the other precious metals.
So my best advice right now, as hard as it may be to follow, is NOT to buy any gold and silver.
And instead, to wait patiently for the next opportunity.
How low can gold and silver go on this pullback?
Gold can fall all the way back to $1,180, possibly even lower. Silver can fall all the way back to the low $14 level, possibly even $13.50.
As far as I am concerned, I will be using this upcoming pullback to get bearish gold and silver, to make money on the short side. And, I will be advising my trading subscribers to do the same.
But that’s not for the faint of heart and it’s not for me to recommend in this column, as timing is everything. I could not possibly get you in and out of the market in a column that publishes once a week.
The same thing, of course, applies to virtually all markets. I can’t give you timely recommendations in a weekly column. I need to be able to communicate with you daily, sometimes more than once a day, and by hook or crook, text messaging, emails, voice broadcasts, whatever means.
I’m merely mentioning that now for only one reason: Nearly all markets are now heating up in a way where there will be more fortunes made by savvy traders than at any time since the late 1970s.
And if you want to be a part of it, you should consider one of my trading services. It could be the best step you ever took for your finances.
Meanwhile, there’s something else I want to warn you about, not just the coming pullback in gold and silver.
It’s the crooked gold and silver dealers that are now surfacing on TV and newspapers again.
They are using the political mess in our country to pitch highly overpriced gold and silver coins and commemorative pieces to the public.
They use well-known actors, who get paid a lot of money to make the pitch. The pitches look and sound great of course. And they are made by professional sounding firms that usually have the word “Mint” in them.
But they are complete, unadulterated rip-offs. One such commercial that’s airing frequently is selling a silver eagle coin, calling it a mint state strike — for $25 a coin. That a whopping 59.33 percent premium over the price of silver.
What a rip-off! There’s nothing special or mint state about the coin. It’s a con game, plain and simple.
WHEN it comes time to buy gold and silver again, I’ll tell you where you can get the best deals.
For now, do not buy any gold and silver and steer clear of all the bullion advertising you’re seeing now in print and on TV. They’re mostly scams.
Best wishes, as always …
Larry

-
I know Mike is a very solid investor and respect his opinions very much. So if he says pay attention to this or that - I will.
~ Dale G.
-
I've started managing my own investments so view Michael's site as a one-stop shop from which to get information and perspectives.
~ Dave E.
-
Michael offers easy reading, honest, common sense information that anyone can use in a practical manner.
~ der_al.
-
A sane voice in a scrambled investment world.
~ Ed R.
Inside Edge Pro Contributors

Greg Weldon

Josef Schachter

Tyler Bollhorn

Ryan Irvine

Paul Beattie

Martin Straith

Patrick Ceresna

Mark Leibovit

James Thorne

Victor Adair