
Timing & trends

| Mon. | Tue. | Wed. | Thu. | Fri. | Mon. | Evaluation | |
| Monetary conditions | 0 | 0 | 0 | 0 | 0 | 0 | 0 |
| 5 day RSI S&P 500 | 76 | 57 | 62 | 71 | 67 | 54 | 0 |
| 5 day RSI NASDAQ | 73 | 56 | 63 | 68 | 70 | 59 | 0 |
|
McCl-
lAN OSC.
|
+226 | +148 | +168 | +210 | +214 | +199 |
–
|
| Composite Gauge | 4 | 16 | 9 | 5 | 10 | 12 | 0 |
| Comp. Gauge, 5 day m.a. | 7.0 | 9.4 | 10.2 | 8.8 | 8.8 | 10.4 | 0 |
| CBOE Put Call Ratio | .95 | 1.12 | 1.04 | .92 | .99 | 1.20 |
+
|
| VIX | 19.38 | 20.28 | 20.72 | 19.11 | 19.81 | 20.55 | 0 |
| VIX % change | -6 | +8 | -1 | -8 | +4 | +4 | 0 |
| VIX % change 5 day m.a. | -4.4 | -1.8 | -0.6 | -1.6 | -0.6 | +1.4 | 0 |
| Adv – Dec 3 day m.a. | +502 | +143 | +380 | +239 | +822 | +715 | – |
| Supply Demand 5 day m.a. | .79 | .61 | .62 | .78 | .62 | .43 | + |
| Trading Index (TRIN) | .37 | 1.96 | 1.06 | .84 | .96 | 1.41 |
+
|
|
S&P 500
|
1946 | 1921 | 1930 | 1952 | 1948 | 1932 | Plurality +1 |

Silver looks like it has bottomed and will move substantially higher. Why?
Long Term – 25+ years: Examine the silver to gold ratio since 1990. The ratio is currently low and appears to have bottomed. Silver bottoms when the ratio bottoms. Expect a multi-year rally.
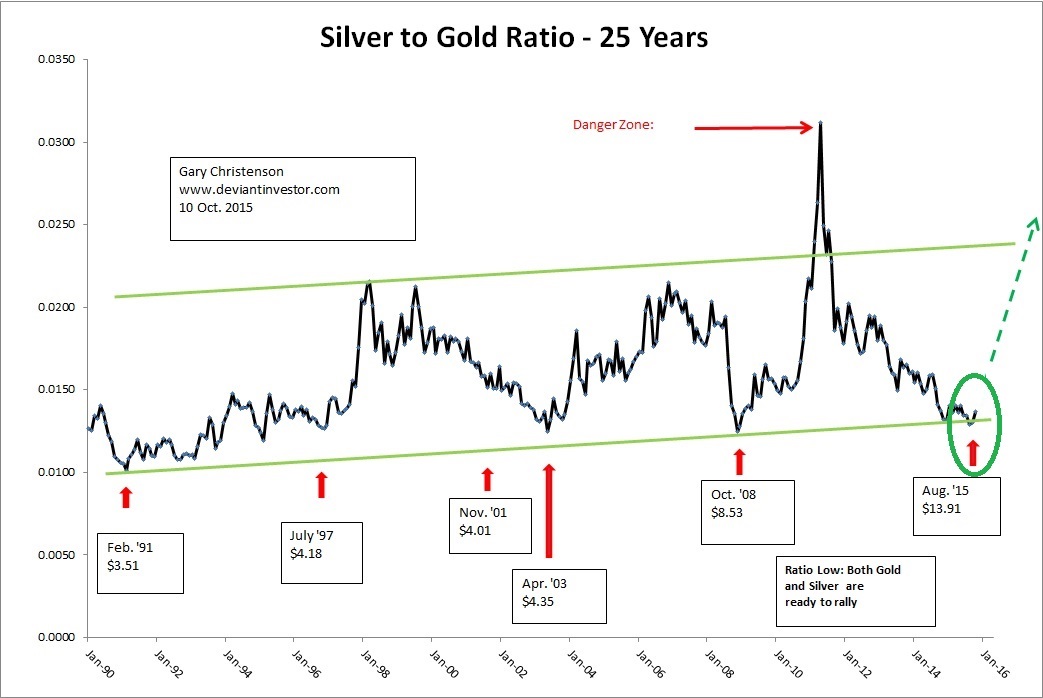
Medium Term – 15+ years.
| Wed. | Thu. | Fri. | Mon. | Tue. | Wed. | Evaluation | |
| Monetary conditions | 0 | 0 | 0 | 0 | 0 | 0 | 0 |
| 5 day RSI S&P 500 | 72 | 66 | 66 | 76 | 57 | 62 | 0 |
| 5 day RSI NASDAQ | 74 | 63 | 65 | 73 | 56 | 63 | 0 |
|
McCl-
lAN OSC.
|
+191 | +174 | +154 | +226 | +148 | +168 |
–
|
| Composite Gauge | 5 | 12 | 10 | 4 | 16 | 9 | 0 |
| Comp. Gauge, 5 day m.a. | 8.4 | 8.0 | 7.2 | 7.0 | 9.4 | 10.2 | 0 |
| CBOE Put Call Ratio | 1.14 | 1.07 | 1.03 | .95 | 1.12 | 1.04 |
+
|
| VIX | 22.31 | 21.65 | 20.53 | 19.38 | 20.28 | 20.72 | 0 |
| VIX % change | -7 | -3 | -1 | -6 | +8 | -1 | 0 |
| VIX % change 5 day m.a. | -3.2 | -4.0 | -5.2 | -4.4 | -1.8 | -0.6 | 0 |
| Adv – Dec 3 day m.a. | +1882 | +1301 | +624 | +502 | +143 | +380 | 0 |
| Supply Demand 5 day m.a. | .69 | .71 | .80 | .79 | .61 | .62 | 0 |
| Trading Index (TRIN) | .58 | 1.51 | 1.76 | .37 | 1.96 | 1.06 |
0
|
|
S&P 500
|
1927 | 1918 | 1918 | 1946 | 1921 | 1930 | Plurality 0 |

One of the most important aspects of the rising tide of geopolitical disruptions — as spelled out by the research I have done on war cycles — is how they are impacting the world’s financial markets.
As I’ve discussed many times in the past, they are changing everything you thought you knew about investing.
Consider the U.S. property markets, which have already recovered from their lows quite nicely — even as mortgage rates have stabilized and started moving higher.
Consider how the Chinese and Europeans, as well as the Canadians, are now the biggest foreign buyers of U.S. real estate, which is helping to support that sector.
Consider that recently, a Chinese-led investor group announced it would buy the Chicago Stock Exchange.
Or that there have already been 82 Chinese outbound mergers-and-acquisitions deals announced this year, amounting to $73 billion in value, according to Dealogic. That’s up from 55 deals worth $6.2 billion in the same period last year.
Or consider gold, which is now nearly 16 percent above its bear market low of last December, moving up right on schedule, even though the U.S. dollar also remains strong.
Or the U.S. stock markets, whose bear market correction is continually being supported by foreign capital inflows.
You are going to see and hear more about foreign-capital inflows in the months and years ahead. Inflows that will shock you and cause wild moves in markets that defy logic.
Moves that dumbfound most U.S. analysts, especially those — the majority of them — who still focus merely on the U.S. economy and who ignore what’s happening on a global basis.
 Gold will rise with a stronger dollar. Commodity prices in general will soon bottom and head higher, even though the global economy remains lackluster at best. Oil, for instance, has already bottomed, again right on cue with my forecasts.
Equity markets and property prices will increase with rising interest rates.
So what then is the common denominator behind these market moves?
What’s the fuel that is causing the linkages between them to change, wreaking havoc on old rules of thumb and ushering in new relationships between markets, between economic data and logic …
Creating forces that you must grasp to truly protect and grow your wealth?
It’s geopolitics and international capital flows. Reasons:
Today, we live in a world where governments are at war with each other. Propaganda wars. Trade wars. Currency wars.
Today, we live in a world where governments are getting ready to reignite “hot” wars: Russia/Ukraine. China/Japan. Israel/Gaza. Then, there’s ISIS and its rampage in the Middle East.
And today, we also live in a world where the bankrupt governments of the West are waging wars against their very own citizens, via tax hikes, confiscatory schemes, and capital controls.
All of this is causing capital in nearly every corner of the globe to take flight, leaving risky countries and investments and heading toward safer shores.
For many months now. I have told you that those capital flows are pointing directly toward the United States. Savvy European investors are moving their investments out of Europe in droves.
Middle Eastern money is also coming to our shores. Savvy Chinese investors are investing in the Unites States hand over fist, and especially in U.S. property markets.
My view: Based on how the war cycles are ramping up for another five years and how they do not show any relief until 2020, capital is likely to continue to stampede into U.S. investments.
Reason: Despite our country’s problems, we remain one of the safest countries on the planet, with the most open, liquid and diverse markets in the world.
My words for you: Follow the money going forward. The international capital flows. They are the single biggest key to protecting and growing your wealth now and for many moons to come.
Best wishes,
Larry
P.S. We are on the cusp of the most profitable bull market of our lifetime. Stocks will be driven higher by powerful global undercurrents that Wall Street will either ignore or fail to understand. As the Dow doubles, some stocks will see explosive gains of 300%, 400%, 500% and more. Savvy investors who make the right moves will become very rich! Click here for my free report and to find out how it could make you rich beyond your dreams.
Wednesday evening we raised a question in a subscriber update. We wrote: The current question for Gold and gold stocks is if they will push to higher targets before or a correction or if a correction has already started. We should know the answer in the next day or two. The gold stocks exploded higher on Thursday. GDX gained 6% while GDXJ surged 7.4%. Meanwhile, Gold solidified its support at $1200/oz. Markets that become overbought within strong trends can become extremely overbought before they correct. Recent price action in the precious metals complex argues that the path of least resistance in the short term continues to be higher.
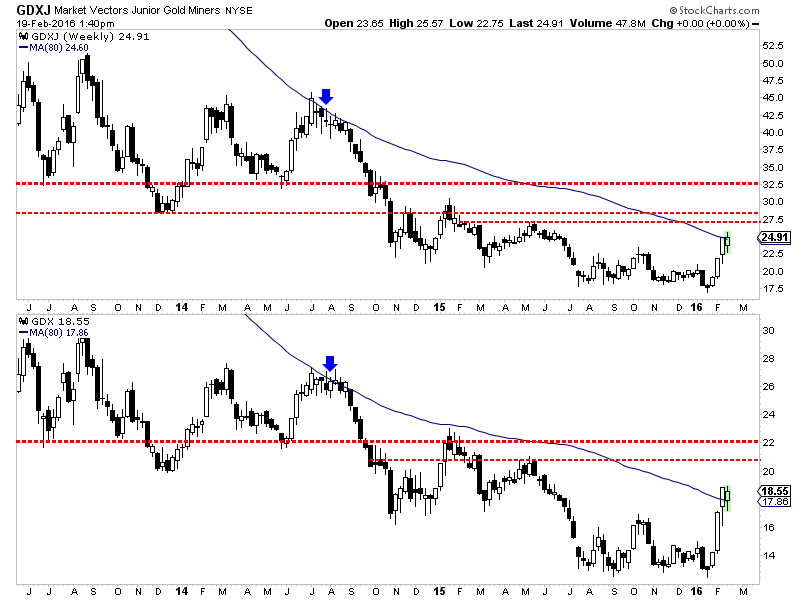
The chart below plots the weekly candle charts of GDXJ and GDX. The first observation is although the miners are very overbought on the daily charts, they aren’t that overbought on the weekly charts. They will close this week flat after three strong weeks of gains. Also, the miners figure to face stronger resistance at higher levels. GDXJ is trading pennies below $25.00. If it surpasses its 80-week moving average then its next target is $27-$28. (Note that a measured move from the July 2015 to January 2016 consolidation projects to $28). Meanwhile, GDX is holding above previous resistance at $18. Its next strong resistance targets are $21 and $22. (The measured move from the July 2015 to January 2016 consolidation projects to $21).
The monthly chart of Gold continues to give the most clarity on its prognosis. We have written about the importance of Gold holding support at $1180-$1200/oz, which it did this week. A monthly close above that support adds greater confirmation to a change in the primary trend. Gold has near-term upside potential to $1285/oz which marks monthly resistance and contains the 40-month moving average. Note that weekly resistance is at $1294. In addition, there should be very strong monthly resistance at $1330.

The odds favor Gold and gold stocks continuing to move higher before a correction begins. Both GDX and GDXJ could gain more than 10% before reaching stronger resistance while Gold has upside potential to $1285-$1294/oz. The counter-trend moves within very strong trends occur quickly. Gold declined from $1264/oz to $1192/oz in less than three days while the miners (GDX and GDXJ) have corrected 9-10% twice in the past ten days. Unless Gold and gold stocks fall below Thursday’s lows then we should anticipate higher prices in the short-term. A bigger correction will come but not yet. Consider learning more about our premium service including our favorite junior miners which we expect to outperform in 2016.

-
I know Mike is a very solid investor and respect his opinions very much. So if he says pay attention to this or that - I will.
~ Dale G.
-
I've started managing my own investments so view Michael's site as a one-stop shop from which to get information and perspectives.
~ Dave E.
-
Michael offers easy reading, honest, common sense information that anyone can use in a practical manner.
~ der_al.
-
A sane voice in a scrambled investment world.
~ Ed R.
Inside Edge Pro Contributors

Greg Weldon

Josef Schachter

Tyler Bollhorn

Ryan Irvine

Paul Beattie

Martin Straith

Patrick Ceresna

Mark Leibovit

James Thorne

Victor Adair