
Timing & trends
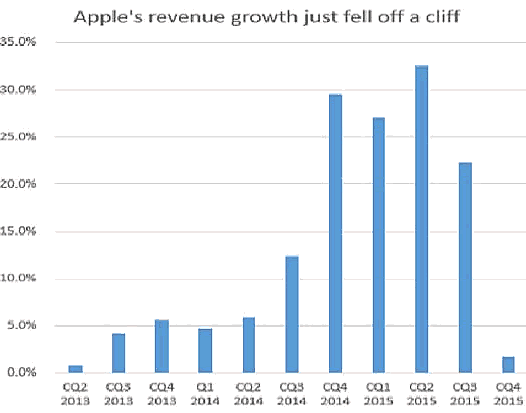
One by one the pillars of the recovery are toppling. Last year the Chinese infrastructure party ended and the shale oil boom went bust. More recently the FANG stocks went from pulling the market up to pushing it down. And today Apple — whose sales would always go up because everyone on Earth wants an iPhone and there were still some people in Africa and the Amazon Basin who don’t yet have one — reported that not only is its revenue no longer growing, but it might shrink in the year ahead.
Apple off 2.2% after hours on no-growth worry
(USA Today) – Apple investors had plenty of warning the high-flying stock was about to slow. They just got proof.
Apple’s revenue missed expectations in the just-reported fourth quarter, and the gadget maker is warning it could post the first drop in revenue since the 2009 recession in the current, first calendar quarter.
There are already signs of a slowdown. Apple reported quarterly revenue of $75.9 billion, which missed expectations, inching up just 1.7% from the same period a year ago. That was Apple’s lowest revenue growth since the June quarter of 2013, says S&P Capital IQ, when revenue rose 0.9%. Analysts were looking for revenue of $76.5 billion.
But here’s where it gets concerning for investors, who may need to readjust their expectations on what used to be the hottest stock going. Apple said revenue would be $50 billion to $53 billion in the current quarter. That falls short of the $55.3 billion that had been expected.
If Apple’s revenue is just $50 billion in the first quarter, it would be a 14% drop from the $58 billion in revenue reported in the same quarter a year ago. That would be Apple’s first quarterly drop in revenue since a 5.4% decrease in the September quarter of 2009, says S&P Capital IQ.
Seeing growth hit the skids is very unusual for this company that not long ago looked like it had a license to print money. It’s another sign of the growing saturation of the market for $650 smartphones. The stock market has been signaling for months that Apple’s overall growth, especially in the smartphone market, was about to slow dramatically. Analysts have been slashing estimates for the fourth quarter.
Shares of Apple closed Tuesday up 55 cents, or 0.6%, to $99.99 in regular trading, but still are down a crushing 25% from their high last year. Apple shares fell 2.2% afterhours following the earnings news.
All good things must come to an end, and cutting-edge smartphones are no exception. They are, in fact, a victim of their own technological success. Now that even low-end phones do things that were considered amazing three years ago, the rationale for paying up is becoming less compelling.
Personal anecdote: Each of our young-adult sons broke their high-end phones in the past year. One pulled out an old flip phone and is now using it quite happily, since it texts and that’s his main mode of communication. The other went to the local AT&T store and bought a $50 Windows phone that, he says, works just fine. Following in their tech footsteps (as I tend to do), when I dropped and broke my Samsung phablet, I dug out its predecessor, a three-year-old iPhone 4, and will use it until it dies. Then I’ll get the best available sub-$100 smartphone.
But tech cycles aren’t the point. What matters here is the growing realization that as the world leverages itself ever-more-precariously it takes ever-larger amounts of new leverage to generate growth. And the past year’s credit growth has been inadequate. The global economy is slowing and, in an inflate-or-die world, recession is now an existential threat.

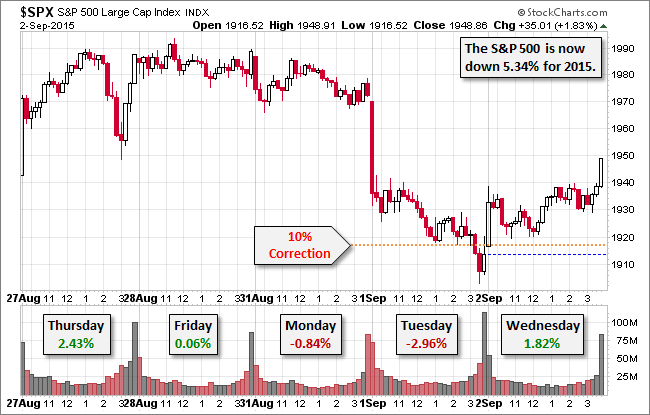
The two-day rally off last Wednesday’s interim low ended today, apparently triggered by renewed selling in oil and in nervous expectations of major economic indicators later this week (Consumer Sentiment, Durable Goods, Q4 GDP, etc.). The end-of-day spot price for West Texas Crude plunged 7.6%. The S&P 500 opened lower and zigzagged in a narrow range to a trend of renewed selling after the lunch hour. The index closed with a 1.56% loss, just a hair above its -1.62% intraday low in the closing minutes.
The yield on the 10-year note closed at 2.03%, down 4 basis points from the previous close.
Here is a snapshot of past five sessions.

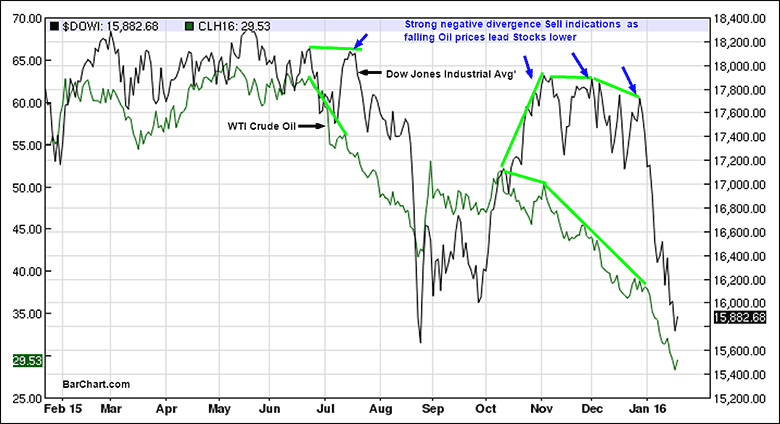
Since North American petroleum production spawned an oil bear market in 2014, energy prices have had a commanding influence on stock prices. As US stock prices repeatedly retested their previous highs last July and again in late December 2015, we witnessed an extreme negative divergence with oil prices signaling trouble for equities. Each time oil fell to new lows the Dow could not resist the rising perception of global slowing and eventually crashed over 10% each time. If soothsayers can determine when oil will bottom, we can be assured that stocks will follow suit.
….for more analysis and larger charts go HERE
| Wed. | Thu. | Fri. | Tue. | Wed. | Thu. | Evaluation | |
| Monetary conditions | 0 | 0 | 0 | 0 | 0 | 0 | 0 |
| 5 day RSI S&P 500 | 17 | 37 | 26 | 27 | 22 | 29 | + |
| 5 day RSI NASDAQ | 15 | 35 | 24 | 24 | 23 | 23 | + |
|
McCl-
lAN OSC.
|
-268 | -168 | -239 | -247 | -274 | -174 |
+
|
| Composite Gauge | 17 | 7 | 15 | 13 | 15 | 10 | 0 |
| Comp. Gauge, 5 day m.a. | 15.0 | 13.0 | 12.6 | 12.8 | 13.4 | 12.0 | 0 |
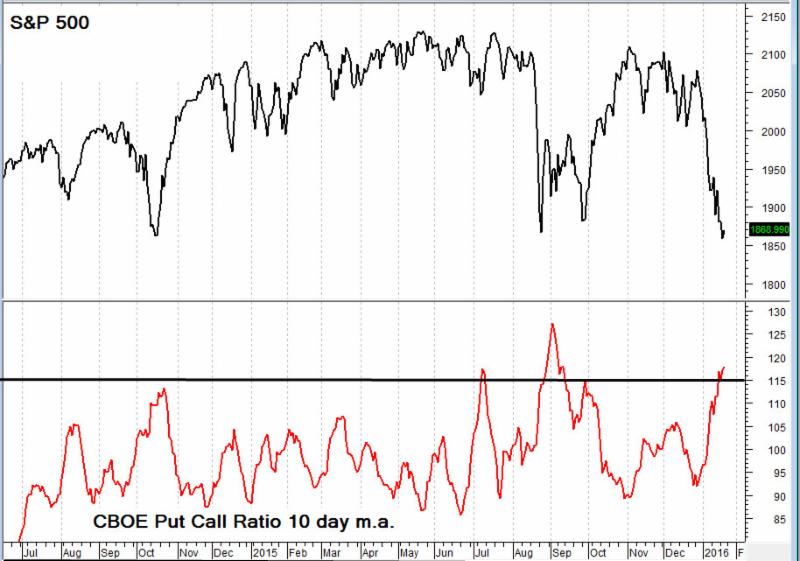
| CBOE Put Call Ratio | 1.19 | 1.01 | 1.55 | .90 | 1.18 | 1.09 |
+
|
| VIX | 25.22 | 23.95 | 27.02 | 26.05 | 27.54 | 26.69 | + |
| VIX % change | +12 | -5 | +13 | -4 | +6 | -3 | 0 |
| VIX % change 5 day m.a. | +4.6 | -0.6 | +0.4 | +1.6 | +4.4 | +1.4 | 0 |
| Adv – Dec 3 day m.a. | -812 | -498 | -1141 | -676 | -1534 | -520 | + |
| Supply Demand 5 day m.a. | .33 | .46 | .52 | .48 | .48 | .57 | 0 |
| Trading Index (TRIN) | 1.16 | .65 | 1.76 | 1.16 | 1.11 | .88 |
0
|
|
S&P 500
|
1890 | 1922 | 1880 | 1881 | 1859 | 1869 | Plurality +6 |
 Voleo, a Canadian financial technology mobile application company, today announced a ollaboration with the Toronto Stock Exchange and TSX Venture Exchange.
Working together to engage millennial investors and break down the barriers to investing, they have launched the Voleo TSX Equity Trading Competition.
The competiton is a simulated public markets investment competition that provides post-secondary students across the country with the tools and information they need to confidently enter the Canadian investment landscape.

-
I know Mike is a very solid investor and respect his opinions very much. So if he says pay attention to this or that - I will.
~ Dale G.
-
I've started managing my own investments so view Michael's site as a one-stop shop from which to get information and perspectives.
~ Dave E.
-
Michael offers easy reading, honest, common sense information that anyone can use in a practical manner.
~ der_al.
-
A sane voice in a scrambled investment world.
~ Ed R.
Inside Edge Pro Contributors

Greg Weldon

Josef Schachter

Tyler Bollhorn

Ryan Irvine

Paul Beattie

Martin Straith

Patrick Ceresna

Mark Leibovit

James Thorne

Victor Adair