
Timing & trends
There has been extensive discussion, questioning the current decline and if a bear market has begun. We called the May 2015 top in the DOW last year with the decline in August 2015 as wave (1) down and the following rally as wave (2) up. The equity markets are now in wave (3) down. We published a previous newsletter which explained bubbles and parabolic advances and we are now seeing the effects of these historic advances. Parabolic advances ALWAYS end poorly and retrace the entire advance of the parabolic move. The DOW spent most of 2015 in a topping process and has now broken down with substantial downside ahead.
We called the top in Crude in July of 2014 and confirmed the wave (c) decline after it broke the first lower trendline. We had another confirmation on Oct 9th 2014 when it broke the second lower trendline.
The charts below were posted on our site on Jun 12 2014 and on Oct 14th 2014. The first Crude chart was posted when the price was still over $100. We had a minimum target of $30-$32 which has now been broken and we should see further downside to complete this wave down. Keep in mind that Crude was trading at $11 a barrel in 1998, although we don’t expect to see it move this low at this juncture. Many of the oil stocks still have considerable downside ahead which have extremely lagged the decline in Crude. The continued downside in Crude could align with the expected lows for the XOI index, but if not, it could suggest that we will see a long sideways pattern after Crude bottoms in a Leading Diagonal pattern. We will determine this possibility of a Leading Diagonal pattern when Crude bottoms and compare it with the oil stocks and XOI index. We will want to determine if the XOI has bottomed with Crude, or if the XOI has further bottoming action ahead. We are already looking ahead to determine how Crude will bounce off the bottom, since a Leading Diagonal pattern will be difficult to trade. Crude may not bounce as it did at the 2009 lows.
Quick Notes on Gold, USD, Real Estate, TNX -10 Year US Treasury Yield (interest rates)
1:We are expecting a large rally in Gold, Silver and the HUI, but we should see further downside in wave V before this advance begins. The metals and associated stocks are extremely over sold and a substantial bounce is lining up this year.
2:The USD has further upside ahead in wave V which aligns with the forecast for the metals and Crude. The upper trendline for the USD is near the 103 area.
3:Our Real Estate chart indicates that a high is in place for wave (b) up, similar to the DOW chart above.
4:Our TNX chart for yields indicates further downside in wave II down, before wave III up.
The lower trendline is near the 1.8 area.
I wanted to provide an update on the equity markets since they have been in a very long process of topping in the parabolic advance, but with wave (2) up complete, the downside should continue to accelerate in wave (3) down, although we are expecting a small bounce on Tuesday Jan 19th.
I also have the Oct 2014 Crude chart above posted on the main page of the site, so I am just advising that the $30 forecast level on this chart is not the bottom. We still have further downside ahead for Crude, but we should also see a small bounce for Crude on Tuesday Jan 19th. We changed the count for Crude from the Elliott Wave abcde triangle pattern on the second chart back to a number of 1’s and two’s in the triangle pattern illustrated on the first chart.
This will be an interesting year with many long term trends changing.
Safe investments that are guaranteed will be critical.
These charts are only a guide so that you can follow the action and monitor the expected outcome. The action could play out exactly as illustrated or it may need minor adjustments as we follow it through.
If you are interested in viewing these updated charts and other detailed charts with targets on a daily basis, please see the registration details below.
Author: Dan Stinson
Take Care and Happy Trading!!!
Dan Stinson
Elliott Wave Chart Site
e-wavecharts.com

Special Report: Chinese Sunset
by A. Gary Shilling
Earlier in the week I asked my friend Gary Shilling if he could give me a summary of his 2016 forecast. He agreed to do so and sent it on. Then this morning he sent out a special short report on China that offers what I think is a valuable perspective that differs from what we’re seeing in the headlines – John Mauldin
 The Coming European Revolution…
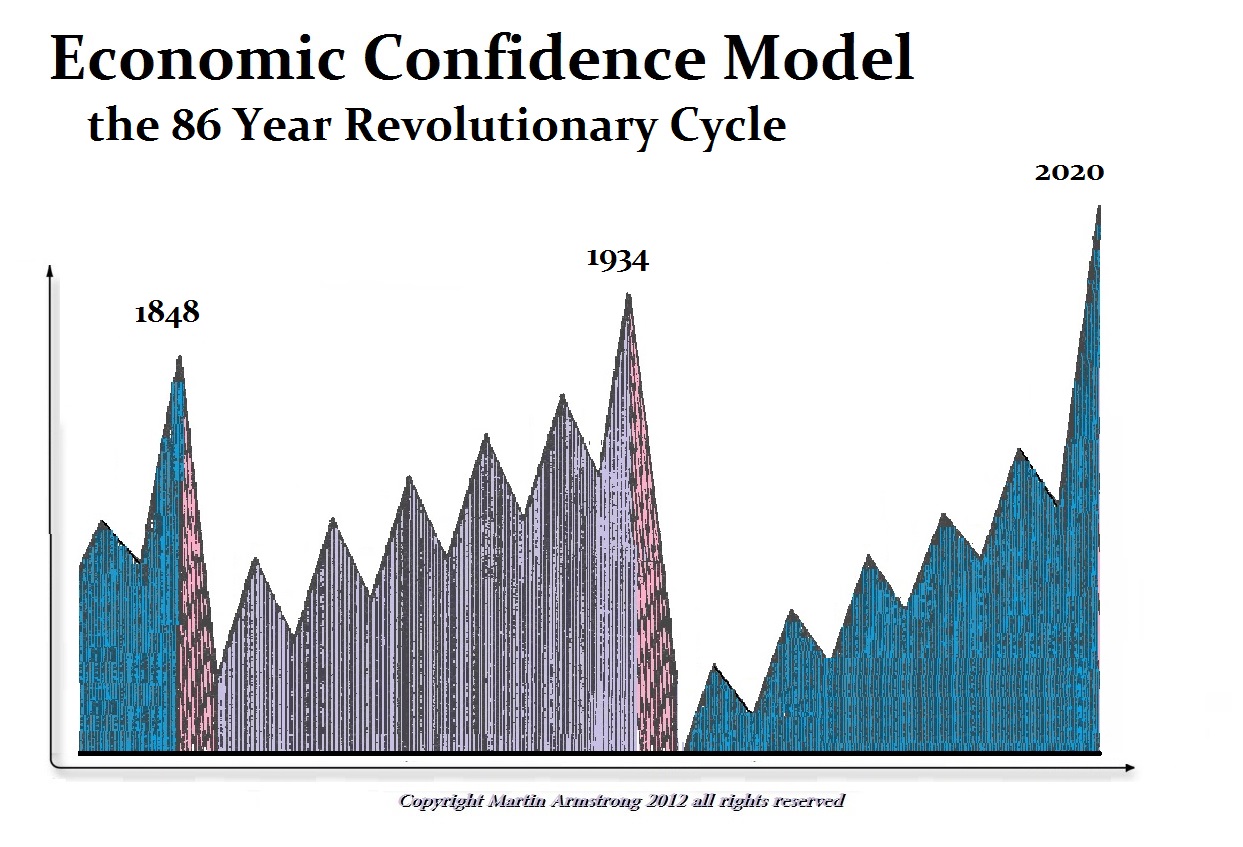
by Martin Armstrong
I have warned that 2017 will be the political year from hell. What I am illustrating here is the link between a sovereign debt crisis and the Revolutionary Cycle. In 1933, Roosevelt came to power in the USA and turned the country toward socialism. That same year, 1933, brought Hitler and Mao to power. So 1934 was the revolutionary year. Such revolutions do not always bring blood in the streets. The next one is due in 2020 and we should see the system we currently live under go completely upside-down.
Investing Lessons from the Farm
Expect Storms. Whether or not my father had a good year depended on three things: (1) no late frosts, (2) no early frosts, and (3) no natural disasters like hail storms, tornados, droughts, or massive insect infestations.
While you can’t avoid disasters, you can plan for them and run for cover when they do come. The wise investor diversifies in anticipation of those things that are beyond his control and buys insurance to protect against catastrophic losses.
The following is part of Pivotal Events that was published for our subscribers January 5, 2016.
Perspective
Is the setback a violent correction or is it the start of another severe contraction?
Likely both.
Let’s look to Mister Market and Mother Nature, who are really running the show. Central bankers and endless debates about miniscule changes in administered rates have been and will always be expensive distraction.
Historical market patterns and thorough technical research has been competent.
Last August’s hit to global financial markets was preceded by significant reversals in spreads and the curve. Ironically, not even the Fed can prevent such reversals. The one in June and the “breakout” in July ended excessive speculation in all of the hot games.
During December the curve flattened to new “lows” for the move and spreads accomplished another “breakout”. The latter was noted in our Special Memo of December 8th.
The Transports and the old Dow Theory anticipated the top of the general market (NYA) in May. At 7300 this week, the Transports have taken out the December low at 7361 and the August low of 7452. This is critical and if its prophetic nature continues this decline in the overall market could be more than a brief setback.
Stock Markets
The hit has very little to do with the Fed Rate increase or to the re-opening of large-account selling in China. If anything, these were catalysts. It has more to do with changes in credit markets that essentially started in June and became serious in July.
Out December 23rd Pivot concluded “Banks and Broker-Dealers remain elevated and are vulnerable.”
Going the other way, we have been looking for the “Rotation” trade as resource and material sectors bottom. This would likely be in the November-December window.
Base metal miners (XME) declined to 14.20 a couple of weeks ago. The bounce made it to 15.85 and it has slipped to 14.62. The best on last year’s Rotation was 29.
On the Oil Patch (XLE), the low has been 58.21 on December 21st. It was very oversold at 57 with the August hit. The rebound failed at the 50-Day at 71, and the index is back down to the 58 level. Essentially, this is the third test of the level.
Will it hold?
Doubtful, so positioning long can wait.
Last year’s trade made it to 81.76 on May 1st.
The financial sector has been vulnerable and is slipping.
BKX traded above the 200-Day ma through November and this week has dropped below the 200 and the 50-Day moving average. This also takes out the last low at 72 a few weeks ago. Support at the August hit low at 67 may not hold.
Essentially, XBD is in the same pattern.
Of interest, both financial indexes peaked in July and reversed as credit spreads broke out on the trend to widening.
Out of the Shanghai Crash the Advance/Decline line rebounded to a double top set in November and is breaking down.
Currencies
The November rally drove the Dollar Index (DX) to 70 on the Daily RSI. The high was 100.60 and the correction was to 97.21. Since then it has remained above the 50-Day ma, which is constructive. Rising above 99.35 would likely pop it to the key high at 100.60.
Some work there and it could march up to the 109 level. Let’s call it a target, which would be interesting.
The Canadian dollar is suffering a doctrinaire governor of the central bank. It will suffer the imposition of the extreme interventionist politics that has turned the formerly economically powerful Province of Ontario into a “have not” province.
Ontario has become even zanier than California.[1] And the prospect of the federal government becoming, well, hysterical about every political fad de jour suggests the Canadian dollar will continue down.
The decade of Conservative government was an attempt to return to limited government. Ironically, this was condemned as “austerity”.
Liberal compulsions tend not to just intrude they are expensive.
Federally, economic nihilism will be imposed until it is seen not to work.
[1] Ontario’s population is one/third of California’s but it carries twice the total debt burden. The Financial Post reports that Ontario is the “world’s most indebted sub-sovereign borrower.”
Link to January 8, 2016 Bob Hoye interview on TalkDigitalNetwork.com:https://www.youtube.com/watch?v=4HcZ-IogzjA&feature=youtu.be
Listen to the Bob Hoye Podcast every Friday afternoon at TalkDigitalNetwork.com

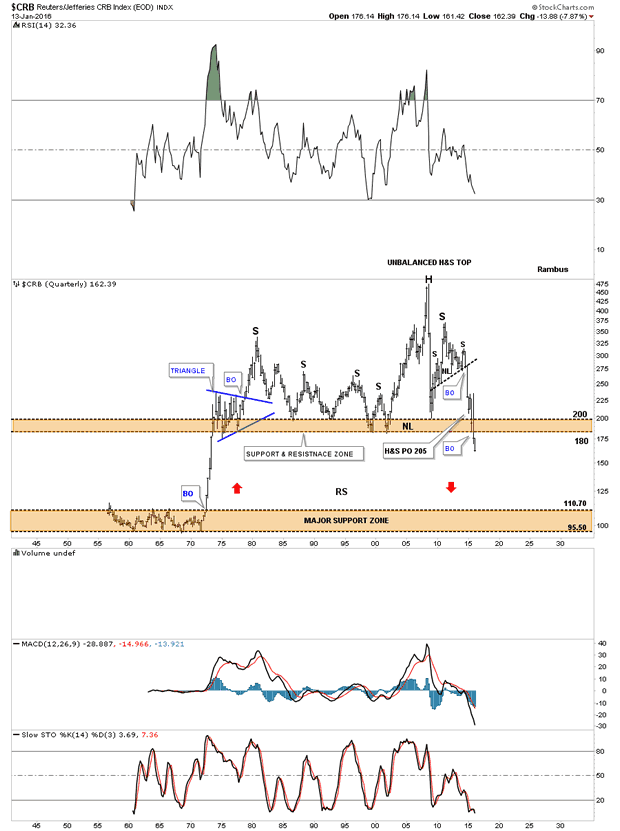
Excerpt from Tonight’s Wednesday Report
The implications of this 60 year quarterly chart for the CRB index is staggering if it completes this impulse move down which so far has been working out beautifully. Again on this massive time scale you can see an unbalanced H&S top that measures out to just below the major support zone at the bottom of the chart.
Back to the Future Indeed.
For some strange reason, most investors I talk to think the world is doing just fine. They say the U.S. economy is growing. They say Europe is not collapsing as so many experts have feared. That Canada is fine and that Australia, too, has a bright future. And that the Middle East and terrorism are to be expected, ever since 9/11.
And for most investors, China’s recent troubles are not surprising, nor should they harm the global economy.
Let me be perfectly clear: I totally disagree. The world is a mess, spiraling lower into what will prove to be the worst financial crisis and global depression since at least the 1930s.
I don’t say that lightly. Nor to scare you. I simply speak the truth. Nor am I a pessimist. For after we pass through this crisis over the next several years, I actually see a far better, brighter world and global economy than ever before.
But let’s open our eyes now, if they are not already, and take a look around the world at the major problems. There are oodles of them.
 Europe: Already technically in a depression based on GDP and unemployment. Sovereign debt to GDP at astronomical levels. Negative interest rates failing to stimulate economic growth. A record rise in anti-Semitism. Neo-Nazi groups gaining power.
Massive cultural rifts and splits developing between countries. Some due to the Syrian refugee crisis. Some due to old European conflicts brought back to the forefront due to the brain-dead euro experiment.
Catalonia ready to secede from Spain. Scotland preparing another attempt to secede from Great Britain. Northern Italy desiring to separate from southern Italy.
Spain, Portugal, Greece, Italy, even France — all technically bankrupt.
Capital controls now in place. Bail-ins now legal throughout the EU. Should a bank fail, you’re at risk of losing a major portion of your deposits.
Russia: Devastated by crashing oil prices and Western sanctions. GDP plunging 4.1% in the third quarter alone (latest available data). The Russian stock market down a whopping 32.6% just since last May. Down 65.5% since its 2011 peak.
China: Slowing, but still the brightest part of the world. Stock market panics scaring the pants off investors worldwide. The yuan, instead of strengthening as so many had expected, now sliding.
Southeast Asia: Slowing, but like China, very bright long-term. Stock markets falling. Currencies depreciating. Investors, nervous.
Latin America: Mexico, slowing. Argentina, a mess. Venezuela in shambles. Brazil’s GDP shrinking, its currency plummeting.
United States: Yes, brighter than all but China, but being propped up by capital inflows from abroad. Stock markets, fractured and vulnerable to collapse. Government bond market starting to implode. Deflation picking up steam. Unemployment figures, jerry-rigged. Real incomes, flat for nearly 15 years.
Some $18.87 trillion of official debt, equal to $59,100 for every man, woman and child. Total debt, household, business, state and local governments, financial institutions and the federal government: $64.57 TRILLION. Over $200,000 for every man, woman and child.
Total U.S. unfunded liabilities, not including any of the above: As much as another $200 trillion.
And all that is just surveying the obvious. For hidden beneath it all in at least three corners of the globe are broken governments, inept leaders, wasting decrepit bureaucracies, heavily socialist policies that will do nothing more than destroy modern civilization as we know it …
At least until the people of the world rise up, rebel and shout from the rooftops that they won’t take it anymore.
That time is coming and it will build in momentum over the next several years. You can see it right here in the U.S. where Donald Trump’s popularity is telling you — in no uncertain terms — that the American people are fed up with the status quo in Washington.
So what about the markets right now?
The worst start of a new year for the S&P 500 ever?
It’s a harbinger of what is to come this year. A rollercoaster ride through hell. Mark my words: This year will be as volatile and crazy as they come. As volatile as 2008 — 2009. Or 1987. Or the Panic of 1907.
Take your pick. We are on the cusp of the back wall of a giant, Category 5 hurricane and it’s going to be with us for years.
In last week’s column, I gave you three sneak peaks at what lies ahead for this year.
The most exciting one is already starting to come into place: A rolling thunder of bottoms and new bull markets in commodities.
An area where more money will be made in the next few years than any other asset class out there.
Stay tuned and stay safe,
Larry
P.S. We are on the cusp of the most profitable bull market of our lifetime. Stocks will be driven higher by powerful global undercurrents that Wall Street will either ignore or fail to understand. As the Dow doubles, some stocks will see explosive gains of 300%, 400%, 500% and more. Savvy investors who make the right moves will become very rich!
Click here for my free report and to find out how it could make you rich beyond your dreams.

-
I know Mike is a very solid investor and respect his opinions very much. So if he says pay attention to this or that - I will.
~ Dale G.
-
I've started managing my own investments so view Michael's site as a one-stop shop from which to get information and perspectives.
~ Dave E.
-
Michael offers easy reading, honest, common sense information that anyone can use in a practical manner.
~ der_al.
-
A sane voice in a scrambled investment world.
~ Ed R.
Inside Edge Pro Contributors

Greg Weldon

Josef Schachter

Tyler Bollhorn

Ryan Irvine

Paul Beattie

Martin Straith

Patrick Ceresna

Mark Leibovit

James Thorne

Victor Adair