
Timing & trends
 1. Michael for Prime Minister
I know there’s only a week left – but I’ve been watching and I really think I’m getting the hang of this political thing. I’ve even got a first draft of my campaign speech ready – and it goes like this….
2. Bob Hoye: “Precious On, Precious Off”
It is just one darned thing after another.
The September 17th ChartWorks called for gold to rally to 1145 to 1185 window. From the 1110 level the rise made it to 1156 on Thursday.
3. October Crashes, Collapses and Upheavals
“Is there a cycle — or combination of cycles — that, due to patterns deeply embedded in history, come together in the tenth month more often than mere chance would dictate?
Consider some of the most salient Octobers of the 20th and 21st centuries, and then make up your own mind”


Signs of The Times
The following headline is perhaps one of the most egregious policy statements in financial history.
“Bernanke: More execs should have gone to jail for causing the Great Recession.”
– USA Today, October 5.
If one’s research extends beyond the 1929 Bubble and collapse, the observation would be that every great financial mania has included bad dealings that are only revealed in the crash. Individual or corporate fraud may exist, but it does not cause the contraction. Typically, fraud is revealed in the bust.
Is Bernanke deliberately naïve?
Well, he is flogging a book.
Quite simply, every financial bubble ends with a compulsive surge in speculation. The over-extension of leverage can only be supported by rising prices. Without momentum the mania fails. All of the great bubbles suffered heavy liquidation in the fall of the year.
Bernanke has been considered to be today’s outstanding scholar of the last Great Depression. His writings indicate he is familiar with economic theories about the 1930s contraction, but knows little about the pattern in the curve and spreads going into the climax of 1929 or the five previous examples.
The Fed’s aggressive ease in the 1920s, the 1960s and radical ease of the last decade may not be criminal according to law. But is definitely criminal intrusion upon the workings of free markets. Although policymakers talk about “managing” the economy, the net result has been chronic currency depreciation. Purchasing power of the dollar has declined to only some 3 percent of what it was when the Fed began operations in 1914.
In our books, this is state theft. In Dante’s book, false money-ers are consigned to a certain place in hell.
In the meantime, a more temporal punishment would be constructive. No system, even a Federal Reserve, should be allowed to operate without constraint.
“Federal Reserve Vice Chairman Fischer said he doesn’t see immediate risks of financial bubbles in the U.S.”
.– Reuters, October 2.
The irony is that if the Fed identified a financial bubble, it would have to do something about it.
No central banker wants the responsibility of taking away the punch bowl. This leaves the responsibility to Mister Margin, who never shirks his duty.
A bubble in lower-grade US bonds peaked in June 2014. A bubble in the NYSE seems to have peaked in July. Upscale residential real estate is in a remarkable bubble. “JP Morgan Financing Los Angeles Mansions Starting At $115 million”
“Including several on a speculative basis.”
– Bloomberg, September 28.
Fischer must be intentionally behind the challenge of identifying bubbles.
*****
Perspective
Fortunately, a comprehensive review of upscale homes in Los Angeles was published in August by LA Curbed. We can’t help but wonder if “infinity pools” can provide appropriate perspective?
Here is the link for the article http://la.curbed.com/tags/spec-houses
We have said it before and will say it again: Like civilizations, great bull markets are born stoic and die epicurean.
Stock Markets
On the S&P, a rebound out of Black Monday would likely reach 100 on the CCI momentum. That was obtained at 2026 in the middle of September. Our target then became the low close on August 24th.
That was accomplished. The extreme low set on the bad day was 1867 and last week’s low was 1872. This was showing considerable pressures going into the release of an unemployment number. The number was so bad that it banished the prospect of the dreaded “Fed hike”. Massive short-covering followed.
Our view has been that such conjecture is a waste of time and pixels. Whatever happens, the Fed will be behind the action.
Technically, the key rally to the CCI 100 ended at close to the 50-Day ma. The latest jump has made it to just below the moving average.
Our July 7th call on banks and financials was that they were a “Widows and Orphans” short. The BKX high was 80.87 on July 23rd, the August 25th low was 67.80 and the rebound made it to 73.39, just below the 200-Day ma. The extreme low on Friday was 66.70.
For this year, the banks outperformed the S&P until July. Underperforming since. The decline in the BKX itself and relative to the general market is not oversold.
The overall market (NYA) is also not oversold. The extreme low on August 24th was 9509. Last week’s low was 9565 which was the test. The rebound has made it to 10156 and there is resistance at the 10250 to 10300 level.
Once the CCI momentum bounce was in the close on Black Monday became out target. This has been accomplished. The other probability was that the extreme low could be taken out.
How probable is this?
One guide has been the DX breaking out of its squeeze between the 50 and 200-Day moving averages. As of this week, it is breaking down, not up.
The other guide would be further widening of credit spreads. After reaching new “wides” for the move at 13.23 percent, the Junk spread has checked back to 13.05. The correction continues.
The probability of a seasonal low in October is now a near-term view.
Our “Friends of the bull market” kept us positive until around July.
We should have something equivalent to keep us cautious, on an intermediate basis.
Breaking below the 50-Week ma marked the end of the bull market in 2000 and 2007. Using this along with some other determinants, we marked the end of the Bull market on July 23rd. The initial intermediate decline completed some four months later. Four months from when the SPX took out the 50-Week counts out to around November.
An intermediate bottom could complete within the next six weeks.
Credit Markets
Usually, we don’t comment on employment numbers other than to note that the calculation behind the reported numbers seem wondrous.
At any rate, the one last week was interpreted to be unusually bad. Bad enough to defer any putative increase in the Fed rate. Big short squeeze in global stock markets, which coincided with credit spreads narrowing. For four days.
The Junk spread over Treasuries did the second big breakout on the way to 13.23% on October 2nd. Yesterday’s post was 12.70%. ETF spreads are widening a little today.
Whether in 2007 or 2008, the second big breakout on the cyclical reversal to widening is a negative for the stock market. The setup to this important phase of widening was accomplished in July.
Widening beyond 13.23% for Junk seems likely. On the BBB the worst was 242 bps, also set on Friday. At 234 bps now, through 242 bps seems likely.
The hit to the Pimco High Yield (PHDCX) price was from 9.93 in May to 8.93 in August. The bounce was to 8.99 and the October 2nd low was 8.60. At 8.80 yesterday, taking out the last low seems possible and would be a warning on further credit problems.
Long-dated Treasuries (TLT) rallied up to 126.21 on Friday and have trading around 123. This has been supported by the 50-Day ma, which is at 122.70. Taking it out is probable. There is support at 118.50.
Precious Metals
Last week’s quip about “Precious on, precious off” could do with some expansion.
Gold spiked down to 1072 on the week of July 25th, the week the S&P topped.
A “precious off” moment.
Gold’s real price bottomed between May and July and then soared to a sharp high on August 24th.
A “precious on” moment.
This “opposing” action is appropriate. Traditionally, the golds have done well during post-bubble contractions. Mainly because the real price and operating margins go up, as the pricing power of most industry and commerce decays.
The problem for the precious metals sector is that sharp setbacks to orthodox investments in stock, junk bonds and (shudder) commodities have been good for gold. But have forced gold equities down.
It is the way financial history works.
When will it work for the precious metals sector?
When the continuing increase in the real price has driven profitability to attractive levels. The rise into August drove the real price to a new high for the move that resumed in June 2014. However, the rise in the nominal price to over 1900 in 2011 prompted a lot of mal- investment.
These mistakes are being worked out and at some point the liquidation will end. Life in exploration “juniors” has been particularly hellish.
We have noted that every bear market in the sector is the worst you have ever been in. This is an impressionistic measure.
Anyhow, the “ancient miner” may have a new indicator of dismal. His exploration company has outstanding prospects, decades of experience and money. Younger guys with otherwise good companies are very discouraged. Discouraged to the point of wanting someone to take the company over – at any price.
When will the nightmare be over?
Every rally since the bear started in 2011 has been sharply up with lots of instantaneous enthusiasm. The last one popped out of December and stopped at the 50-Day ma. Also momentum on the silver/gold ratio got somewhat high.
This showed there were still a number of bulls all too willing to play the “Fed bad – dollar down – gold up” mantra. This hasn’t been working since 2011.
What we have been looking for on the re-entry is not a “V” bottom, but stability.
The key low for the GDX/GLD index was 120 on August 24th and the bounce made it to the 50-Day at 135. The next low was 122 and last week we noted that rising through the moving average would be a positive step. That was accomplished on Friday and the move continues.
The other way of monitoring stability is through the sector outperforming the S&P.
GDX/SPX had risen to barely above the 50-Day and needed further gains. Gains have been good this week as is getting above chart resistance at 75. It is now at 79 and the next resistance is at 82. The 200-Day ma is at 87 and represents a lot of resistance.
The latter is possible and could take some time.
Link to October 10, 2015 Bob Hoye interview on TalkDigitalNetwork.com:
http://talkdigitalnetwork.com/2015/10/credit-spreads-becoming-dramatic/
BOB HOYE, INSTITUTIONAL ADVISORS
E-MAIL bhoye.institutionaladvisors@telus.net
WEBSITE: www.institutionaladvisors.com

The stock market crashes were – alongside the devaluation of yuan – the most important recent developments in China. The stock market started rising during the summer of 2014, when the property market started to burst. The timing is no coincidence, as the government wanted to replace one bubble by another. By inflating (or at least cheerleading) the stock market bubble (by cutting interest rates and providing liquidity into the markets via the Pledged Supplementary Lending and Medium-Term Lending Facility, the Chinese version of quantitative easing both worth over the 2 trillion yuan), the Communist Party of China wanted to sell equity stakes of dangerously debt-burdened state enterprises and help clean up messy balance sheets, as well as to create a wealthy middle class, as a condition to move from exports/investment-led growth to domestic-consumption-led growth. Additionally, the start of the property market burst limited a viable investment opportunity for domestic investors, prompting them to reallocate their capital into the stock market. Consequently, China’s stock market surged more than 150 percent over the year, hitting a seven-year peak in the middle of June. Since then, mainly due to deleveraging, the Chinese stock prices have dropped nearly 40 percent (despite all government’s measures to prevent declines), culminating in a one-day drop of 8.5 percent on August 24 (the devaluation of the yuan has also added uncertainty to the stock market and triggered outflows from the stock market due to selling a yuan).
The Chinese stock market’s drop caused a decline in commodity and equity prices around the world, erasing $3 trillion in value from global stocks. The question is now whether China’s stock market’s burst spreads further into other markets and significantly affects the global economy and the gold market. Well, there are many arguments for saying that the burst of the stock market is less serious threat that the ongoing burst of the property market. Why? First, the PBOC and the regulators constantly pour liquidity into the markets. Second, the government launched a massive socialist-style rescue campaign and introduced many stock market regulations, limiting the potential decline. Third, the number of stock investors comprises less than 8 percent of the total Chinese population (while the home ownership rate is 90 percent). Fourth, the 0.03 percent of stock investors own 67 percent of the A-share market capitalization (A-share market combines shares traded in mainland China, which are available generally only to domestic investors). This means that the fate of the market depends not on the retail, non-educated investors, but on the bigger and smarter players. Fifth, the stock market is not the main channel to raise money in China. Equity funding is less than 5 percent of the total corporate financing pool (much lower than bonds and loans’ share) and it finances only about 2 percent of Chinese fixed asset investment. Sixth, stocks as a percentage of Chinese household financial assets amount to less than 15-20 percent (while real estate amounts to more than two-thirds of household wealth), so the declines should not significantly affect the real economy and consumption via the wealth effect (especially since the previous rally in the stock market did not trigger a boost in consumption indicating that gains remained largely unrealized).
However, it does not mean that the Chinese stock market’s performance is meaningless. Of course, the bust partially reflects the previous irrational exuberance not strongly tied to economic fundamentals, but the valuations of many companies rose due to the orgy of public spending and the real estate bubble. Therefore, China’s stock market crash should be viewed as a preview to the country’s coming crisis, when China’s credit and property bubbles will pop. This is why investors reacted so strongly to recent events in China – they could be a canary in a coal mine (usually, changes in stock markets reflect anticipated outcomes in the real economy) warning against the real crisis, which could potentially spark global contagion, and reminding global investors that stock markets all over the world are at unsustainable levels. During these times, valuations are so inflated for U.S. equity that the market is oversensitive to economic and financial news, therefore further declines in China’s stock market could trigger some chain reaction again, even if they are not a major cause for concern.
The chart below shows the performance of the Shanghai Exchange Market Composite Index and the price of gold. As one can see, there is no clear relationship between these two variables. Gold was gaining after the stock market crash in 2007-2008, however it was caused rather by weakness in the U.S. dollar and the U.S. stock markets. The current global economic situation seems to be more similar to the Asian/Russian crisis in 1997-1998 than to the Great Recession, so any potential gains due to safe-haven demand for gold may be capped by the upward pressure on the greenback.
Chart 1: The price of gold (London P.M. fix, red line, left scale) and Shanghai Stock Exchange Composite Index (green line, right scale) from 1997 to 2015
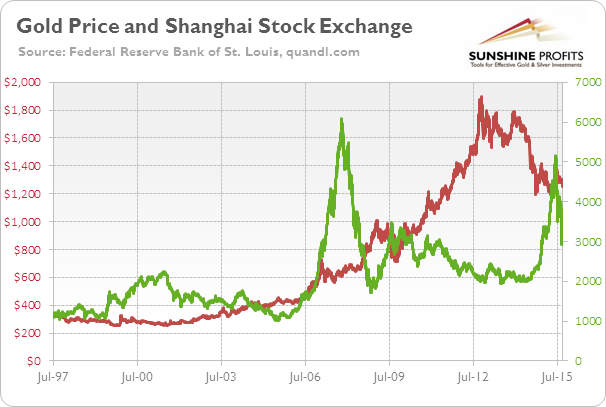
The key takeaway is that China’s stock market bubble came from developments in the property market, government meddling and irrational exuberance. The following crash is not likely to have major adverse consequences for China’s real economy, however it may be a preview of a coming crisis, which – given the current inflated valuations in global stock markets – may trigger some further bearish reactions. The bear market in stocks should be positive for the price of gold, however the appreciation of the U.S. dollar will likely exert downward pressure on the shiny metal. However, a lot “depends” and a lot “can change” in the meantime – we’ll keep monitoring the situation and describe the changes as they unfold.
If you enjoyed the above analysis and would you like to know more about the recent developments in China and their impact on the price of gold, we invite you to read the October Market Overview report. If you’re interested in the detailed price analysis and price projections with targets, we invite you to sign up for our Gold & Silver Trading Alerts. If you’re not ready to subscribe at this time, we invite you to sign up for our gold newsletter and stay up-to-date with our latest free articles. It’s free and you can unsubscribe anytime.
Thank you.
Arkadiusz Sieron
Sunshine Profits‘ Gold News Monitor and Market Overview Editor
Since we first exposed (and explained) the Black-sh Swan-link nature of the options market’s Skew Index, the mainstream media has lept to various conclusions (from ignore it, like everything else, to ‘wow’). However, what is crucial to comprehend is that the soaring Skew is occurring at the same time as a collapsing VIX.
And stunningly, what we have seen over the last two days is somewhat unprecedented – VIX has continued to collapse into option expiration (and we know the pattern that occurs after opex)

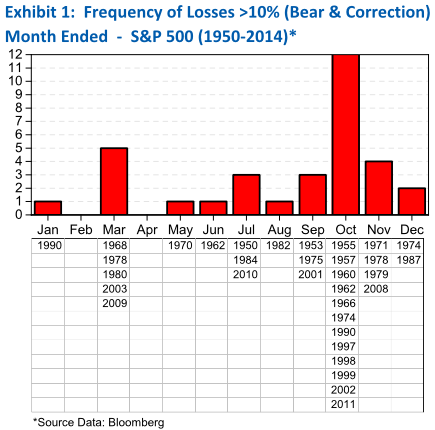
Correcon Could End in October
It is not a coincidence that the favorable six month cycle for stocks starts in late October (October 28th), and Octo- ber is the most frequent months for correcons and bear markets to be “killed,” and the stock market to rally. A cor- recon is defined as a decline of 10% to 19.9% and a bear market as a decline of 20%+.
Since 1950, the S&P 500 has had a total of 33 correcons of 10% or greater. Most of the declines were stopped in the second half of the year and by far, the most common month was October, which accounted for almost 1/3 of the correcons and bear market booms (Exhibit 1).
also:
October 2015 – Thackray Market Letter
The recent rally has been good, but getting past the old highs is going to be difficult.

-
I know Mike is a very solid investor and respect his opinions very much. So if he says pay attention to this or that - I will.
~ Dale G.
-
I've started managing my own investments so view Michael's site as a one-stop shop from which to get information and perspectives.
~ Dave E.
-
Michael offers easy reading, honest, common sense information that anyone can use in a practical manner.
~ der_al.
-
A sane voice in a scrambled investment world.
~ Ed R.
Inside Edge Pro Contributors

Greg Weldon

Josef Schachter

Tyler Bollhorn

Ryan Irvine

Paul Beattie

Martin Straith

Patrick Ceresna

Mark Leibovit

James Thorne

Victor Adair