
Timing & trends
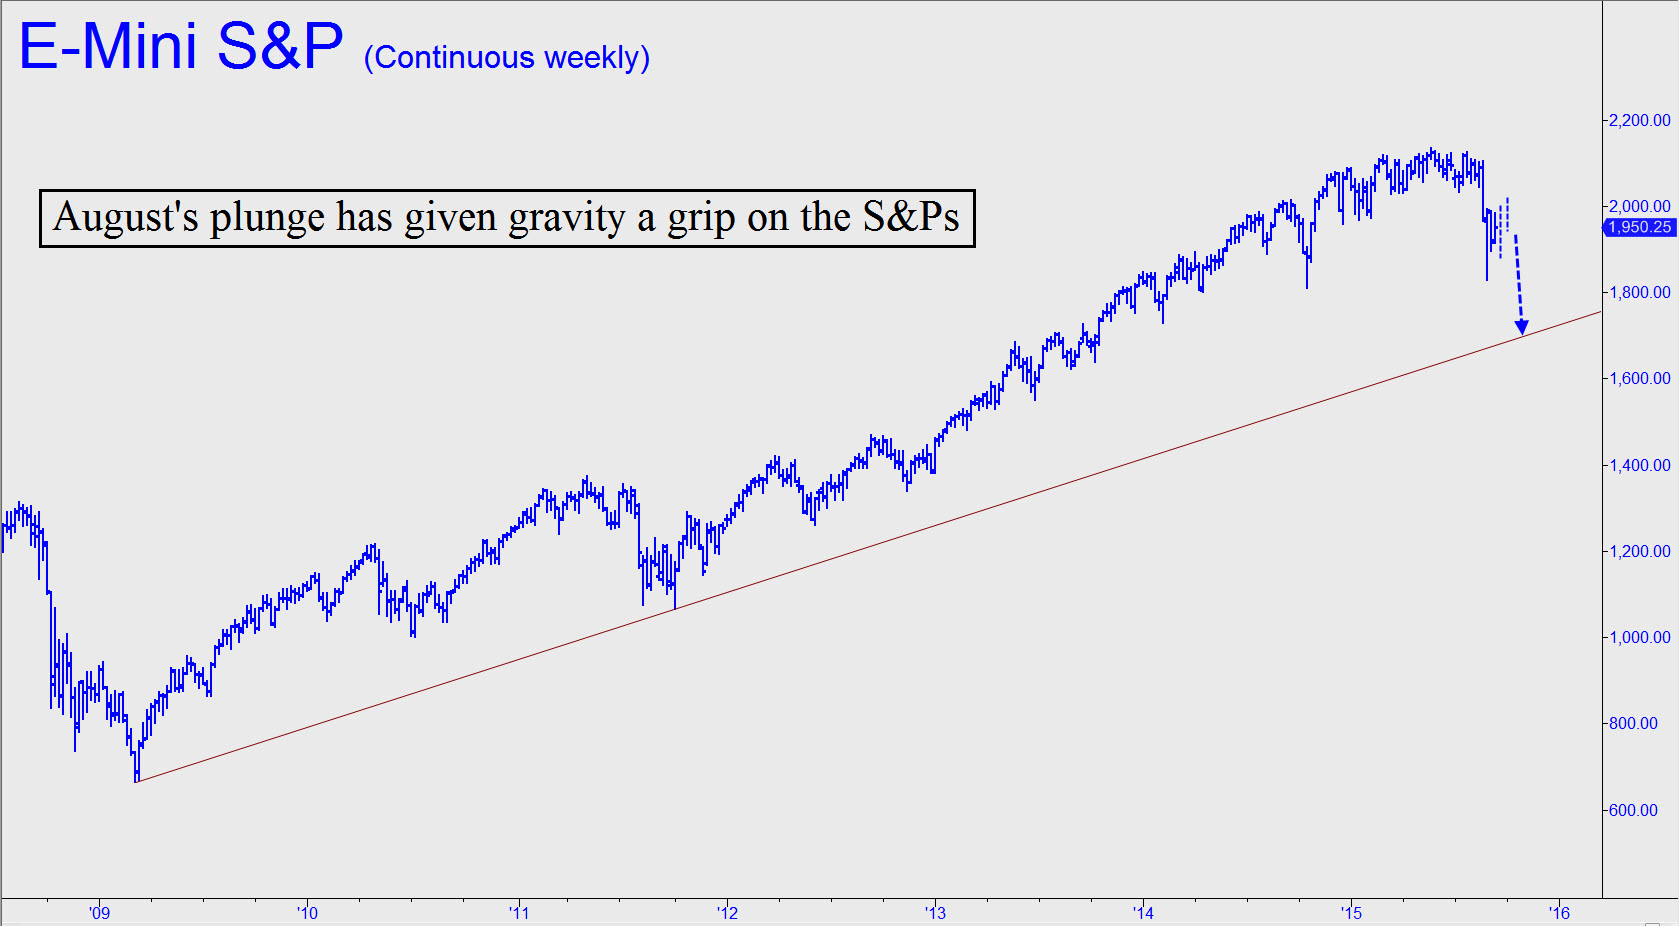
Take a good look at the long-term chart shown and let it liberate your imagination. It’s not difficult to see the force of gravity at work here, pulling the S&Ps toward a trendline that lies 250 points below. Notice how, when the futures swooned last autumn, the recovery was much steeper and swifter than the decline. Not this time. Three weeks into a bounce that has been punctuated by manic, fleeting short squeezes, stocks have yet to recoup even half of the losses suffered during the last two weeks of August.
It would seem that the “story” needed to drive a strong rally simply isn’t there. The Fed can’t loosen because rates are already near zero. China’s economy is weakening rather than strengthening, and Europe is now a full-blown basket case. Adding to this disquieting picture, America’s enemies have grown increasingly bold and seem now to be daring Obama, the weakest and most inept U.S. president in history, to do something about it. Not exactly a comforting picture. Under the circumstances, it seems safe to predict that the S&Ps will fall at least to the trendline shown, currently around 1700. If so, the Dow, now trading for 16433, would fall to 14000 — down 24% from May’s all time high of 18351.
And then what? Elliott Wavesters might say the chart leaves room for a Wave Five surge to new record highs. That would be hard to imagine, considering that the coming recession, or perhaps depression, will leave the U.S. and global economies in a state of smoldering ruin. Whatever happens, we should keep an open mind. First, though, we’ll look for the broad averages to complete the bearish cycle begun in August with a drop to the trendline. The implication is that any rally in the days or possibly weeks ahead is a gift to those looking to get short. Click here for a free two-week trial subscription to Rick’s Picks that will give you access not only to daily trading ‘touts’, bulletins, updates and impromptu trading sessions, as well as to a 24/7 chat room that draws veteran traders from around the world.

1. Buy Gold, Sell the S&P
by Gary Christenson – The Deviant Investor
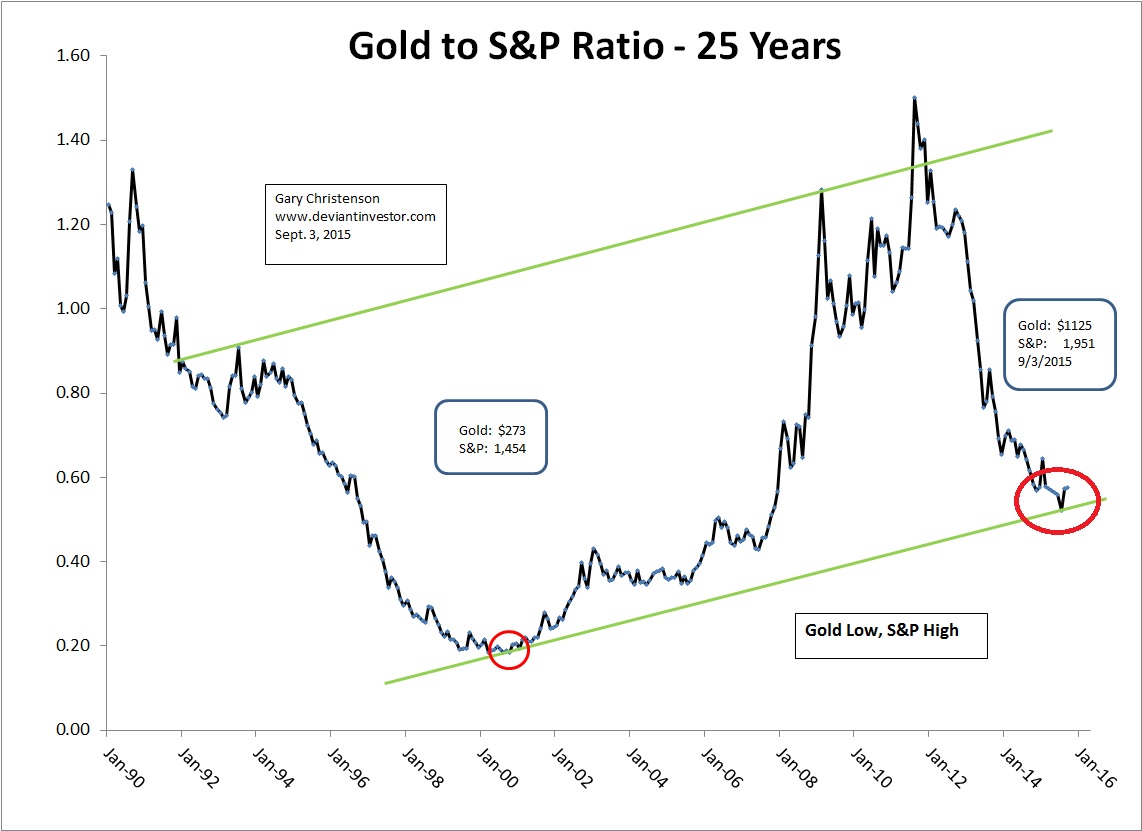
Buy low, sell high! As of today, September 3, 2015, the better choices are buying gold and selling the S&P 500 Index and relevant stocks.
Why?
Examine the graph of the ratio of Gold to S&P 500 Index for the past 25 years. The ratio is low now and likely will correct higher. I think gold will move higher and the S&P will move lower.
2. This only happens about once in a decade…
by Simon Black – Sovereign Man
“a once in a decade opportunity” that has to do with a deep flaw in our ability to properly assess risk.
3. World Waits With Bated Breath as Fed Gathering Looms
by Mike Larsen – Money and Markets
I’ve seen a lot of Federal Reserve meetings come and go in the 18 years I’ve been closely following the interest-rate markets. But few have been as momentous as the one that will begin next week on Sept. 16.

 We have seen access to capital for small and mid-cap companies swing around wildly with the volatility in the markets.
In the spring of this year, access was at its highest level it has been in many years – but only for the right companies. That criteria took a little time to shape itself but has become abundantly clear as the broader market faces volatility but certain companies are still able to successfully complete financings.
Market capitalization is often the driver of which companies can access equity capital and which cannot, especially in the Canadian institutional market. And that remains an important factor – certain institutional funds will not invest in companies under… CLICK to read the complete article
In the last 2 NFTRH editions, we noted extremely over bearish market sentiment conditions in Rydex bull/bear fund allocations and in Small Speculators’ net short positions. These sentiment indicators have been reset to traditional correction-ending, even bear market-ending levels. That’s the reality.
The latter especially, has been a reliable contrary indicator. Basically, the Small Specs have never been right at important market turns. For instance, they were heavily net short in the late 1990’s but by the time the market topped in 2000, they had covered and become net long. They have reliably been a contrary indicator all along the current bull market as well, going net short at each correction bottom, post 2009.
Add to this the Newsletter writer community, which has a vested interest in trend following and always looking right with the market. The latest Investors Intelligence data by way of Pension Partners and the Daily Shot email service shows that NL writers have quickly gotten right with the bear, and the fear.

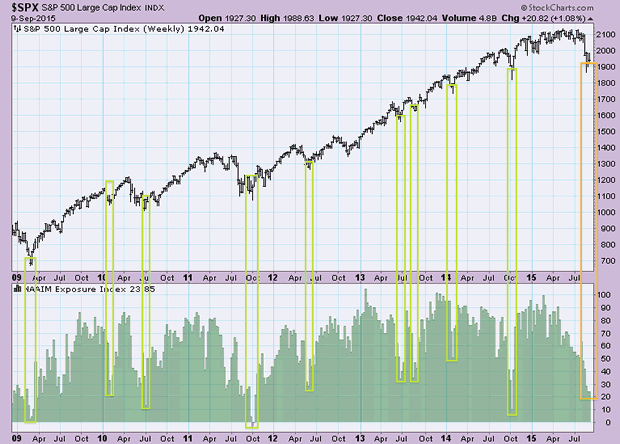
Another indicator is the NAAIM Investment Managers data. These managers sell down toward 70% to 100% cash at every market bottom. They are now at around 75% cash.
Of course, market sentiment is market sentiment, economic fundamentals are economic fundamentals, monetary policy is monetary policy and global pressures are what they are.
In other words, sentiment is a condition, not the be-all, end-all director in any short-term period. Just as the market floated for years with over bullish Investors Intelligence data for instance, the over bearish data now in play is a condition to future bullish events, but not necessarily a fine timing tool.
Subscribe to NFTRH Premium for your 25-35 page weekly report, interim updates and NFTRH+ chart and trade ideas, or the Free eLetter for an introduction to our work. Or simply keep up to date with plenty of public content at NFTRH.com and Biiwii.com. Oh, and follow @BiiwiiNFTRH.
China Deflation Fears Grow
 Bad news stories continue in China today with reports of more capital controls, devaluation fallout, and another drop in the Producer Price Index (PPI).
Reuters reports China Deflation Fears Grow as Producer Prices Sink Most in Six Years.
China’s manufacturers slashed prices at the fastest rate in six years in August as commodity prices fell and demand cooled, signaling stubborn deflation risks in the economy and adding to expectations for further stimulus measures.
The producer price index (PPI) fell 5.9 percent in August from the same period last year, its 42nd consecutive month of decline and the biggest drop since the depths of the global financial crisis in late 2009, data showed on Thursday.
Official and private factory surveys last week also showed manufacturers laid off workers at a faster rate last month as their order books shrank.
More Capital Controls
The Financial Rimes reports Beijing Clamps Down on Forex Deals to Stem Capital Flight
China has tightened its capital controls, in a sharp reversal of its market liberalising rhetoric, as it struggles to contain the fallout from last month’s devaluation of the renminbi.
The August 11 devaluation unleashed turmoil on global stock markets and policy confusion at home, forcing the central bank to spend up to $200bn to support the currency. The prospect of an interest rate rise in the US has further encouraged capital flight.
The Safe [State Administration of Foreign Exchange] has ordered banks and financial institutions to pay particular attention to the practice of over-invoicing exports, used to disguise large capital outflows. The administration confirmed the existence of the memo, but declined to comment further.
For the first time since it began internationalising its currency a few years ago, the central bank has also been intervening heavily in the offshore renminbi market to narrow the gap between the onshore (CNY) and offshore (CNH) exchange rates.
Analysts and people familiar with the matter say Beijing has spent up to $200bn defending the currency, but the net impact on the reserves is disguised by fluctuating valuations of reserve assets and other inflows into the reserves.
“They have gone from a credible peg that cost them almost nothing to a weak peg that nobody believes and that is costing them more than $10bn a day to defend. They’re paying huge sums for something they had for free just a few weeks ago,” said one person with close ties to China’s central bank.
In another move to lighten its burden of defending the currency, the central bank informed banks last week that it would soon impose a new 20 per cent reserve requirement on all currency forward positions, in a move aimed at reducing heavy speculation on continued renminbi devaluation.
All market participants will be required to deposit the equivalent of 20 per cent of their forwards book with the central bank for one year at zero interest.
This will considerably increase the cost of currency hedging for Chinese companies, which had a total of $1.2tn in outstanding foreign currency debt by the end of March and are widely expecting further devaluation in the renminbi.
Quite the Reversal
It was not that long ago that hedge funds had massive bets the value of the Yaun would rise. China even took steps to stop “hot money” from flowing into the country.
Hot money, and then some is now going the other way.
By the way, please recall all the inflationists telling China to stockpile copper, lead, and other commodities instead of holding US treasuries, frequently labeled “worthless certificates of confiscation”.
In retrospect, pro-cyclical stockpiling of commodities now looks foolish to nearly everyone. I took the other side of the argument at the time, as did Michael Pettis.

-
I know Mike is a very solid investor and respect his opinions very much. So if he says pay attention to this or that - I will.
~ Dale G.
-
I've started managing my own investments so view Michael's site as a one-stop shop from which to get information and perspectives.
~ Dave E.
-
Michael offers easy reading, honest, common sense information that anyone can use in a practical manner.
~ der_al.
-
A sane voice in a scrambled investment world.
~ Ed R.
Inside Edge Pro Contributors

Greg Weldon

Josef Schachter

Tyler Bollhorn

Ryan Irvine

Paul Beattie

Martin Straith

Patrick Ceresna

Mark Leibovit

James Thorne

Victor Adair