
Timing & trends

Here are today’s videos and charts (double click to enlarge):
Dow & Bonds Inflation Is Coming Video Analysis
Gold & Silver Volume, RSI, & MACD Video Analysis
GDXJ Outperforms GDX Again Video Analysis
Key Precious Metal Stocks To Buy & Sell Now Video Analysis
Here is a look at some key charts that I use in my swing trading service, including “DUST” and “NUGT”.
Key Swing Trades Video Analysis
Also, here are some additional precious metal sector stocks, with important price and volume action:
More Key Precious Metals Stocks Video Analysis
Thanks,
Morris
| Friday, Sep 4, 2015 Super Force Signals special offer for Money Talks Readers: Send an email to trading@superforcesignals.com and I’ll send you 3 of my next Super Force Surge Signals free of charge, as I send them to paid subscribers. Thank you! |
The SuperForce Proprietary SURGE index SIGNALS:
25 Surge Index Buy or 25 Surge Index Sell: Solid Power.
50 Surge Index Buy or 50 Surge Index Sell: Stronger Power.
75 Surge Index Buy or 75 Surge Index Sell: Maximum Power.
100 Surge Index Buy or 100 Surge Index Sell: “Over The Top” Power.
Stay alert for our surge signals, sent by email to subscribers, for both the daily charts on Super Force Signals at www.superforcesignals.com and for the 60 minute charts at www.superforce60.com
About Super Force Signals:
Our Surge Index Signals are created thru our proprietary blend of the highest quality technical analysis and many years of successful business building. We are two business owners with excellent synergy. We understand risk and reward. Our subscribers are generally successfully business owners, people like yourself with speculative funds, looking for serious management of your risk and reward in the market.
Frank Johnson: Executive Editor, Macro Risk Manager.
Morris Hubbartt: Chief Market Analyst, Trading Risk Specialist.
website: www.superforcesignals.com
email: trading@superforcesignals.com
email: trading@superforce60.com
SFS Web Services
1170 Bay Street, Suite #143
Toronto, Ontario, M5S 2B4
Canada

 Signs of The Times
Obviously, the rich harvest of headlines continues. It is worth adding that they only occur with the culmination of great financial manias. The problem is that each soaring bull market, sensational has become the norm. Stock pickers think that certain stocks and their ability to discover them are unassailable. On Business News Network, there was a fund manager boasting that while the Hang Seng index was down 20% his picks in Hong Kong were unchanged. The notion that outstanding management and the genius of the Fed are proof against major setbacks is so 1929.
It has been convenient for interventionist economics to assume that the central bank is the perfect instrument for imposing policy. In the early 1930s, most understood that the abilities of the Fed were overwhelmed by the fury of the crash. Most also understood that the boom caused the bust, which prompted the passing of the SEC and Glass-Steagall Acts. These were designed to prevent another bubble. So that there would never be another crash.
If one reviews the newspapers of the day one would read that when the Fed raised the discount rate to 6% in August 1929 it intended to tighten funds to Wall Street, but also intended to ease funds for Main Street. In the crash the NY Fed bought bonds out of the market to inject liquidity. It exceeded its authority by a factor of six. Early in 1930, a Fed official noted that they had met the crisis in the usual way by discounting liberally.
In the 1960s, as econometrics and computers ascended, intrusive economists needed the policy instrument to be perfect. Thus the argument that the guys at the Fed were deliberately tight and that caused the Great Depression.
How naïve.
Thanks to the permanency of the internet record, all of the reckless extension of Fed credit can never be buried. And now with the massive efforts made by Chinese policymakers so well publicized, the record of this massive failure will be permanently visible.
The 2007 Bubble and Crash generated some despicable policy utterances. One was that in December 2007 the establishment boasted that nothing could go wrong. The Fed had a “dream team” of economists. A crash was impossible and only two years later they were boasting that without the Fed’s magnificent efforts the crash would not have ended.
China’s recent contributions to official folly would include the following:
If in April, China had approved only 10 IPOs would the rally would have continued?
Policy intrusions, no matter how well rationalized, are mainly nonsense.
Our determinants for the peak in the SSEC needed another set of Upside Capitulations, hopefully accomplished in June ().
Commodities
Last week, we observed that the main commodity sectors, such as base metals and grains, were oversold. We wondered about the possibility of another “rotation” and decided against it.
Some commodities were oversold, but deterioration in the credit markets was getting concerning.
The key item this week is crude oil dropping to new lows and while getting oversold, in this market normal oversold may have little influence. Instead, we should look at recent seasonal forces. Over the past 15 years, there has been a tendency for crude to set serious lows in December to January.
Much the same holds for the gasoline contract.
Our view from last year remains and that is the popular notion that falling petroleum prices would help the consumers’ gas tank was not the issue. The issue was commodity price deflation.
And generally commodities remain weak, driving the DBC down to 15, which takes out the low of 16.71 set in April. All the “rotations” out of last December have been wiped out.
The cyclical peak was 32 set in April 2011, and the peak in 2008 was 45.
One of the features of the typical post-bubble condition is weakening commodities. Today’s pop to 15.18 seems tied to the setback in the DX. A relief rally that could be brief.
Lines in the Sand
In looking at the concerning issues over the weekend, on Monday the “Lines In The Sand” list was put together, as in “Hey!” through this level would mark a failure.
The most persuasive one would be the breakout on spread widening. Yesterday’s number was 220 bps, which is more than the breakout, it is becoming dramatic.
The next one would be the NYSE A/Ds taking out the last low. This was accomplished this morning. The decline is now longer than the one that completed last October. The chart follows.
Another would be the SPX taking out the 200-Day ma, which would be Step Two. Today is working on a big bar down, all of it below the key moving average.
Complacency has had remarkable popularity and showing change, the VIX has jumped from 10.88 to 17. Getting above the July high of 20 would formally end complacency.
On our Friends of The Bull Market, last week’s advice was that their shelf-life and guidance had expired.

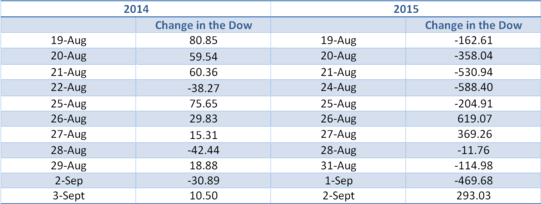
Twelve months ago the world was happily sailing along in the Great Moderation, with financial markets that moved gracefully higher most of the time but even in their rare negative moments didn’t cause too much angst. The eleven trading days leading up to September 3 saw not a single triple-digit move on the Dow, and only three down sessions.
What a difference a year makes. During the same eleven days in 2015 the Dow had exactly one single-digit close — and eight 200+ point sessions. Stomach-churning descents into the abyss are followed the next day by epic recoveries. The only thing moving in a straight line is volatility.
This is what the world looks like when things stop working. China’s well-oiled, top-down export machine turned out to be the mother of all Ponzi schemes. The Fed is tipping into the next crisis without reloading its interest rate bazooka. The US political process is suddenly interesting in the bad sense of that word. Brazil is not well-run after all. Japan’s Abenomics is appearing in headlines with the word “failure”.
The markets can’t figure out whom to trust — or indeed if anyone can be trusted. So money is sloshing around looking for a place to hide. One day it’s Treasuries, the next day blue chips or tech. But none turn out to be warm, dry and quiet, so the search continues.
If this sounds a lot like 2008 heading into the “one day away from martial law” Wall Street coup, that’s because in many respects that time and this one match up perfectly. All that’s missing from the present is a stock market crash.
The photo you see below was snapped recently in Beijing. It might not be that special to some readers, but in my 25 years of visiting the Chinese capital, I’ve never seen a blue sky because it’s always been blotted out by yellow smog. Beijing is clearly undergoing a transformation right now. This might please proponents of the green movement, but it’s ultimately harmful to the health of the manufacturing sector.

On the other hand, blue skies could be ahead for China’s service industries!
Misconception and exaggeration are circling China’s economy right now like a flock of hungry buzzards. If you listen only to the popular media, you might believe that the Asian giant is teetering on the brink of economic disaster, with the Shanghai Composite Index’s recent correction and devaluation of the renminbi held up as “proof.”
Don’t get me wrong. These events are indeed significant and have real consequences. They also make for some great, sensational headlines, as I discussed earlier this month.
But what gets hardly any coverage is that China’s economy is not weakening so much as it’s changing, like Beijing’s skies. Take a look at the following two charts, courtesy of BCA Research:
Wind Turbines 1980s: Admired

Oil Wells 1930s, California: No Longer Admired

Wind Turbines Recent: Greatly Admired

U.S. solar developers are luring cash at record rates from investors ranging from Warren Buffett to Google Inc. (GOOG) and KKR & Co. by offering returns on projects four times those available for Treasury securities.
Buffett’s Berkshire Hathaway Inc. (BRK/A) together with the biggest Internet search company, the private equity company and insurers MetLife Inc. (MET) and John Hancock Life Insurance Co. poured more than $500 million into renewable energy in the last year. That’s the most ever for companies outside the club of banks and specialist lenders that traditionally back solar energy, according to Bloomberg New Energy Finance data.
Wind Turbine Bird Kills:
In 2011 the Los Angeles Times reported such bird kills amounted to 440,000 annually.
Not Widely Published

Oil-Coated Birds:
Widely Published


Lenin Finally Topples
Pipeline Right Of Way, Pennsylvania:
Very unpopular

Permitted Way of Transporting Crude Oil

Train Wreck Alabama

Train Wreck February 2015: New, Stronger Oil Tanker Cars

“Crude oil hauled by rail needs to be shipped in stronger tanker cars and on safer routes, transportation investigators in the U.S. and Canada said following a series of accidents in North America.”
– Bloomberg, January 23, 2014.
Pipelines
2,500,000 Miles Can’t All Be Wrong

By way of perspective, the length of proposed Keystone pipeline amounts to 1,179 miles.
That works out to an increase in total mileage of 0.0047 percent.

-
I know Mike is a very solid investor and respect his opinions very much. So if he says pay attention to this or that - I will.
~ Dale G.
-
I've started managing my own investments so view Michael's site as a one-stop shop from which to get information and perspectives.
~ Dave E.
-
Michael offers easy reading, honest, common sense information that anyone can use in a practical manner.
~ der_al.
-
A sane voice in a scrambled investment world.
~ Ed R.
Inside Edge Pro Contributors

Greg Weldon

Josef Schachter

Tyler Bollhorn

Ryan Irvine

Paul Beattie

Martin Straith

Patrick Ceresna

Mark Leibovit

James Thorne

Victor Adair