
Timing & trends
 So far, the markets are generally positioning themselves for a turn at the end of September. The Dow has traded sideways since Thursday, trying to cling to the rebound. We need a closing today ABOVE 17007 to firm up the market, and a closing below 16632 will warn that the Dow is weak going into September.
Gold fizzled out quickly for we are in the middle of a flight to quality and that means people TRUST government debt. There is no fundamental safe-haven status for gold to rally under the current conditions. Here we would nee a closing above 1225, whereas a closing below 1168 keeps gold bearish.
The euro closing resistance stands at 11240. Here too, we are not in a position to take off to the moon.
It looks like this is the peak in government. Even Bernie Sanders is closing the gap with Hillary in Iowa. The Democrats hope for a landslide if Trump goes 3rd Party and the established Republicans fear Trump because he will not allow Boehner to control the party or Congress. So this time it appears our model is correct so far that this is the peak in government for this ECM turning point.
also from Martin:
Velocity of Money & Boom Bust Cycle

Sorry goldbugs, it is not the gold chart.
There are a lot of opinions out there on the US Dollar. Many of them are bearish in the short medium and long term time frames.
So lets see what the Charts are whispering.
With all the volatility this week in markets around the world the US dollar made an interesting move. The long term daily chart below shows the five point rectangle, at the bottom left hand side of the chart, that launched the big breakout and impulse move higher in May of 2014. If you look at reversal point #5 with a question mark on it you’ll see the comment I made at the time which I noted, this could be a false breakout to the downside and we might see a big move in the opposite direction, which was up. Keep in mind the chart was much bigger back then and the false breakout also looked much bigger. As you can see that indeed was a false breakout to the downside which led to the impulse move up we found ourselves in until the US dollar topped out earlier this year and has been building out the next consolidation pattern.
It’s still not completed yet but the consolidation pattern is taking on the formation of a triangle consolidation pattern. Right now I’m looking at the last dip below the bottom rail of the black triangle consolidation pattern as a possible false breakout which if that turns out to be the case then this triangle consolidation should be finishing up and we should expect a big move in the opposite direction of the false breakout, which would be up. Until the top rail is touched tho this possible fourth reversal point is still under construction with no confirmation yet that the triangle has completed its job of giving the US dollar time to consolidate that big impulse move up.

Below is a daily line chart which shows the three smaller consolidation patterns that made up the last impulse move higher to our most
recent high. Many times you will see at least three smaller consolation patterns form that make up a strong impulse leg. After you see the third small consolidation pattern form you generally know the end is getting near. The daily line chart shows the US dollar has some overhead resistance to contend with in the near term. If the bull’s are really in charge the US dollar will need to take out all the above overhead resistance, moving averages, small neckline and the top rail of the black triangle.

The monthly candlestick chart for the US dollar shows it massive base it broke out of. Note the string of white candlesticks all in a row which shows us how strong that first impulse leg up was. Now look at the candlesticks since the US dollar topped out earlier this year. You can see there are some white and back candles with the price action going nowhere which tells us the US dollar is still consolidating. Remember a big base leads to a big move which the US dollar has.

I have been watching the 40 year monthly chart for the US dollar , since we opened the doors here at Rambus Chartology, http://rambus1.com/?p=11237
This all important chart shows a massive falling wedge with the two big fractal bases, base #1 and base #2. The breakout from big base #1 shows a backtest to the the big base trendline well over a year later but it didn’t alter the inevitable outcome to its bull market top in 2000. Now note the current breakout from big base #2 which was more vertical than big base #1. Instead of getting a backtest to the big base #2 trendline we are getting the backtest to the top rail of the bullish falling wedge which we’ve been following ever since the US dollar broke out above it. The backtest to the top rail of the blue bullish falling wedge has been picture perfect which includes this months bar with a long tail. So far the breakout and backtest is exactly what we wanted to see. Sorry or the late Friday Night Charts. All the best…Rambus

Kim Jong Un Declares War as Armstrongs War Cycle Turns Up
First of all, this is not devaluation.The American government, IMF, me and others have said please let your market determine what happens to the currency. So finally the Chinese said okay and the Yuan went down 2% one day and 1% another day. But that is not devaluation.
 Making Sense Of The Sudden Market Plunge
Markets are quite possibly in crash mode right now, although events are unfolding so quickly – currency spikes, equity sell offs, emerging market routs and dislocations, and commodity declines – that it’s hard to tell for sure. However…..continue reading HERE

 The US stock markets just suffered an extraordinary plunge, shocking traders out of their complacency psychosis. This cast the foundational premise behind recent years’ incredible stock-market levitation into serious doubt. Traders are finally starting to question whether central banks can indeed manipulate stock markets higher indefinitely. Any wavering in this faith has very bearish implications for stock prices.
Less than two weeks ago, the US’s flagship S&P 500 stock index (SPX) was up above 2100. It finished August’s middle trading day just 1.3% below the latest record highs from late May. At the time, the Wall Street analysts were overwhelmingly bullish and saw nothing but clear sailing ahead. Predictions for the SPX ending this year above 2250 were ubiquitous, and retail investors were urged to aggressively buy stocks.
But warning signs abounded on fundamental, technical, and sentimental fronts as I’ve discussed in our newsletters extensively. The US stock markets were radically overvalued relative to historical norms in trailing-twelve-month price-to-earnings-ratio terms. As the SPX left July, its 500 elite components had a simple-average trailing P/E of 25.6x! That was nearing 28x bubble territory, far above the 14x historical average.
Stock-market technicals were incredibly overextended too. By the SPX’s peak in late May, this massive broad-market index had powered higher for 3.6 years without any correction-magnitude selloffs. In normal bull markets, these 10%+ selloffs happen about once a year on average. They are healthy and necessary to rebalance sentiment. The longer since the last major selloff, the greater the odds for the next one.
And without normal corrections to bleed away excessive greed periodically, it was really getting extreme. The VIX S&P 500 implied-volatility index has long been the definitive fear gauge. And it had spent the month between mid-July and mid-August averaging just 12.9 on close. That showed American stock traders feared nothing, they were exceptionally complacent and full of hubris. Mounting selloff risks were ignored.
Yet these very conditions were perfect for spawning a selloff, as all students of the markets know. The only reason it took so long to arrive was traders’ fanatical faith in central banks to keep acting to boost stock prices. Traders believe central-bank easing has the power to eradicate normal stock-market cycles. While market history shatters this myth of central-bank omnipotency, it is universally assumed today.
The US Federal Reserve birthed and then carefully nurtured this notion. Back in December 2008 the Fed implemented its zero-interest-rate policy in response to that year’s once-in-a-century stock panic. It was promised to be a temporary measure. After that the Fed started conjuring new dollars out of thin air to buy trillions of dollars of bonds, outright debt monetizationpleasantly euphemized as quantitative easing.
While the first and second QE campaigns had preset sizes and end dates determined at launch, the Fed radically shifted its modus operandi for the third campaign. Spun up to full speed in early 2013, QE3 was open-ended. The Fed deftly used this ambiguity to entice and badger capital into stocks. Whenever the stock markets threatened to fall, Fed officials rushed to hint that they could ramp QE3 to arrest the selling.
The result was the extraordinary stock-market levitation since early 2013. With the Federal Reserve’s implicit promises to backstop stocks, traders flooded in with reckless abandon. Every minor selloff was quickly met with aggressive buy-the-dip purchases, usually on some strategically-timed comment by a top Fed official. Near every major SPX low, Fed officials goosed stocks by arguing QE3 could be expanded.
So traders ignored the entire highly-cyclical history of the stock markets to keep on bidding them higher in recent years. Without any material selloffs thanks to Fed jawboning, complacency and greed quickly ballooned to dangerous extremes. Leading the way were countless hundreds of billions of dollars in corporate stock buybacks, largely financed through cheap borrowing courtesy of the Fed’s zero-bound rates.
But something had to give, as the stock markets are forever cyclical. Not even the central banks’ printing presses can eradicate the greed and fear in traders’ hearts, and those emotions are what ultimately drive market cycles. Traders wax too greedy and bid stock prices way above fundamentally-righteous levels, leading to subsequent major selloffs. Then traders fearfully run for the exits, leaving stocks too cheap.
Earlier this summer, the failure of China’s popular speculative mania should have irreparably damaged the omnipotent-central-bank myth. China’s central bank had engineered an extreme stock-market rally through exquisitely-timed rate cuts. China’s flagship Shanghai Composite stock index had soared an astounding 110.8% higher in less than 7 months by early June! Most traders thought that rally was unassailable.
There is no government in the whole world with more power over its local economy than China’s. So its government-nurtured stock-market bubble was the ultimate test of the all-powerful-central-bank thesis. And despite extreme and unprecedented efforts to manipulate stocks higher, the Shanghai Composite still plummeted by 32.1% in less than a month as greed turned to fear when that stock bubble popped.
Since history has proven countless times that central banks can only temporarily delay stock-market cycles, never eliminate them, we bet against that Chinese stock bubble before it popped. We bought and recommended puts trades on the leading Chinese-stock ETF, and our subscribers soon realized profits averaging +137% in just several months. Central banks can’t manipulate stock prices for long.
Yet amazingly, the Fed-deluded American traders ignored the sobering example of China’s gross failure of central-planned stock markets. They still clung to their zealous faith in the American central bank’s magical ability to levitate stock markets indefinitely. This was foolish, as I’ve argued many times in the past couple years. Artificially delaying selloffs makes markets feel less risky, but greatly amplifies risks in reality.
My favorite analogy of the risks of central-bank stock-market manipulation is wildfires. However noble governments’ intentions, when they send firefighters to quickly extinguish small wildfires that just lets underbrush flourish unchecked. Sooner or later there is so much dry fuel laying around that some small wildfire quickly mushrooms into a hellfire conflagration. Suppressing small fires guarantees far bigger ones later!
The same is true of suppressing normal and healthy stock-market selloffs. Those firefighting efforts by the central banks enable dangerous levels of sentimental and technical underbrush to choke off the stock markets. Then it’s only a matter of time until the right spark arrives, and the whole fuel-rich mess flashes into intense and uncontrollable flames. These dwarf central-bank printing presses’ ability to help.
The Fed’s extreme selloff-suppression efforts fueled one of the most extraordinary stock-market runs in history in recent years. While no one could know in advance when the catalyst would arrive to ignite all that epic complacency, it emerged out of the blue with no warning just a week ago. And even the initial resulting devastation is incredible, as this Fed-levitation-era chart of the VIX and leading SPY S&P 500 ETF shows.
While the Fed formally launched QE3 in September 2012 just in time to sway the national elections in Democrats’ favor, it didn’t ramp to full steam to include direct monetizations of US Treasuries until a few months later in December. That’s when the surreal QE3-stock-market era started. Between late December 2012 and May 2015, that dominant SPY SPDR S&P 500 ETF tracking that index soared 52.5%!
But that extreme straight-up stock-market advance was always unnatural. It improbably began late in a maturing cyclical bull when stock prices were already high and overvalued. And it continued powering higher with nothing approaching a correction. Every time the stock markets started to dip, Fed officials would quickly step up to the microphones to assure traders they were ready to ease more if necessary.
Most of those proto-selloffs were artificially stunted before they even hit the 4% pullback threshold. The only one that even threatened a correction-magnitude 10%+ came in October 2014. That heavy selling started accelerated on poor European economic data, and SPY ultimately dropped 7.7% in 20 trading days. But that selloff ended on Fed jawboning and a parallel surprise European Central Bank easing.
But even in that only significant selling episode of the Fed’s entire stock-market levitation, it never got bad enough to generate enough fear to eradicate excessive greed. The highest VIX close in that whole episode was just 25.5. While that’s certainly elevated, it was nowhere near high enough to indicate serious fear. So the extreme complacency and hubris of 2013 and 2014 spilled into this year as well.
But the Fed-goosed stock markets were running out of steam as tinder-dry sentiment underbrush grew wild. By early March the SPX was up near 2120, levels that would still barely be exceeded by late May. Not even uber-dove Janet Yellen’s most-easy Federal Reserve ever seen could manage to stoke new buying. The writing was on the wall, and any shift in Fed policy was a major risk as I warned in mid-June.
It hadn’t just been the 2.4 years of the Fed’s SPX levitation by its latest record highs in late May where the US stock markets hadn’t experienced a normal correction, but a whopping 3.6 years! The last one came in summer 2011 just after the Fed ended its earlier QE2 debt-monetization campaign. And not surprisingly in stock markets at price levels that are almost entirely a Fed-conjured fiction, the Fed dispelled it.
On Wednesday August 19th, the minutes from the Fed’s latest Federal Open Market Committee meeting held at the end of July were due out. They were super-important because they offered the last glimpse into Fed officials’ thought processes and internal debates before the FOMC’s next meeting. It is coming on September 17th, and has long been assumed to be the highest-probability target for rate hikes to start.
This is a huge deal since the Fed hasn’t raised interest rates a single time in 9.2 years, since June 2006. And the Fed has never, ever attempted to tighten after a prolonged ZIRP episode. So the coming rate hikes are wildly unprecedented. The release of those FOMC minutes was botched when Bloomberg accidentally broke an embargo nearly a half-hour early. And stock traders didn’t like what they saw.
There was nothing in those latest FOMC minutes to dispel the growing fears that the Fed was ready to start its next rate-hike cycle at its next mid-September meeting. Since the entire stock-market levitation since early 2013 was fueled by epic Fed easing and the resulting extreme corporate stock buybacks, this cast serious doubts on this extraordinary stock rally’s longevity. So stock traders started to drift to the exits.
The SPX retreated 0.8% that FOMC-minutes day last Wednesday, which was no big deal. But the Fed worries really intensified on Thursday. Traders couldn’t figure out if they were more worried about the Fed hiking rates in September, or not hiking rates in September. The latter scenario would mean the US central bankers still perceive the US economy as too weak to withstand even a trivial quarter-point rate hike.
So the stock selling escalated, pummeling the SPX down 2.1% to close at its lows. This shattered its 200dma, which had been major support for the Fed’s entire SPX levitation as the SPY chart above shows. It also dragged the SPX to a new post-topping low of 2036. That formally forced the US stock markets into pullback territory with a 4.5% drop since late May. But the selling pressure sure wasn’t over yet.
Complacency had become so extreme that there was choking underbrush for that wildfire to feed on. Last Friday, some weak Chinese factory data amplified long-festering fears of a global slowdown. So American stock traders’ selling started getting frantic, pummeling the SPX 3.2% lower. That was its biggest down day in 3.8 years, since November 2011. The SPX’s total pullback had ballooned to 7.5%.
This not only rivaled that previous-largest-of-Fed-levitation October 2014 pullback, but the VIX closing at 28.0 was the highest levels of fear seen since December 2011. In other words, American stock traders had not been so scared for the Fed’s entire SPX levitation since early 2013! The Fed’s endless selloff-suppression efforts had finally failed, the wildfire of cascading selling was starting to rage out of control.
Coddled stock traders aren’t used to serious selloffs, and had a whole weekend to stew over the SPX being back at levels first seen in July 2014. An entire year’s progress had been erased in just two trading days! So they came back this past Monday morning ready to sell and get the heck out of Dodge. An exacerbating factor emerged in China, the further failure of the omnipotent-central-bank thesis.
Since China’s stock markets had collapsed back down near their initial post-bubble lows of early July, local traders expected the People’s Bank of China to again ride to the rescue over the weekend with a rate cut. But the PBoC failed to act, so the Shanghai Composite plummeted an astounding 8.5% on Monday! It was down a staggering 37.9% in just 10 weeks. This heavy selling soon spilled into Europe.
Germany’s flagship DAX stock index plummeted 4.7% that day, and France’s CAC 40 was even worse with a 5.4% loss. So SPX futures just collapsed as the globe spun back to the US, falling over 100 points. The financial media was calling it “Black Monday” that morning, although this selloff was nothing like October 1987’s real Black Monday that saw the SPX crash 20.5% in a single trading day.
Still the SPX plunged another 3.9% on Monday, taking its total post-topping selloff to 11.2% which was well into 10% correction territory. After a 3.6-year Fed-induced delay, the long-overdue correction has finally arrived. The heavy selling continued on Tuesday, where early-day short-covering gains rolled over into a 1.4% closing loss on heavy mutual-fund redemptions and margin calls. The selloff was brutal.
While the SPX was down 12.4% since late May, it had plummeted 10.2% in just 4 trading days straddling last weekend! This wasn’t crash-magnitude, which requires 20% in a couple trading days, but was challenging stock-panic levels which is 20% over a couple of weeks. The Fed’s surreal stock-market levitation of recent years was finally failing. Real fear was back, with the VIX soaring to a 40.1 close on Monday.
Although no one could predict such a catastrophic failure of the Fed’s SPX levitation, the odds certainly favored a serious selloff. We were prepared with SPY puts, bets that the SPX was due for a material drop. We liquidated some tranches of these Tuesday for average realized gains for our subscribers of +150%! It pays big to be contrarians when everyone is convinced some manipulated market trend will run forever.
While such an extreme selloff guaranteed a powerful oversold bounce on short covering, the critical question is what happens after that? It was the illusion of central-bank omnipotency, that the Fed can boost stock markets indefinitely, that pushed the SPX so high in the past couple years. With rate hikes inexorably nearing, and the stock markets cracking, odds are that blind faith in the Fed is crumbling.
And that has super-bearish implications. The stock markets are forever cyclical, bears inevitably follow bulls. This next chart zooms out to show the entire stock-market bull in SPY terms since early 2009. If a new bear is indeed looming on the first Fed tightening in over 9 years, the downside from here remains enormous. Today’s central-bank-coddled investors aren’t ready to face the unyielding fury of a real bear.

This amazing cyclical stock bull was righteous and on a normal trajectory until late 2012, when the Fed launched its wildly-unprecedented open-ended QE3 campaign. That sparked the decoupling that resulted in the Fed’s incredible stock-market levitation. Virtually everything since 2013 is just a Fed-conjured illusion, and there’s going to be hell to pay as these artificial stock-market extremes inevitably reverse.
Since it’s been a record span since the last correction, today’s isn’t likely to prove mild at just over 10%. There are vast amounts of complacency underbrush to burn, incredible bastions of greed for fear to bleed away. So even if this exceptionally long-in-the-tooth and outsized stock bull is still miraculously alive as stock traders desperately hope, a full-blown correction approaching 20% is almost certainly required.
That would drag the SPX back down to levels first seen in mid-2013, wiping out the past couple years’ extraordinary gains. But odds are the selling won’t stop there. Today’s stock markets are not only wildly overvalued and overextended, but today’s spoiled-rotten-by-the-Fed traders would likely freak out with years of gains vaporized. Once a selloff crosses the 20% threshold, it formally becomes a new bear market.
Bear markets tend to be symmetrical with preceding bulls, the larger the bull the larger the subsequent bear. And after one of the biggest bull markets in history thanks to the Fed’s gross manipulations, the reckoning isn’t going to be small. Even at a 50% bear over the next couple years, which is merely average in terms of cyclical-bear size, the damage that would be done to the stock markets is breathtaking.
A full 50% cyclical bear would drag the SPX all the way back down to levels first seen in late 2009! That would destroy all vestiges of bullish stock-market psychology, and drag stock prices back to undervalued levels relative to trailing earnings. And that’s exactly what stock bears exist to accomplish. Bulls leave the stock markets overvalued and greed extreme, then bears follow to maul away the resulting excesses.
And contrary to the Fed-inspired myth today that stock bears are rare, they certainly aren’t. While we’ve yet to see a stock bear this decade, the 2000s saw no fewer than two! After seeing similar overvalued and overextended stock-market conditions to this summer’s, the SPX suffered a 49.1% bear market over 2.6 years ending in October 2002 and a second 56.8% cyclical bear over 1.4 years ending in March 2009.
This past week’s extreme stock selloff was exceptional. Apparently there’ve only been 8 times since 1980 where the S&P 500 has suffered consecutive 3%+ down days! It’s hard to imagine such an extreme selloff not severely damaging traders’ faith in central-bank omnipotency. This coupled with the Fed’s coming rate-hike cycle is almost certain to spawn a new bear market given the topping conditions leading into it.
But the extreme selloff this past week is nothing like bear markets, which are slow and methodical. A typical bear lasts a couple years, which encompasses about 500 trading days. To get to a 50% total decline over that time requires an average daily loss of just 0.1%, nothing. By unfolding slowly, bears work to trap bulls into staying fully invested for as long as possible without realizing the grave danger they’re in.
And if the overdue next cyclical bear is indeed upon us, it’s rarely been more important to cultivate a studied contrarian perspective on these markets. That’s our specialty at Zeal. We’ve spent decades studying market cycles, and understand how to thrive in bears with investments moving counter to stock markets. Since 2001 including those last two bear markets, all 700 stock trades recommended in our newsletters have averaged annualized realized gains of +21.3%!
We share our ongoing trading strategies and specific stock recommendations in our acclaimed weekly and monthly newsletters for contrarian speculators and investors. They draw on our exceptional market experience, knowledge, and wisdom to explain what’s going on in the markets, why, and how to trade them with specific stocks. With big changes afoot, you ought to subscribe today! Time is running out on our 33%-off sale.
The bottom line is the Fed’s extraordinary stock-market levitation of the past couple years is failing. The stock markets plummeted this past week after the Fed offered no clues that it was delaying its upcoming rate-hike cycle any longer. That selling quickly cascaded, greatly damaging traders’ faith in that myth that central banks can artificially manipulate stock markets higher indefinitely. This has very bearish implications.
If the Fed can no longer suppress stock-market cycles, the next cyclical bear market is overdue to charge in with a vengeance. And it’s likely to be an exceptionally large one following such an outsized cyclical bull. Bear markets see average declines near 50% over a couple years or so, which serve to maul stock prices back in line with underlying earnings fundamentals. That’s going to crush Fed-coddled stock traders.
Adam Hamilton, CPA
August 28, 2015
So how can you profit from this information? We publish an acclaimed monthly newsletter, Zeal Intelligence, that details exactly what we are doing in terms of actual stock and options trading based on all the lessons we have learned in our market research.
Stock Markets
Considering all of the Fed stimulus and eternal deferral of the dreaded rate hike, action on the NYSE is not responding according to the recipe of asset inflation. Chronic accommodation is now about as effective as catnip on an 18-year old housecat. This article was published for our subscribers August 20, 2015)(
The first bull market out of the Crash has ended in Shanghai and, quite likely, its bear has begun. On the way up it was following the explosive blow-offs as recorded by gold in 1980, the Nikkei in 1989, etc. It is following the “model” on the way down.
As the SSEC peaked in June, the next significant plunge would likely occur in the fall. This is the pattern on all of the great bubbles since the first one that completed in June 1720.
Not seeing any better-fitting pattern, we’ve used it to consider that some hot sectors in NY would reach speculative highs at “around” June. The senior indexes could be choppy during the summer, with the ultimate rally expiring in early September.
The basic theme is that once Shanghai completed, its failure would feed into the older financial capitals.
The conduit would be the course of credit spreads as through the fateful summers of 1998 (LTCM), 2007 (start of the contraction) and 2008 (you know what).
The most recent step on the path would be credit spreads breaking out in the first part of August. The worst with the crude oil panic was 213 bps in January. Wednesday’s number was 220 bps which is a significant breakout.
Widening could soon become dramatic. In which case, all of the King’s horses, all of the King’s men and all of the King’s central bankers will be unable to prevent the financial collapse.
The term “King” is deliberately used to imply the Divine Right of Bureaucrats.
Sector Comment:
Banks (BKX) don’t make big momentum peaks, but in 2007 their high did lead the SPX by a number of months. We published our “Widows and Orphans” sell on Wells Fargo on July 7th. It had accomplished the best rally and momentum in the sector. The study noted that as with the same advice in June 1998, it could take a couple of months to become effective.
BKX set its high in July, which was assisted by curve-steepening that ran from January to late June. The curve has been attempting to reverse.
Canadian banks set their high in April-May. RY declined from C$80 to 73 and bounced to 77. The slide to 74 is keeping the action below both the 50 and 200-Day moving averages.
It looks like the Canadian banks topped as the “rotation” for commodities completed in May. The sector is vulnerable to further weakening of commodities as well as deteriorating credit markets.
Broker-Dealers (XBD) may have had more fun in rallying from the key low of 74 in 2012. That was with that European crisis and it has been blase about the recent one. As noted in June, XBD had generated an RSI higher than reached in 2007. Of interest is that the 2007 high was set in June. This time around the June high was 202.98 and the high in July was 203.22. A false breakout.
The key in the 2007 failure was taking out the 50-Day ma in late June (Step One) and the 200- Day was taken out in late July.
This time around, Step One was accomplished in late June and Step Two (the 200-Day) was achieved yesterday.
Credit Markets
As noted above, US credit-spread widening has accomplished the critical breakout on the way to trouble. This changes the August (??) to August and is reviewed in the attached chart.
The rally in long Treasuries worked out. Our latest target was 123 on the TLT and it made it to 125.71 last Wednesday. As noted last week, this accomplished a good swing in the RSI and had generated a “Sequential Sell” pattern. Traders were advised to flatten positions.
Municipals (MUB) have been trading with the TLT and accomplished a similar swing in momentum. The Sequential Sell (now with a Springboard Sell) on TLT could apply to the municipal bond market, which is becoming increasingly vulnerable to another round of defaults.
JNK rallied out of the year-end disaster from 37.26 to 39.65 in April. The decline to 37 yesterday has taken out the “disaster” low. The Weekly RSI is down to 24, which compares to 22 in December.
This could hold the market for a while, but it could go to very oversold in the fall.
US Credit Spreads: 2015
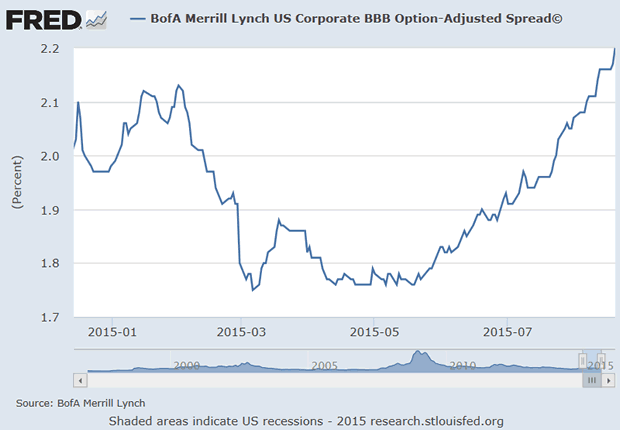
- The initial breakout was accomplished at 193 bps on June 29th.
- The critical breakout was achieved at 220 bps on August 19th.
- This is an important step, but not yet dramatic.
This compares to:
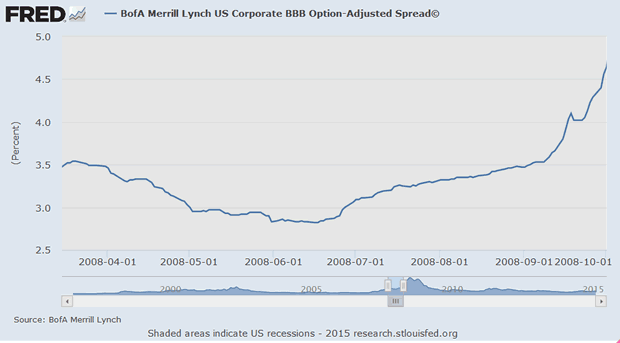
US Credit Spreads: 2008
- The initial breakout was accomplished at 300 bps on June 27.
- The critical breakout was achieved at 335 bps on August 7.
US Credit Spreads: 2007
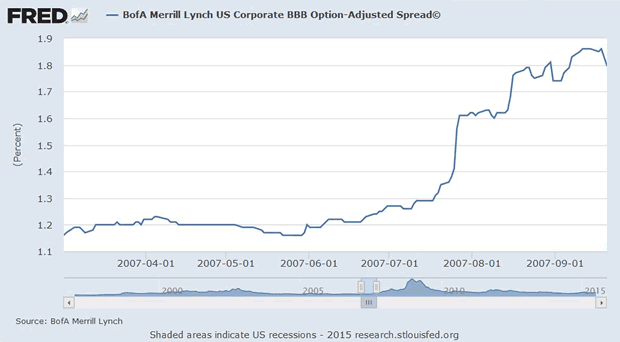
- The initial breakout was achieved at 124 bps on June 30.
- The critical breakout occurred at 135 bps on July 20.
US Credit Spreads: 1998
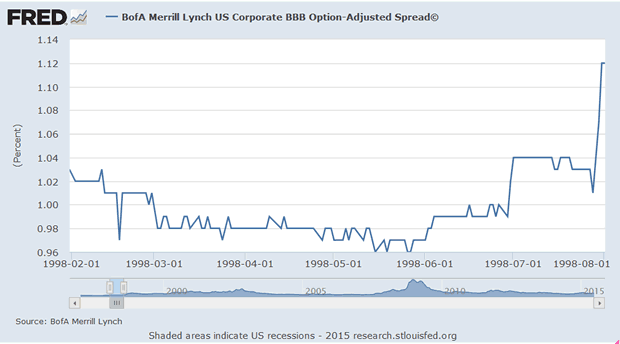
- The initial breakout was at 104 bps, accomplished on July 1st.
- The deadly breakout was widening above 107 bps on July 30.
NYSE Advance/Declines
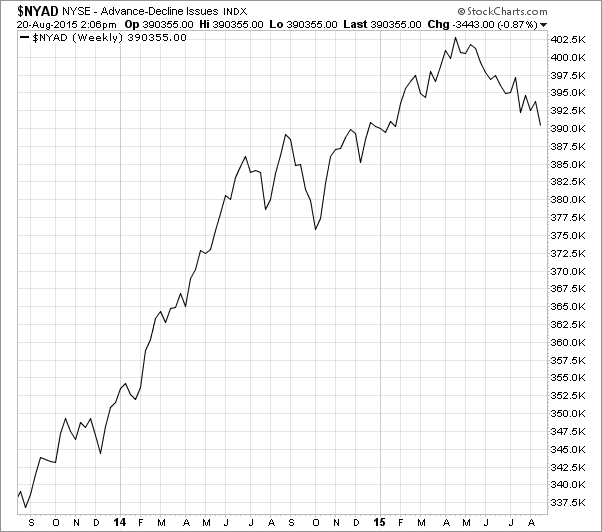
- This was one of our “Friends of the bull market”.
- The peak was in April and using past examples the S&P would likely continue for a few months.
- Last week, we noted that the shelf life had expired and the guidance had ended.
- The decline is now much more extensive than the one into last October.
- It is more extensive than the one going into October 2007.
- Breaking to new lows this week suggests a cyclical bear market is inevitable.
Listen to the Bob Hoye Podcast every Friday afternoon at TalkDigitalNetwork.com
Link to August 21 Bob Hoye interview on TalkDigitalNetwork.com:http://talkdigitalnetwork.com/2015/08/equity-markets-beyond-central-bank-help/

-
I know Mike is a very solid investor and respect his opinions very much. So if he says pay attention to this or that - I will.
~ Dale G.
-
I've started managing my own investments so view Michael's site as a one-stop shop from which to get information and perspectives.
~ Dave E.
-
Michael offers easy reading, honest, common sense information that anyone can use in a practical manner.
~ der_al.
-
A sane voice in a scrambled investment world.
~ Ed R.
Inside Edge Pro Contributors

Greg Weldon

Josef Schachter

Tyler Bollhorn

Ryan Irvine

Paul Beattie

Martin Straith

Patrick Ceresna

Mark Leibovit

James Thorne

Victor Adair