
Timing & trends
 It is official; the multi-month trading range on Wall Street has now ended with a breakout to the downside. You will recall that the major US indices were in a quiet, consolidation phase since December and over the past several weeks, we wrote extensively about the deterioration in the stock market’s internals.
In fact, about a month ago, our proprietary set of trend following indicators flashed ‘market under distribution’ which prompted us to reduce our equity exposure and partially hedge our book. Unfortunately, over the past few trading sessions, these set of indicators have deteriorated even more and there is now a high probability of an autumn plunge. Accordingly, we have reduced our equity exposure even more and currently, only half of the capital under our management is invested in common stocks.
Our remaining ‘long’ positions in equities are on a very tight leash (protected by trailing stops) and if the stock market slides further and our stops are hit, our losses will be no more than 3%. On the other side of the ledger, in order to hedge our equity exposure, we have allocated 20% of our managed capital to 20-30 Year US Treasuries, 10% to 25+Year Zero Coupon US Treasuries, 5% – ‘short’ industrials, 5% – ‘short’ biotechnology and 5% – ‘long’ US Dollar. So, if the stock market declines, our small losses on our remaining ‘long’ equity positions will probably be mitigated by profits from these holdings and if things get really ugly, we will do quite well.
Look. The stock market’s internals look very weak and after peaking in April, the NYSE Advance/Decline Line has now fallen to a multi-month low. Moreover, the number of 52-week NYSE lows is staying stubbornly above the number of 52-week NYSE highs and volume is rising on down days. Last but not least, all the major US indices are now trading under the 200-day moving average and both the Dow Jones Industrial Average and the S&P500 Index have slipped to a multi-month low. Despite this awful price action, many analysts and commentators remain oblivious to the looming danger and they are urging their followers to ‘buy the dips’!
Make no mistake, to our experienced eye, this does not feel like a normal pullback within the context of an ongoing primary uptrend. Instead, it seems to us as though the major US indices and global equities are rolling over and even our primary trend filter is getting close to flashing a full blown ‘market in correction’ signal. So, our readers should remain on guard and consider liquidating all weak stocks from their investment portfolios. Furthermore, we suggest that our readers cut back on risk and consider hedging their stock holdings.
On the economic front, the developed world is caught in a liquidity trap and the low-growth environment is likely to persist. In fact, we have a nagging feeling that with the slowdown in China, the world may be sliding into an outright recession. Last year, China was responsible for 40% of global growth and without a shadow of doubt; its economic woes will affect every nation. Already, the currencies, economies and stock markets of the commodity exporting nations have been decimated and if China’s housing bubble implodes, then things will get very interesting indeed! Remember, the constituents of the S&P500 Index derive almost 40% of their revenues/earnings from overseas and a global slowdown will hurt American business. So, in this era of globalisation, it will be naïve to assume that certain nations or sectors will somehow be insulated from the carnage.
Turning back to the stock market, our remaining ‘long’ positions are in the strong sectors (banks, consumer staples, consumer discretionary and housing) and on Thursday, we got stopped out of our European equity position. So, we now have no exposure to Europe and suggest that our readers also press the ‘sell’ button (despite the ongoing QE, European markets are falling and this is very bearish).
In terms of our performance, we are pleased to report that all our strategies are outperforming our benchmark (MSCI AC World Index).
Below is the performance summary of the various strategies:
| Net return since inception (1 January 2013) | ||
|
Equity Portfolio
|
Fund Portfolio
|
Benchmark (MSCI AC World Index) |
| (+) 24.50% | (+) 24.65% | (+) 20.29% |
| Net return since inception (1 August 2014) | ||
| Blue-Chip Portfolio | Benchmark (MSCI AC World Index) | |
| (+) 1.24% | (-) 3.31% | |
Turning to commodities, a world-class crash is now unfolding and the CRB Index is now trading at levels not seen since 2002! More importantly, the price of crude is sitting just above its 2009-crash low and we suspect it is going lower. Look. The commodities markets are telling us that something is very wrong and more likely than not, they are forecasting problems in China’s housing market. Should China’s debt bubble pop, its housing market may deflate for years and in our opinion, it may also affect Hong Kong’s property market. In any event, our readers should either be ‘short’ or out of all commodities.
In terms of precious metals, both gold and silver have firmed due to the ongoing turmoil. However, the deflationary forces are simply too intense and will probably overwhelm the precious metals market. So, we do not have any exposure to these inflation hedges.
In the forex market, the emerging markets counters are really feeling the heat and even some senior currencies are sliding against the greenback. Asian currencies remain in relentless downtrends and this does not bode well for global economic growth. At present, the US Dollar Index is still gyrating within its consolidation phase, but whether the Federal Reserve hikes or not, we suspect the next big move will be to the upside. At the time of writing, the Euro is approaching its declining 200-day moving average and this should provide an area of resistance. In any event, if the Euro slips through the 1.08 level on a closing basis, we will ‘short’ the single currency.
Finally, over in the debt market, as per our expectation, long dated interest rates in the US are falling and if we get a deflationary event, we may see fresh secular lows. Over in Europe, 10-Year government bonds are yielding less than 1% and if we get a global recession, the 10-Year US Treasury Note may also join the sub-1% party! Accordingly, we have allocated 30% of our managed capital to 20-30 Year US Treasuries. Over in the corporate debt space, junk bonds have definitely topped out and the path of least resistance is down.
###
Puru Saxena Saxena Archives
email: puru@purusaxena.com
website: www.purusaxena.com
Puru Saxena publishes Money Matters, a monthly economic report, which highlights extraordinary investment opportunities in all major markets. In addition to the monthly report, subscribers also receive “Weekly Updates” covering the recent market action. Money Matters is available by subscription from www.purusaxena.com.
Puru Saxena is the founder of Puru Saxena Wealth Management, his Hong Kong based firm which manages investment portfolios for individuals and corporate clients. He is a highly showcased investment manager and a regular guest on CNN, BBC World, CNBC, Bloomberg, NDTV and various radio programs.
Copyright ©2005-2015 Puru Saxena Limited. All rights reserved.

I can’t tell you the complaints I’ve received over roughly the last 14 months, when I started warning everyone that a stock market correction was coming. Possibly a big one.
They said I was nuts. That I was a stopped clock. After all, the major indices such as the Dow Industrials and the Nasdaq were making one new high after another.
I even told investors who were interested in dividend income to stay out, they’d lose more than they could possibly earn in dividends or royalties when the principal of their investments would plunge.
But I stood my ground, backed my time-tested models. And the facts now are this …
A. Even before the stock market started to plunge last week, more than 67 percent of all publicly traded U.S. stocks were down at least 10 percent.
B. Now that the market is falling, those figures are even greater. 70 percent of publicly traded stocks in the S&P 500 are now down at least 10 percent.
C. And fully 31 percent are now down at least 20 percent!
D. Globally, more than $2.5 trillion has been wiped off of stock values in the past year!
Thing is, most investors who didn’t listen to me, won’t listen to me when I scream that the bottom is in and that the Dow Industrials are headed to well over 31,000 over the next few years.
And that Asian markets, as ugly as they seem right now, will do even better, with China probably quintupling.
Instead, they will be panicking near the lows, claiming it’s the end of the world. That the Dow is going to below 5,000 or some ridiculous number. That China and Asia are going to crash and burn. That the only safe place to be is in U.S. Treasuries.
And guess what? Those investors will …
A. Miss out on the biggest stock market gains, ever. And …
B. They will lose almost every penny they invest in U.S. or European sovereign bonds.
Let me give you perhaps the two most important insights you could ever have on how markets work. Insights that you only get from studying thousands of years of data every which way you can, and from being a professional trader yourself.
First, the majority of investors lose money. They are caught on the wrong side of the markets, especially at extreme highs and lows.
Second, pullbacks, crashes, mini-panics, bear market rallies in bear markets, etc. — all create the energy needed for the major underlying trend to finally reemerge.
In other words, it’s the crashes, like we are seeing now in stocks, that pave the way for the next bull run higher.
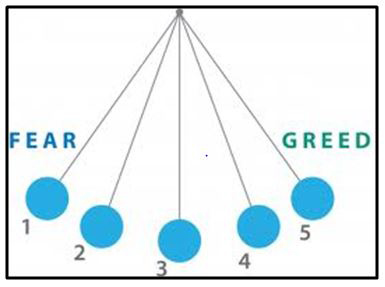 It’s the way the markets move, like a giant pendulum, swinging from one side to the other, from fear to greed and back again.
Let’s say, for instance, that the swing of the pendulum to the right is a bull market. How can it possibly swing to the right unless it first swings to the left?!
And on the flip side, let’s say the pendulum’s swing to the left is a bear market? Well, how can it possibly swing to the left if it hasn’t already swung to the right?
Get the picture? That is precisely how markets work. To get those swings, the majority of investors must, by definition, get trapped, bailing out precisely at the wrong time.
Shorts bail out at tops; longs bail out at bottoms.
And only the savvy know when to get out and back in at the right times!
That’s also why I couldn’t be happier about what’s happening in stocks now. Not only because I’ve been right of course, but far more importantly …
It’s setting up that inevitable swing back to fear, which will create the energy for the pendulum to swing back in the other direction, to the right, and help fulfill my long-term forecast, that the Dow is headed to 31,000+ over the next two years.
Problem is, as I said before, very few investors, except those who subscribe to my Real Wealth Report and my Supercycle Trader, will profit from it.
I’m not boasting mind you, I am just telling you like it is. Even if you’re not a member of my services and never become a member, please at least take the lessons I try to give you in these columns seriously; they will help you to both avoid losses and make more money to boot.
So what now for the stock market? Will it continue to crash? If so, where might it stop?
First, according to my models, the correction is not yet over. We should see a bounce back develop this week, if it hasn’t already done so by the time you read this column. But that’s all it will be, a bounce.
Second, major support for the Dow Industrials, the index most widely watched, comes in at the 15,672 level. If that gives way, the Dow will likely fall much further, to about 13,937.
Third, the correction, or crash, or whatever you want to call it, should be over by October, and may even come to an end this month, in a normal three-month correction.
I won’t be able to determine that until we see how the markets close out the month, on the last day of trading on Monday, Aug. 31.
At that time, I’ll be able to run my studies and update my forecasts. Month-end closings are more important than weekly closings, which in turn, are more important than daily closings.
As to gold; no it has not bottomed. All you are seeing is a bear market bounce. That too will end soon and give way to a renewed decline that will take gold below $1,000.
Best wishes and stay tuned …
Larry

Larry Edelson, one of the world’s foremost experts on gold and precious metals, is the editor of Real Wealth Report, Power Portfolio and Gold and Silver Trader.
Larry has called the ups and downs in the gold market time and again. As a result, he is often called upon by the media for his investing views. Larry has been featured on Bloomberg, Reuters and CNBC as well as The New York Times and New York Sun.
- Have US stocks entered a bear market?
- In most assets, MSM (mainstream media) uses a 20% decline as a rule of thumb to define a bear market. While an asset that’s declined 20% might be in a bear market, that rule of thumb is at best a very crude attempt to define the overall price action.
- Different assets require different rules of thumb. Dow Theory provides a time-tested means of classifying the US stock market as bullish or bearish.
- On that note, please click here now. That’s the weekly chart of the Dow Jones Transportation index.
- Next, please click here now. That’s the weekly chart of the Dow Jones Industrials index.
- In terms of time, a Dow Theory sell signal is quite a long process; both averages must make a series of lower intermediate trend lows and highs. In the case of the current market, that may happen, but it hasn’t happened yet.
- The professional Dow Theorist is now watching for an intermediate trend rally to occur in both averages. If they fail to breach the recent highs, that in itself is not a sell signal.
- A sell signal would occur only if both averages then decline and close below yesterday’s closing prices.
- For decades, I have defined the August 7 – October 31 time frame as “crash season“. There’s no question that current US stock market price action is very concerning.
- The real risk of being invested in US stocks during these three months dramatically outweighs any potential reward. That’s because generational wealth can be destroyed in a few days, weeks, or even hours. August is typically the set-up month, and the crash and/or ensuing bear market occurs in either September or October.
- Please click here now. That’s a monthly chart of the Dow Industrials. The uptrend from the 2009 lows has been broken, and the key 5,15 moving average series is rolling over, ominously. I’m a buyer of the Dow only at 14,200, which is where massive buy-side horizontal support (HSR) begins.
- Gold and silver enthusiasts are disappointed that there was not a rush into gold as the Dow tumbled. The SPDR ETF holding did rise modestly, from about 677 tons to 681, but yesterday’s price action was slightly negative.
- The safe haven trade for gold relates more to key bond markets than to stock markets. In my professional opinion, there are two reasons that Janet Yellen would hike rates. The first is to boost money supply velocity (by boosting bank loan profits).
- I also think that Janet shares Alan Greenspan’s concerns about the long term economic problems caused by the size of government. Military spending and entitlement programs don’t do much for money supply velocity. In contrast, by raising rates, Janet can direct institutional liquidity flows away from the T-bond market, away from government, and into the private sector.
- Rate hikes can reverse declining money supply velocity, and potentially quite violently. That’s good news for gold and silver bugs! Obviously, I’m 100% in favour of a September rate hike. Regardless of when it occurs, global stock and bond markets could stage a horrific meltdown after the first rate hike, while gold and silver rally strongly!
- Fortunately or unfortunately, depending on your perspective, most of the price action in the gold market is not directly related to economic events in the West. It’s mainly related to demand for gold jewellery versus mine and scrap supply in India. The key point is that when Indian demand is very strong, gold-bullish events in the West can cause enormous surges in the price.
- Likewise, when Indian demand is tepid, events in the West that “should be bullish” don’t have much effect on the price, and that can frustrate gold enthusiasts. Ominously, when Indian demand is weak (typically from February to July/August), events in the West that are bearish for gold can cause substantial declines in the price.
- The good news right now is that Indian jewellers, refiners, and economists are forecasting very strong demand over the next four months! That means any event in the West that is even modestly bullish for gold could send the price much higher.
- Please click here now. Indian Dore bar imports are surging, with refiners predicting 50% growth this year. The lower duty is a key factor, and I expect this to continue for many years.
- China is also a key source of demand for gold. Please click here now. That’s one take on China, from a key Goldman Sachs analyst. I’ll add that Hong Kong’s stock market sports an average P/E ratio of about 8. The PBOC has plenty of room to cut rates substantially, and the country has almost $4 trillion in FOREX reserves.
- The Chinese stock market is suffering a hard landing, but I don’t see the Chinese economy suffering the same fate. Even if there is a hard landing, China doesn’t need to grow dramatically to boost gold demand consistently. Modest growth is fine, and that’s in play now.
- Another overlooked area of gold demand is Iran. I’ve predicted that Iran will become an economic “powerhouse“, while Saudi Arabia declines. Please click here now. Iran bought a staggering 200 times more gold jewellery from Turkey this year than last year. Switzerland has also started re-exporting gold to Iran. Once all the Western sanctions are gone, I’m projecting that Iranian gold jewellery demand will reach 300 – 400 tons a year very quickly, making it the third most important gold market in the world!
- Please click here now. That’s the daily gold chart. After what is roughly a $100 rally, investors need to be patient, and prepare for a pullback. Please click here now. That’s another look at the same chart. There may be a second flag pattern forming, which is very bullish. A pullback to $1125 is more likely, but overall the chart looks solid.
- Please click here now. That’s the GDXJ weekly chart. There’s a great looking bull wedge pattern in play, with an intermediate term target of $45. I realize that junior gold and silver stock enthusiasts are in a bit of pain after yesterday’s general market meltdown, and there could be more if gold declines to the $1125 area. Investors don’t need to “grin and bear it“. They need to grin and buy it! The strong season for gold is off to a typical start, with gold quite strong, and the stocks very volatile. The junior gold stocks will take the lead baton soon, and start the rise to $45 on the GDXJ chart!
Special Offer For Website Readers: Please send me an Email to freereports4@gracelandupdates.com and I’ll send you my free “Go Pro With Silver!” report. Silver is set to outperform gold, and perhaps quite dramatically, if Janet is successful at reversing money supply velocity. I cover five key silver stocks, with buy and sell points for each of them, and for silver itself!
Thanks!
Cheers
st

Greg Weldon, weldononline.com, joins us to discuss and analyze recent developments in stocks and bonds and what the effects may be on Fed Policy and Gold. Interviewed 08/21/2015
 About Greg Weldon:
Weldon Financial produces independent research for the sophisticated investor and/or trader and offers investment management solutions that capitalize on global market trends. Greg Weldon is the founder and sole producer of all the research and operates his money management services as a registered Commodity Trading Advisor.
Weldon’s Money Monitor offers a very independent, objective view of the global markets by applying a top down market analysis and a bottom up technical analysis.
About Jordan Roy-Byrne, CMT
Jordan Roy-Byrne, CMT is the editor and publisher of The Daily Gold.
Larry Edelson’s Wednesday missive, “Europe’s Crisis Over? Hogwash!” is both accurate and prescient.
So if you haven’t read it yet, I think you should do so now.
Larry is one of the very few who not only forecast the crisis well ahead of time, but also accurately predicted how it would impact the U.S. dollar, commodities, inflation/deflation and U.S. stocks.
His main points:
Point #1. Greece isn’t the only European country suffering under the heavy weight of severe austerity measures. In fact, their vulnerability to Greek tragedies is now worse than ever. Larry writes …
“The proof is in the numbers. Before the Greek crisis flared up, debt-to-GDP in Greece stood at 113%. Today, Greece’s debt-to-GDP stands at a tad north of a whopping 177%.
“In Spain, pre-crisis debt stood at 40% of GDP. Today it’s more than 97%. In Italy, it was 106%. Now it stands at 132%. In France, it was 68%. Now it’s 95%. Even Germany’s debt-to-GDP is worsening, leaping from almost 67% in 2008 to almost 75% today.
“In each and every case, debt-to-GDP is worse than it was at the beginning of the crisis — and the austerity measures are literally causing the entire European continent to implode.”
Point #2. Austerity and climbing debt are slowing Europe’s economy. GDP is abysmal, missing expectations almost across the
board.
Point #3. Despite — or, arguably, because of — all the bailouts, Europe’s unemployment is still among the worst in modern times.
Point #4. Commodity deflation is picking up momentum. And never forget: Deep deflation and big debts are an explosive mix. When prices decline, governments and businesses take in less revenues. Moreover, with less revenues, sustaining debts can suddenly be far more difficult.
Now comes the next phase of this sad saga …
The Grand Greek Bailout #3, the third major attempt in recent years to pull the country out of the abyss, is now a done deal.
We have ever-more Draconian austerity legislation — passed in Athens … all the needed European approvals in place … and new debt money already flowing into Greece’s coffers.
Very strange.
Because just two months ago, nearly everyone — both lenders and debtors alike — seemed to agree that piling on more debt with still another major wave of austerity was a terrible idea.
* Greek Prime Minister Tsipras denounced the demands by the lenders as “blackmail.” He made the case that the required austerity measures would destroy the Greek economy. In fact, he was so confident in his position, he called a referendum and persuaded the Greek people to overwhelmingly vote against the deal. (Postscript: Yesterday, he resigned.)
* Most Germans, led by German Finance Minister Schäuble, argued that another Greek bailout would be disastrous for Greece, the euro and all of Europe. The only rational solution, they said, would be to eject Greece from the European Union.
* The International Monetary Fund published a landmark report that effectively denounced the entire austerity-and-bailout plan. They argued it could never work unless Greece got major debt relief — something that was never granted and probably won’t be.
No one was able to substantially refute these arguments.
No one was able to explain how this third major attempt to bail out Greece was any different from the first two failed attempts.
Nearly everyone realized that it was insane to try the same exact prescription and expect different results.
Yet they did it anyhow.
All for the sake of political expediency. All because they lacked the collective wisdom and courage to do what they knew (or should have known) was the right thing — to bite the bullet and surgically remove the cancer.
Bottom line:
They failed to surgically remove the debt cancer.
They failed to stop its spread.
And they have left Europe — plus much of the world — even more vulnerable to the next debt crisis.
This is one of the reasons why we have avoided long-term government bonds like a plague.
This is why we have insisted investors should maintain huge amounts of cash in their portfolio.
And this is why capital preservation should remain, as before, one of your paramount goals.
Good luck and God bless!
Martin

-
I know Mike is a very solid investor and respect his opinions very much. So if he says pay attention to this or that - I will.
~ Dale G.
-
I've started managing my own investments so view Michael's site as a one-stop shop from which to get information and perspectives.
~ Dave E.
-
Michael offers easy reading, honest, common sense information that anyone can use in a practical manner.
~ der_al.
-
A sane voice in a scrambled investment world.
~ Ed R.
Inside Edge Pro Contributors

Greg Weldon

Josef Schachter

Tyler Bollhorn

Ryan Irvine

Paul Beattie

Martin Straith

Patrick Ceresna

Mark Leibovit

James Thorne

Victor Adair