
Timing & trends
Sent to Subcribers 07/18/15 –
September 13th will complete the seventh cycle of a seven-year Shemittah cycle1 in the 5775th year of the Jewish calendar. The last Nine of the Shemittah cycles since 1900 have coincided with years when the Dow Industrials declined by twenty percent or more in the second half of the Julian calendar year. Two more saw hard breaks in the first half (37% in March 1938 and 17% in April 1980). This year’s July 8th low (4.8% from the high) should be watched closely. Support was evident around the 5% and 10% levels from June through September in the years that did not crash.
The threshold for bad breaks in the second half of all Shemittah years has been 10%. Each break beyond 10% went on to decline by 20%+. Buying December put options over the next month with a strike price 10% below the year’s high would appear to be prudent insurance.

Shemittah Years with Uptrends into July
Seven of the sixteen Shemittah years since 1900 resulted in higher levels in the Dow into July- September. This year is looking like it could become the eighth. Highs occurred 09/02/94, 08/24/87, 08/15/80, 08/07/59, 08/15/82, N/A 1945 and 08/24/24. Other than 1945, each went on to generate a decline into the seasonal low of September-October, but only 1987 declined by more than 10%. The 10% level held in 1987 for three weeks in September and then triggered a break on October 12th for a total decline of 40%.
A break of support (currently 17,712) after July 10th and the 55-week moving average (currently 17,566) would likely lead to a 10% decline (16,515). A violation of that would call for a move below 15,000.
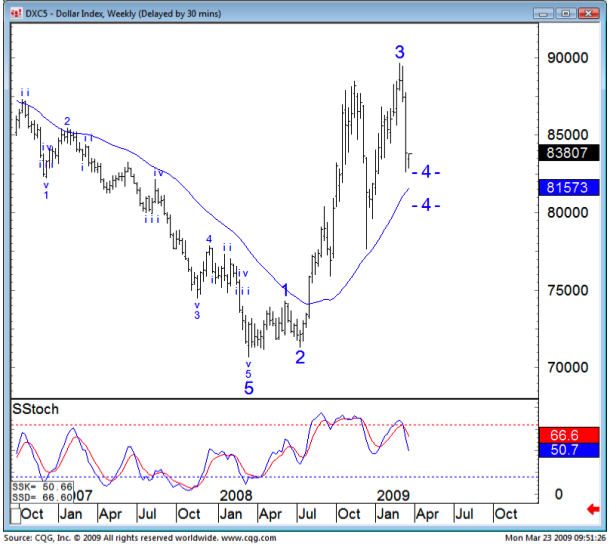


Although 1980 and 1994 failed to produce 20% declines in equities, they did see bear markets in the long end of the T-Bond market. This fits with our view that the Treasuries should drop to the 89-month moving average (108 on TLT) in the 12 to 18 month period following the upside Exhaustion alerts in January when yields were 2.3%. The moving average provides a targeted yield of 3.6% on the 30-year bonds, up another 50 bps from today’s 3.1%.

1. The current Shemittah year began on Rosh Hashanah, September 25 2014, corresponding to the Hebrew calendar year 5775. It is the seventh year of the seven-year agricultural cycle.
These 7×7 year cycles always repeat and this is the last Shemittah (49th year) of this current cycle which ends at September 13, 2015. The next calendar period of 7 years starts with the 50th year, Jubilee on September 23, 2015.
BOB HOYE, INSTITUTIONAL ADVISORS
EMAIL bobhoye@institutionaladvisors.com
WEBSITE www.institutionaladvisors.com
The opinions in this report are solely those of the author. The information herein was obtained from various sources; however we do not guarantee its accuracy or completeness. This research report is prepared for general circulation and is circulated for general information only. It does not have regard to the specific investment objectives, financial situation and the particular needs regarding the appropriateness of investing in any securities or investment strategies discussed or recommended in this report and should understand that statements regarding future prospects may not be realized.
Investors should note that income from such securities, if any, may fluctuate and that each security’s price or value may rise or fall. Accordingly, investors may receive back less than originally invested. Past performance is not necessarily a guide to future performance. Neither the information nor any opinion expressed constitutes an offer to buy or sell any securities or futures contracts. Foreign currency rates of exchange may adversely affect the value, price or income of any security or related investment mentioned in this report. In addition, investors in securities such as ADRs, whose values are influenced by the currency of the underlying security, effectively assume currency risk. Moreover, from time to time, members of the Institutional Advisors team may be long or short positions discussed in our publications.

Let’s get it straight: this is a serious deflationary bust in the making. The most worrisome fact is Dr. Copper’s technical breakdown, as seen on the first chart.

Source: StockCharts.com
The price of copper, being a leading indicator for the health of the global economy, has broken through a multi-decade trend channel. This is really bad news for the global economy, and for markets in particular. This setup carries a message you simply cannot ignore if you are a serious investor…..continue reading HERE
 1. Gold Cracks $1,100. Here’s What’s Next …
by Larry Edelson
Gold will likely soon bounce higher. That in turn will get many analysts and investors excited, proclaiming the bottom is in. But …
Once that bounce is over, gold will cascade lower to well below $1,000 before bottoming.
So don’t be fooled. Gold will go still lower. And so will silver, platinum and palladium
…..read it all HERE
2. The Panic That’s Happening Right Now Is Much Bigger Than Just The Gold Market
by Gerald Celente
On the heels of the recent panic selloff in the gold market, today the top trends forecaster in the world warned that the panic that’s happening right now is much bigger than just the gold market. Celente also went on to discuss the shocking truth about what is really happening in countries around the world.
3. Jim Rogers: Won’t Buy Gold Yet
Legendary investor Jim Rogers says he is waiting for gold to go below US$1000 before buying more.
Also Rogers on the Greece Deal, Oil and some of his very recent trades
 Mark Leibovit’s Annual Forecast Model (The VR Forecaster Report) is published each and every year in early February and comprises Mark Leibovit’s proprietary cyclical forecast for the Dow Industrials and Gold. This year T-Bonds, the U.S. Dollar Index, Natural Gas and Palladium have been added! Don’t miss the opportunity to see his widely recognized report that projects market direction and/or important cyclical change points months in advance.
At the 6 month point in the Forecast, Mark joins Michael to talk about the big picture as it unfolds AND make a unique offer to MoneyTalks listeners. An opportunity to get the complete Report for only 10% of the original $500 cost. For only $49 listeners can access the report immediately at moneytalks.net. This offer is only available for 48 hours.
CLICK HERE to purchase for the special $49 price. Access codes will be emailed immediately and you can read it right on your computer. You get unlimited access and the report will be available for review for the next 6 months. ORDER NOW!

The Great Recession and its aftermath was actually the best of times for countries with natural resources to sell. The US, Europe and Japan ran record deficits and cut interest rates to zero or thereabouts, sending hot money pouring into mining and energy projects around the world, while China borrowed (as it turned out) $15 trillion for an epic infrastructure build-out.
The result was robust demand and high prices for raw materials like copper, oil and iron ore, and a tsunami of cash pouring into Brazil, Canada, Australia and the other resource producers. Conventional wisdom deemed these countries to be well-run and destined for ever-greater things, which led locals to borrow US dollars at cheap rates and invest in mines, factories and/or domestic government bonds with much higher yields. Good times and fat margins all around.
Then it turned out that the debts accumulated by the resource-consuming economies had created a headwind that they couldn’t overcome. The Chinese build-out abruptly ended and the developed world failed to achieve escape velocity, causing the US dollar to soar and commodity prices to plunge. Oil, for instance, is down 21% just the last in last six weeks. while the Bloomberg Commodity Index is 42% below its recent high.
For a sense of what this means, pretend you’re Brazil. During headier times your oil, iron ore and soybean exports created a generation of new millionaires and allowed your government to balance its budget. This in turn led your leaders to ratchet up spending and your entrepreneurs to borrow what now looks like an insane amount of US dollars.
Now your currency, the real, is plunging…

…while your interest rates are surging:

Among other things, this gives you: a ton of dollar-denominated loans that are deeply under water and will be defaulted upon soon; plunging tax revenues necessitating huge cuts in government spending and/or much higher taxes — at exactly the wrong time; and hundreds mines and factories that aren’t generating enough cash flow to cover their cost of capital and will soon fail.
Variations on this theme are playing out across the resource economy world, so depending on the country, it’s crisis now (Argentina and Venezuela) or crisis in 2016 (nearly everyone else).
And that’s if everything stabilizes around these levels. Let resource prices keep falling and/or the dollar rise further and we can replace “crisis” with “chaos.”
For more, see:
Brazil slashes fiscal savings goals for 2015 and 2016 on plunging tax revenue
The Australian dollar is smashed and poised to fall below US70 cents, analysts warn
Mexican peso continues to sink
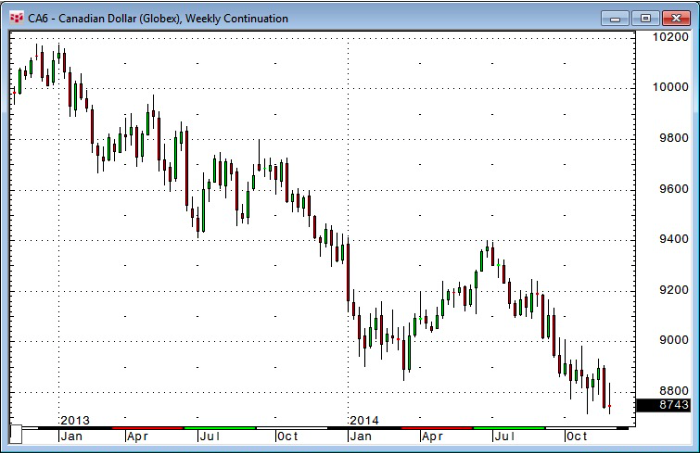
Canadian dollar drops to lowest level since 2004

-
I know Mike is a very solid investor and respect his opinions very much. So if he says pay attention to this or that - I will.
~ Dale G.
-
I've started managing my own investments so view Michael's site as a one-stop shop from which to get information and perspectives.
~ Dave E.
-
Michael offers easy reading, honest, common sense information that anyone can use in a practical manner.
~ der_al.
-
A sane voice in a scrambled investment world.
~ Ed R.
Inside Edge Pro Contributors

Greg Weldon

Josef Schachter

Tyler Bollhorn

Ryan Irvine

Paul Beattie

Martin Straith

Patrick Ceresna

Mark Leibovit

James Thorne

Victor Adair