
Timing & trends
Home ownership rates are sinking and demographics are part of the reason. But does that constitute a new housing crisis?
The Wall Street Journal writer Nick Timiraos makes the case in New Housing Crisis Looms as Fewer Renters Can Afford to Own.
Last decade’s housing crisis has given way to a new one in which many families lack the incomes or savings needed to buy homes, creating a surge of renters and a shortage of affordable housing.
The latest crisis looks very different from the subprime mania of the early 2000s, but it does share one
trait: Policy makers in Washington appear either unaware or unwilling to do much about it.
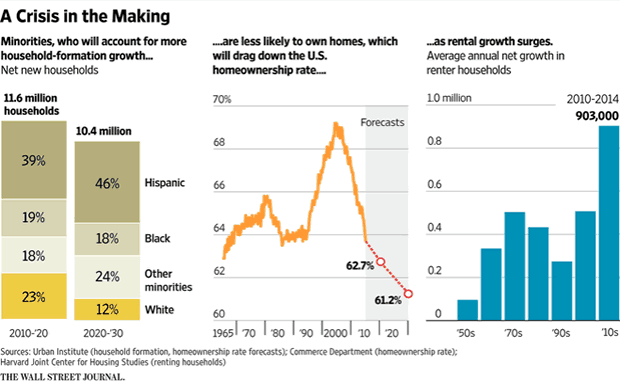
The U.S. homeownership rate is now below where it stood 20 years ago when President Bill Clinton launched a national campaign to encourage more Americans to buy homes. Conventional wisdom says the rate, now at 63.7%, is leveling off to where it was for decades before the housing-market peak.
But this is probably wrong, according to research from the Urban Institute, which predicts homeownership will continue to slip for at least the next 15 years.
Demographics tell the story. The Urban Institute researchers predict that more than 3 in 4 new households this decade, and 7 of 8 in the next, will be formed by minorities. These new households — nearly half of which will be Hispanic — have lower incomes, less wealth and lower homeownership rates than the U.S. average.
The declines reflect a surge of new renter households, which is boosting rents. Together with tougher mortgage-qualification rules, this will leave households stuck between homes they can’t qualify to purchase and rentals they can’t afford, says Ron Terwilliger, who spent two decades running Trammell Crow Residential, one of the nation’s largest apartment developers.
As rental households devote a greater share of their income to rent, families could face greater challenges in saving for a down payment. This could restrain a housing market that has failed to provide any real lift to the economy in the current expansion.
What’s to be done? Given budget pressures, it may not be realistic to expect the government to spend any more money on housing than it already does. Thus, the focus now should be on reallocating what is already committed, says Mr. Terwilliger, a Republican, who this month will formally launch a foundation designed to start these conversations. His goal is legislation after the 2016 election that realigns housing policy with the shifting dynamics.
Breaks for Apartment Builders
Given that Terwilliger spent two decades as one of the nation’s largest apartment developers the answer should be easy to figure out. He wants to end tax breaks for home ownership to subsidize new home owners and “free up funds for the rental side.”
His complaint: 75% of the housing tax breaks go to the top 20% of individuals. That is hardly shocking given the top 20% buy the most expensive homes and therefore pay the most in interest.
Timiraos, buys all Terwilliger’s nonsense hook line and sinker, finishing the WSJ article with “Politically, none of this will be easy . Some will say it’s a zero-sum game — helping renters at the expense of owners. Not so, says Mr. Terwilliger. If renters can’t ever become homeowners, who will buy those homes when today’s homeowners need to sell?”
Housing Crisis Past and Present
The 2015 housing crisis was caused the same way as the one in 2007: Interference by the Fed, by Congress, by local officials wanting to create affordable housing.
Terwilliger wants a combination of affordable housing and affordable renting. Lovely.
Driving up home ownership rates does is guaranteed to do one thing: drive up prices.
Fannhie Mae, Freddie Mac, and hundreds of other government programs culminating with president Bush’s “Ownership Society” all contributed to make housing unaffordable.
The government has no business promoting one form of living over another.
Self-Correcting Problem
Terwilliger ends with the question “If renters can’t ever become homeowners, who will buy those homes when today’s homeowners need to sell?”
The answer should be obvious: Prices will fall until there is a pool of buyers!
In the wake of the great financial crisis, home prices actually fell to the point of being affordable. Few seemed happy with the result. The Fed wanted to prevent deflation and in the greatest financial experiment in history unleashed round after round of QE.
Asset prices recovered, but wages didn’t. As a result, homes are once again unaffordable.
Does Terwilliger want affordable housing or not?
If government and the Fed got out of the way, there would be no problem. Instead, Terwilliger wants the government to “do something”.
I suggest the government and the Fed have done far too much already.
Solution is Undoing
Instead of promoting something, a process that has failed every time, how about undoing everything that contributed to the mess.
My proposal
- Eliminate Fannie Mae
- Eliminate Freddie Mac
- Eliminate the FHA
- Eliminate rent rent controls
- Eliminate itemized deductions and replace with a flat tax
That’s the real solution to the problem, not more self-serving affordable housing nonsense from people with a vested interest in promoting something for their own benefit.

 With crude oil tumbling nearly 3 percent and continued uncertainty in global markets as investors remain concerned about the U.S. jobs report, today 5 of themost shocking charts of 2015!
The great global distortions that have unfolded as a result of Western central banks embarking on …..continue HERE for the 5 Charts & commentary
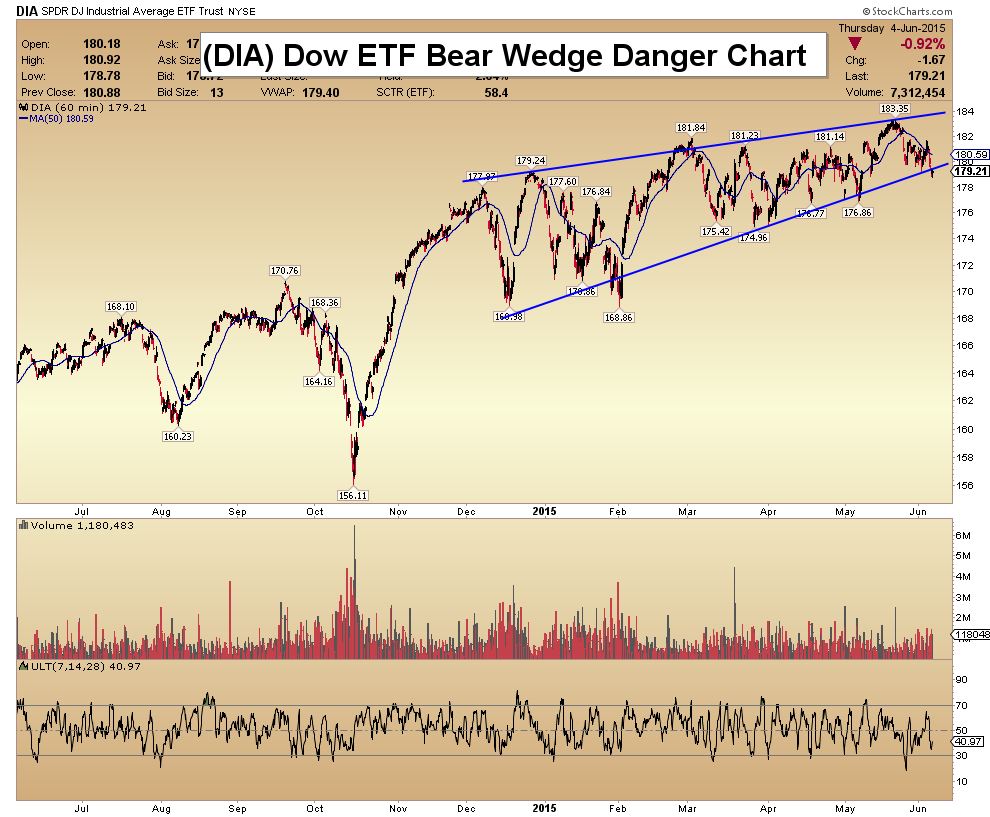
Dow & Dollar Charts Of Danger Video Analysis
Gold & Silver Oversold Video Analysis
GDX, GDXJ, & SIL High Octane Volume Video Analysis
Junior Gold Stock Bull Flag Video Analysis
More Key Junior Gold Stocks Video Analysis
Gold & Silver Targets Video Analysis
Thanks,
Morris
Friday, June 5th, 2015 Super Force Signals special offer for Money Talks Readers:
Send an email to trading@superforcesignals.com and I’ll send you 3 of my next Super Force Surge Signals free of charge, as I send them to paid subscribers. Thank you!
The SuperForce Proprietary SURGE index SIGNALS:
25 Surge Index Buy or 25 Surge Index Sell: Solid Power.
50 Surge Index Buy or 50 Surge Index Sell: Stronger Power.
75 Surge Index Buy or 75 Surge Index Sell: Maximum Power.
100 Surge Index Buy or 100 Surge Index Sell: “Over The Top” Power.
Stay alert for our surge signals, sent by email to subscribers, for both the daily charts on Super Force Signals at www.superforcesignals.com and for the 60 minute charts at www.superforce60.com
About Super Force Signals:
Our Surge Index Signals are created thru our proprietary blend of the highest quality technical analysis and many years of successful business building. We are two business owners with excellent synergy. We understand risk and reward. Our subscribers are generally successfully business owners, people like yourself with speculative funds, looking for serious management of your risk and reward in the market.
Frank Johnson: Executive Editor, Macro Risk Manager.
Morris Hubbartt: Chief Market Analyst, Trading Risk Specialist.
website: www.superforcesignals.com
email: trading@superforcesignals.com
email: trading@superforce60.com
SFS Web Services
1170 Bay Street, Suite #143
Toronto, Ontario, M5S 2B4
Canada
###
May 29, 2015
Morris Hubbartt


Perspective
Decades ago, we used some quips attributed to the “trading floor cynic.” After more than fifty years in the markets
and after reading so much of financial history one might become jaded about the markets. Not in these pages. There are very few stock market trading floors anymore and there never were any for the interest rate markets.
But we used to like the trading floor cynic and it might have been an invention of Ed Hart who was on FNN a business channel in Southern California. Sometime in the 1980s, Bob was in LA and while there interviewed with Ed.
The NYSE still has a trading floor, but the “back office” no longer handles paper transactions. The process has become remarkably efficient. As a boom culminated frantic traders would execute orders faster than the tape could record. The tape running late was exciting and worthy of comment. And as speculation went vertical the back office would seize up, which was one of the signs that the boom was over.
And then there were the days of very quiet trade and on one of those days, Ed said that “Trade was so slow that the tape was running fast”.
His other classic was that on the sudden reversal to a major plunge, “The confirmations go out with the margin calls”.
Ed may have passed away and FNN was taken over by CNBC.
Stock Markets
The structure of the overall stock market is still within a big Rounding Top. The NYA has been a good monitor and this Topping has run from last June to recent. Within the structure, sentiment and momentum numbers reached levels seem only at cyclical peaks. Margin employed accomplished a peak last year. And after a natural correction, set a higher high on the latest number which is for March. The second peak is unusual. Complacency builds.
As we have been noting, the NYA pattern is looking like the peak in 2000. In which case, the first step to change will be taking out the 50-Day ma. The defining step will be taking out the 40-Week ema. It is at 10903 and the index is at 11143.
Now why are we so interested in this turndown?
Private stock market participants are more than capable of driving a market to the speculative climax of a bull market. This has been happening and it is accompanied by
the greatest speculation by policymakers in history. Not only have central bankers been buying stocks and bonds, they have been buying all the way up. In the US, this is becoming concerning as Fed officials could be in violation of the “Prudent Man Rule”, which in various iterations dates back to 1830. This essentially instructs that those with fiduciary responsibility 1 should not be buying anything that they would not buy themselves.
That a committee can manage an economy depends upon the concept of a national economy, which does not exist. The other key concept has been that a forced credit expansion by the Fed will force a business expansion. This is a primitive syllogism. As exampled by the Fed, interventionist central banking is a speculative concept. As exampled by the ECB, policy implementation of policy has become fanatical.
This financial bubble has both the private and policy sectors in a highly speculative mode.
On our dedication to archaic, since February we have been monitoring the Dow Theory. It has been in the heads-up mode since March and in an alert mode since the Trannies took out the 50-Day in late March. Taking out the 200-Day on May 11 was a warning. Last week it rose to the 200-Day and has failed. Not good.
A chart follows that takes the warning from the change in credit spreads to a peak in the stock market. It is complicated with a 12-month shift in the indicator, which reversed in late February. We take it as a warning.
In the meantime, we have considered that this stock rally would make it into May and then become vulnerable to the pending reversal in credit spreads.
Are we close to a cyclical peak for the stock market?
This one requires a comment on the economy. In a world of financial engineering and financial manias business activity and the stock market turn down, virtually, together. Examples include 2007, 1929 and 1873. All using NBER determinations of recessions. We have considered that weakening “Macro” numbers since January could be indicating a recession. This would be cyclical but the stock market is on a seasonal rally. At some time they will get together.
Some items have been changing and are no longer supportive. The Treasury yield curve reversed in April. After reaching a targeted high, commodities have turned down. Credit spreads have stopped narrowing.
A positive for the big cap stocks is the firming dollar.
1 The 1946 review include archaic words and meanings from a long lost world. “which men of prudence, discretion and intelligence exercise in the management of their own affairs, not in regard for speculation but in regard to the permanent disposition of their funds.”
Commodities
Iron ore appears to be a late bloomer on our “rotation” move for this year. Last week we asked the question about a possible rotation. The posting for April was 51.15. Within this, the May contract set a low of 49 and is now trading at 59. Cheers and perhaps the relief rally could run for a number of weeks.
Some commodities have met our objectives and have weakened.
Base metals (GYX) rallied from 299 in January to 346 in early May. As noted a couple of weeks ago, the swing from oversold to overbought was huge. As it was for the miners (SPTMN), which rallied from 513 to 832. This has slipped to 731 where it is holding at the 50-Day and 200-Day moving averages.
Metals have taken out the 200-Day at 338 and the 50-Day at 320. Today’s trade is at 313. Crude and oil stocks also accomplished the big swing from very oversold to overbought.
Our May 14th Pivot advised taking the money off the gaming table.
By stages, cotton is declining from its overbought at 68 at the first of May to 63. This is below the 50-Day and holding at the 200-Day moving averages.
Grains (GKX) did not join the “rotation”. The last rally worth mentioning was from the low of 290 in September to 342 in December. That was turned back by the 40-Week ma.
Each rally since has been ended by the declining 50-Day.
At 281 now, it is at a new low for the bear market that started at 570 in 2011.
We monitor commodities for opportunities as well as a guide to the global economy. Also most are relatively free-trading and generate strong trading signals that have generally been reliable. However, the main instruction from chronic weakness in commodities in the face of remarkably belligerent central banking is that their intuitive theories and bureaucratic rituals have not been obtaining the expected robust economy. When will they admit that there is a problem with the theory?
Precious Metals
The sector started with a robust rally out of Christmas. GDX rallied from a low of 17 to 22. This was on our “rotation” theme and it was too much, too soon. It ended at the 200- Day ma. The next low was 17 and the next high was 21.90 in the middle of May. This also ended at the 200-Day.
Our November “Special” on the sector reviewed that for a bottoming process, gold stocks would have to outperform the bullion price. This has replicated the action in gold stocks, but with five attempts to get through the 200-Day. After a good beginning, the inability to break out has been a negative.
Last week’s conclusion was that if it declined below the 50-Day it would indicate the direction of the trend. It did and this is negative.
Also noted last week was that the Daily RSI on the silver/gold ratio had reached 74. Anything towards 80 indicates dangerous speculation and we used this to advise that the play had become “somewhat overdone”.
The 50-Day was taken out and it is again time to lighten up on precious metals stocks. One of the more important items in the gold story is the real price.
We keep track of it through gold’s performance relative to commodities. The rally into January as crude crashed was outstanding. From very overbought Gold/CRB slumped to oversold at the first of May. This has recovered from 5.10 on May 12 to 5.45. This is at the 50-Day and rising through it would be constructive. Above resistance at 5.62 would be significant.
Rising real prices for gold and improving gold mining operating margins have been the long-term feature of post-bubble deflations. It will eventually pull up most gold stocks. We use the gold/silver ratio to anticipate booms and contractions. With the financial boom so far this year, the ratio declined to 69.4 in the middle of the month. This was somewhat oversold on the Daily. The action has been volatile which suggests pending change. The ratio rising above 73 would turn the trend up. Above resistance at 76 to 77 would be a warning to deterioration in credit markets.
Fed GDP Forecasts
- How wrong can you get?
- How often?
- No self-criticism.
- When do they change their concepts to fit reality?

Interesting Indicator

- This is based upon the US corporate credit spread.
- The key is the change in the correlation chart at the bottom.
- This is shifted by 12 months.
- The alert is given when the correlation spikes up and then turns down.
- That occurred on February 25th and the turn down is becoming acute.
Link to May 29, 2015 Bob Hoye interview on TalkDigitalNetwork.com: http://talkdigitalnetwork.com/2015/05/asian-markets-destroying-themselves
Listen to the Bob Hoye Podcast every Friday afternoon at TalkDigitalNetwork.com
Where Does the Greek Debt Drama End?
In terms of last-minute plot twists and turns, Game of Thrones has got nothing over the ongoing Greek debt drama playing out in Europe.
As the media has constantly pointed out this week, Greece has a $339 million payment due to the IMF on Friday, but Athens has already indicated it will put off making the loan payment if a restructured deal can’t be reached with creditors.
This is followed by another 1.2 billion euro debt payment coming due over the next two weeks. And unless some 11th-hour compromise deal is reached, Greek finance ministers have already hinted that these payments may not be met either without restructuring its debt.
Meanwhile, European Union (EU) finance ministers and the International Monetary Fund (IMF) met in Berlin until well after midnight earlier this week trying desperately to come up with a plan designed to avert a Greek default. But Greece’s prime minister claims the EU’s conditions are “absurd” and “harsh punishment.
 And so it goes … the never-ending Greek bailout saga that’s been dragging on since the 2008 financial crisis continues.
The latest act of this drama has been hanging over financial markets for the past four months as sparring between Athens, the IMF and EU has intensified and deadlines have been missed repeatedly.
But don’t grab your popcorn for this Friday’s big finale just yet.
The sad truth is, the final act of the Greek debt drama may not play out until July, if even then.
You see, missing an IMF payment is not considered a big deal in global financial circles. Many deadbeat creditors have stiffed the IMF including: Cuba, Sudan and Honduras, among others.
But if Athens fails to make good on a 3.5 billion euro debt payment it owes the European Central Bank on July 20, then watch out! central bankers can be nasty when it comes to collections.
And a default would likely cause the ECB to end its emergency lending to Greek banks, a vital $88 billion dollar lifeline that is the only thing
keeping them afloat.
That possibility is already on the radar for investors, who pulled 800 million euro out of Greek banks in just two days last week, which sparked fears of a run on the banks and capital controls in Greece.
But the Greek debt drama is just a side-show compared to the debt explosion that has taken place in global economies since 2007. My friend and very astute money manager Bill Hall recently commented on this as he pointed out the world is more deeply in debt now than at any time in history, as you can see in the graphic below.

Worldwide debt has ballooned by a whopping $57 trillion since the financial crisis. This includes all categories of debt including: government, corporate, financial sector and household debt.
While it’s true that the pace of consumer debt growth has slowed since 2007, it is expanding still. And much of the “slack” has been taken up by an unsustainable increased in government debt, which has expanded at a compound rate of nearly 10% annually!
It’s just astonishing to me that there has been ZERO debt payback over this period. And it’s no surprise why the global economy has been expanding at such a slow pace in recent years – with negative GDP growth in the U.S. last quarter.
In fact, the world is more deeply in debt today than it was then during the worst days of the crisis. And slow growth is the inevitable consequence of this debt overhang.
In the immortal words of Jimmy Buffett, “where it all ends I can’t fathom my friends.”
But for clues about how badly it may all end someday, just keep a watchful eye on the thrilling final act of the Greek debt drama. It’s liable to be more thrilling than Game of Thrones because the truth is always stranger than fiction.
Good investing,
Mike Burnick


-
I know Mike is a very solid investor and respect his opinions very much. So if he says pay attention to this or that - I will.
~ Dale G.
-
I've started managing my own investments so view Michael's site as a one-stop shop from which to get information and perspectives.
~ Dave E.
-
Michael offers easy reading, honest, common sense information that anyone can use in a practical manner.
~ der_al.
-
A sane voice in a scrambled investment world.
~ Ed R.
Inside Edge Pro Contributors

Greg Weldon

Josef Schachter

Tyler Bollhorn

Ryan Irvine

Paul Beattie

Martin Straith

Patrick Ceresna

Mark Leibovit

James Thorne

Victor Adair