
Timing & trends
 As people continue to digest breaking news out of Greece and around the world, the Godfather of newsletter writers, 90-year-old Richard Russell, warned that big money is preparing for a devastating worldwide collapse. He also discusses what this will mean for major markets.
Richard Russell: “The most important lesson in investing is never to sustain a big loss. With this in mind, I have and still do advise my subscribers to be out of all common stocks except for gold shares, and to be positioned in silver and gold bullion, holding the actual metals in a safe place. I also like the Central fund of Canada, CEF, which holds actual silver and gold in what I consider a safe place — Canada.
….read more HERE

Global stock markets were higher again last week…Europe and Asia (especially China) have rallied strongly the past two months while US markets have gone broadly sideways. Chinese “investors” have been opening 1.5 million new stock brokerage accounts every WEEK for the past two months…the Shanghai Index is up ~37% since early February…up 68% in six months…the German DAX is up 28% YTD…while the S+P 500 is up only 2.5% YTD…the VIX at a 5 month low.
European sovereign bonds continue to rally…with the ECB on a bond buying spree. Yields on gov’t bonds issued by nearly every European country are lower or substantially lower than yields on US Treasuries. For instance, 10 year Treasuries yield 1.95%, compared to 0.23% in Holland, 1.2% in Spain, 0.16% in Germany, 0.36% in Sweden.
Divergence: Markets psychology continues to be driven by divergent Central Bank policies. The USA is on a tightening path while the Rest of The World is easing. This divergence (and local Central Bank money printing) is the reason that foreign stock and bond markets are significantly outperforming American markets.
Currencies: this divergence is also boosting the US Dollar against other currencies. The US Dollar Index rose ~3% last week while the Euro was down ~3.5%.

Recent weak US economic data: triggered a mild correction in the US Dollar from mid-March to Easter…after it had soared to 12 year highs. The recent weakness caused market psychology to consider that the Fed, 1) will not raise interest rates, 2) will raise rates at a later date, 3) will be very timid about the speed and the amount of any subsequent rate increases. In addition to the mild correction in the USD, there was a rally in US bonds and a rally in the US Dollar price of commodities…especially gold and crude oil.
Our view: Our primary market opinion is that the US Dollar will continue higher relative to most other currencies…because there is a significant divergence between America and the rest of the World…in terms of economic growth and opportunity and therefore in terms of monetary policy. We expect this divergence to increase…we expect that the recent economic weakness was temporary and that the American economy will be stronger in the quarters ahead…with market psychology then beginning to imagine that the Fed may raise interest rates more (rather than less) aggressively.
We expect the global supply of crude oil to overwhelm demand. We expect WTI prices will drop.

We thought we saw signs of weakness in the broad US stock market…however we only took small short positions…out of respect for the powerful uptrend that has been in place for the past six years…and we are now close to ‘throwing in the towel” on this trade. We think the stock market will fall if/when the market perceives Fed tightening to be more aggressive than current expectations…but timing is everything in trading and we appear to have “jumped the gun” on this trading idea….although…the runaway Chinese market sure looks like the sort of thing you see before a big break!

Short term trading: We remain short of CAD, WTI Crude and US stocks. We added to our short CAD positions last week and established new positions short the Yen.


 The recent stock market volatility has caused the major averages to lose nearly all their gains for 2015. However, it is clear stock prices are still extremely overvalued by virtually every metric, especially when viewed in the absence of GDP and earnings growth.
For starters, the Cyclically Adjusted PE Ratio on the S&P 500 is currently 27, whereas the normal level for this longer-term valuation metric is just 15. Also, the ratio of Total Market Cap to GDP is currently at 125%. This reading, which measures the value of all stock prices in relation to the economy, is the second highest in history outside of the tech bubble and is far above the 110% level witnessed in 2007. And with a median PE ratio of all NYSE stocks at a record-high 22, there can”t be any doubt that stock prices are at extreme valuations.
But these lofty valuations sit atop negative earnings growth and a faltering economy. The Atlanta Fed”s GDP model currently shows Q1 2015 economic growth will come in at a paltry 0.2% annualized rate. And S&P Capital IQ predicts Q1 earnings will fall 2.9%, while also projecting Q2 earnings growth will contract 1.8%.
So how can stock prices remain at record high valuations; given the fact such levels seem egregiously ridiculous within the context of no growth? The answer is simply that central banks have given investors no other alternatives. Banks pay you zip on your deposits and sovereign debt offers little return–even when going out 10 years on the yield curve.
Central banks have forced investors to play musical chairs with their money; but this dangerous game has millions of players and just a handful of chairs. When the music finally stops investors will find that bids for stocks have become very rare.
There are three very specific conditions that will warn investors when a spike is about to be driven through this massive equity bubble — and, if heeded, will give you a chance to pounce on one of those few remaining bids for stocks at these incredible levels.
The first is a U.S. recession. To be clear, domestic growth in Q1 will already be close enough to zero to get us halfway to a recession. The carnival barkers on Wall Street have jumped on the weather excuse once again and have bought the markets of few more weeks. However, once April economic data is announced, it must clearly display to investors that first quarter”s flat GDP print was simply caused by another cold winter. If it does not, the negative earnings growth in Q1 will then be extrapolated to Q2 and will convey to investors that the Fed was unsuccessful in providing sustainable growth after 7 years of ZIRP. Now that QE is no longer levitating stocks (and the Fed is actually threatening to raise interest rates), the markets will finally succumb to the massive weight of record-high valuations that have been erroneously built on top of anticipated rapid growth that never materialized. If April”s data on Durable Goods, Industrial Production, Factory Orders or Retail Sales is reported with a minus sign, investors should run for the exit.
The second indicator that the equity bubble is about to explode will be if the Fed actually starts raising rates. Of course, some pundits will be quick to point out that just one 25bps rate hike won”t be enough to derail the equity bubble because rates will still be very low. However, the Fed will be embarking on a rate hike campaign into a market cycle of deflation and slowing growth. Normally, the Fed raises rates to combat inflation, which has started to send long-term rates much higher. But, this time around the Fed will be hiking rates just to prove it can get off the zero bound range it has been stuck on since 2008. Or, because the unemployment rate dropped below the Fed”s arbitrary, Phillips-curve line in the sand, where inflation is supposed to magically materialize. This means the Ten-year Note, which has already dropped below 2% due to deflationary forces, would most likely fall even lower. Since the Effective Fed Funds Rate is currently at .12%, it will only take a handful of 25bps rate hikes before the yield curve flattens out and banks find it unprofitable to make new loans. Once this occurs, the money supply contracts and the markets and economy go into a tailspin. Unless the Fed makes it abundantly clear that its first rate hike is not part of any protracted campaign, look for investors to quickly anticipate an inverted yield curve and to start panicking out of stocks.
Finally, the third spike for this market bubble will be if U.S. Benchmark interest rates were to rise above the 3% level. This could occur if the Fed is finally successful in creating inflation. Or, more likely, when investors lose confidence in the U.S. to easily service the debt. Total Non-financial debt has surged $9.5 trillion (30%) since the Great Recession of 2007. Any significant increase in borrowing costs would quickly derail the fragile consumer who is already suffering from a lack of real income growth. And, increased borrowing costs for the U.S. government would lead to much higher budget deficits. A Ten-year Note that eclipses 3% would quickly topple the fragile real estate market and also begin to offer significant competition for stocks. The last time U.S. rates spiked from 1.5%, to above 3% was April 2013-January 2014. And this was the real cause for GDP growth to fall to -2.1% in Q1…not the weather.
Until one of these conditions are met the markets may continue to surge further into record-bubble territory. However, investors should pay close attention to April”s economic data, the Fed”s strategy surrounding its first rate hike, and also keep a close eye on the long end of the yield curve. That is, if they want to avoid getting consumed by the third massive collapse in equity prices since 2000.
 A number of emails have come in and all seem to be astonished that there is more than one type of financial crisis. Not even the famous Tulip Crisis was domestic. Tulips were also trading in London. It was the first speculation coming out of the Dark Ages as the middle-class developed. Capital poured into Holland from all over Europe. This was not just a Dutch domestic event that you could attribute to banks.
A Debt Crisis unfolds when government defaults, which has taken place many times throughout history. It is the Sovereign Debt Default that wipes out the bankers. Even the Medici had an internal code not to lend to governments for every banking institution from the 1200s up were destroyed by government defaults.
Banking crises have taken place when there is fraud. Merely lending money even leveraged will not cause a banking crisis. Asset values swing up and down and it’s the net movement between the currency and asset values that cause the problem like the silver to gold ratio. The drop in the Swiss peg suddenly raised the cost of mortgages to Greeks and Brits who denominated their debts in Swiss. Banking crisis due to outright fraud is what Andrew Jackson set in motion with destroying the central bank and state banks then issued money known as Wildcat Banking.
Then there is the currency crisis. This unfolds typically because governments have tried to fix the value of gold or silver. Bretton Woods collapsed for this reason just as the Swiss peg collapsed recently. Currency is the least understood because everyone looks to cause and effect scenarios that are only domestic – never international.

These are the three major categories. You cannot attribute every crisis to a failure of banking. The Long-Depression was cause by the US trying to over-value silver relative to gold. You cannot fix any two elements no matter what.
Stock Markets
On this week’s release of NYSE Margin Debt, Business Insider headlined “Traders are betting on stocks with tons of borrowed money”. As noted on our last review, the pattern has been a compulsive peak in margin and a correction in the amount and the stock market. Then the peak for the stock market would be set on the secondary high for margin debt.
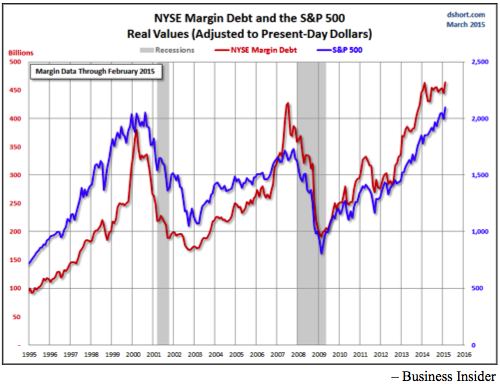
Clearly the action is working on the secondary high in margin, which is a rare “test” of the initial high. Yet another measure of extreme speculation.
And ecstasy in measurable amounts has been registering since June, which suggests the only why out is down.
Of course there has always been a compelling reason to buy or remain complacent. In 1873 it was that the Treasury System on a fiat currency was superior to a central bank constrained by gold. In 1929 the comfort was that the old and dreadful Treasury System had been replaced by a new and “scientific” central bank. In 2007 it was that the Fed had a “Dream Team” of economists.
That covers recent great financial bubbles and it is worth reviewing a “normal” bull market whereby the stock market typically peaked 10 to 12 months before the business cycle peaked. Investors stayed long as the market was declining because business and economic numbers were good.
However, this changes during the era of financial asset inflation when stocks and the business cycle peak virtually together. NBER determination of the US business cycle starts in 1857 and the examples are 1873, 1929 and 2007.
On March 19 Zero Hedge headlined “Philly Fed Signals Worst Margin Compression Since Lehman”. The conclusion was that the last two examples of profit margins plunging a recession soon followed. Going along with this, S&P Earnings are recording the sharpest drop since July 2007.
OK, the cycle for business activity and share certificates is mature and becoming precarious. Perhaps because of impatient central bankers the action is more precarious than otherwise. The extra leg up in margin debt is saying as much.
Maybe there should be an ETF on “precarious” but then the equivalent could be ETFs on volatility, the VIX.
It is worth updating the ChartWorks in February review of the old Dow Theory. At that point it had been six weeks of “non-confirmation” since both the DJIA and Transports had both set highs. In which case, the price correction would be moderate. Anything longer and the degree of correction would increase. Non-confirmation ran 10 weeks so a more significant decline would be possible.
The Dow high was set at 18288 at the end of February and it has slipped to below the 50- Day ma. At 17698 it is close to the 200-Day which is at 17339. The last correction got well below the 200-Day and concluded in October with a Springboard Buy. Whatever, it is not oversold now.
Transports set their high at 9310 in December and have gently slipped below the 200-Day at 8661. The action is not oversold.
The NYSE comp (NYA) continues on its big Rounding Top pattern. This index as well as the senior indexes set a False Breakout in late February. That was accompanied by the most bullish sentiment since 2007 and least bearish since 2000.
Extreme sentiment is one concern, which with the False Breakout, suggests the last gasp of exhausted speculators.
In the fateful year of 2007 the market cap of global equities reached $60 trillion. The crash took it down to $25 trillion and now it is at $80 trillion. Numbers are rounded.
Credit Markets
After great enthusiasm, US credit spreads reversed on the seasonal schedule in June. Widening became extreme in January as forced selling of crude oil maxed out. The rebound became very overbought into March and the spread has been trading either side of the 50-Day ma. This could continue through April. But a marked decline below the line would be an alert to further widening.
As the US expansion became somewhat more vigorous the curve has been flattening. It could run for 12 to 16 months and then roll over indicating contraction. This worked for us in 2000 and in 2007 when the boom was strong enough to invert the curve. But full inversion is not required, just the reversal to steepening would be noteworthy. April is Month Fourteen on the trend.
In a financial mania the turn to steepening was a killer at the end of the last two booms. In each example the turn was accompanied by the equivalent turn in credit spreads. This time around spreads reversed in June and the curve has yet to reverse. Both could be reversed by around mid-year.
In the meantime, long Treasuries became very overbought in January and corrected some 10 points into early March. The low price was 143 and the rebound has made it to 149. The season is favourable through April.
On the longer term, the rally to the high was described as “Ending Action”. A significant bear could follow.
Commodities
Once it started, the plunge in crude oil had a possible run of 6 or 7 months, which counted out to January. Months of choppy action would be probable, which could affect the action of other commodities.
However, our Brief Update of March 24th noted that a “rotation” into some depressed commodities was possible. It would not be as strong as the one out of January 2014.
The low on the CRB was 207 on March 18th and the initial bounce made it to the 50-Day at 220 last week. The subsequent low was 211 yesterday morning and it looks like it could rally through April.
Within this, base metals (GYX) set their low at 300, bounced to 324 last week, which was above the 50-Day. It is still above the line, which is constructive. Through 324 and the rally could make it the 335 level.
Grains (GKX) are working on the same pattern but the initial bounce did not make it above the 50-Day ma. The low was 289 and now at 300 getting above the 50-Day at 305 would be constructive.
Crude is also in the pattern and at 50 it is slightly above the 50-Day. Getting above the last high of 52.48 would be constructive.
Precious Metals
Action in the precious metals sector continues without lustre.
Lustre is elsewhere. Canada’s Financial Post headlines “Taking Investing to the Margins”. Canadians are margining houses and stocks to be in the hot action. Reported as the greatest employment of leverage in fifteen years. Over in China, inexperienced customers are opening brokerage accounts at the rate of 1.5 million – per week – as their stock market soars. This last made headlines in 2007.
It is ironical that the Fed and gold bugs both desperately need dollar depreciation. But the Fed can no longer get the “bang for the buck” regarding inflation. Instead there has been the equivalent of hyper-inflation in stocks and bonds, which is again demonstrating that the public decides what the public decides to speculate in. This is getting close to burning out when Mister Margin makes the tough decisions.
Some improvement in commodity prices into May is possible. This could help the dollar price of silver and gold. It would be constructive to have gold shares continuing to outperform the bullion price. This set a good low as crude’s crash ended in January. Earlier rallies were constrained by the 200-Day ma, which is declining. The rebound from last week’s low has to work its way above the 50-Day for the action to become positive.
The overall condition remains that the party is still in orthodox investments, which is highly leveraged. The un-party continues in precious metals where we hope there is minimal leverage employed by either bulls or bears. We also hope that at some point all of the inflation bugs will have been shaken out of the sector.
Then it can go up driven by improving returns as gold’s real price continues to rise. We have been buying some gold stocks into weakness, but are not fully invested.
Link to March 31 Bob Hoye interview on TalkDigitalNetwork.com:

-
I know Mike is a very solid investor and respect his opinions very much. So if he says pay attention to this or that - I will.
~ Dale G.
-
I've started managing my own investments so view Michael's site as a one-stop shop from which to get information and perspectives.
~ Dave E.
-
Michael offers easy reading, honest, common sense information that anyone can use in a practical manner.
~ der_al.
-
A sane voice in a scrambled investment world.
~ Ed R.
Inside Edge Pro Contributors

Greg Weldon

Josef Schachter

Tyler Bollhorn

Ryan Irvine

Paul Beattie

Martin Straith

Patrick Ceresna

Mark Leibovit

James Thorne

Victor Adair