
Timing & trends
The action in a number of markets reached some stressed out levels. This showed up in the Downside Capitulation in The Canadian dollar. At the end of January that was on the daily, weekly and monthly readings. The low then was 78.13. The rise was to 80.88 and last week’s low was 77.92, which looks like a good test. Now it is up to the 50-Day ma and getting above would be constructive.
Crude oil has been trading with the $C, or the other way around, and seemed have concluded a test last week.
Our March 19th Memo noted that the “Ides of March” target of a tradable low on gold seems to have worked out and the rally can continue on what could be an intermediate move. What is again needed in this department is gold shares to be outperforming the bullion price and silver to be outperforming gold.
Both seem underway as the gold/silver ratio has jumped from .132 to .143, which is fast.
Base metals (GKX) have also completed the test last week and have jumped. Much the same holds for the grains (GKX). The overall index, the DBC has been working on the same pattern.
Our last Pivot was dated March 12th and it was looking for a “pause” in the hot dollar action. The decline and associated rallies on commodities makes sense to us and could be another “Rotation”. The hot stuff gets tired and the boring, perhaps terrifying items come back from the dead.
Getting through some moving averages will help and with that the action could run into May.
It is uncertain how the senior stock indexes will perform, but the ChartWorks has noted that the Biotechs (IBB) which have been super-flyers have clocked a rare Trifecta Sell.
BOB HOYE, INSTITUTIONAL ADVISORS – WEBSITE: www.institutionaladvisors.com

China to Take the Reins in Funding Regional Infrastructure Projects
This Tuesday marked the last day that countries could submit their applications to become founding members of the new China-led Asian Infrastructure Investment Bank (AIIB). As of this writing, a little over 40 nations have either already been approved or have applied for membership, including strong U.S. allies such as Britain, Germany and Australia.
Notable absentees, as you can see below, are the U.S. and Japan.

Conceived to serve as an alternative to Western-dominated sources of credit such as the World Bank, International Monetary Fund (IMF) and Asian Development Bank, the AIIB will aim to invest in regional infrastructure projects ranging from energy to transportation to telecommunications.
The new development bank, which is expected to launch later this year, will have $100 billion in capital to
begin with—a massive mountain of money, to be sure, but it falls far short of the estimated trillions that will be necessary to fund Asia’s astronomical infrastructure demand.
China’s creation of its own global bank highlights the country’s desire to wield more control over funding such projects. It currently commands only 5.17 percent of the vote in the World Bank and 3.81 percent in the IMF.

And so the currency wars continue to heat up. China’s move demonstrates its ongoing efforts to establish the yuan as a global reserve currency on par with the U.S. dollar. It’s no secret that the country wants the yuan to become part of the IMF’s Special Drawing Right (SDR), a composite currency unit that now consists of the dollar, Japanese yen, British pound sterling and euro. The founding of the AIIB might very well bring the country closer to realizing these goals.
A-Shares Headed Higher
Chinese stocks are currently having a moment. Mainland A-shares, as measured by the benchmark Shanghai Composite Index, are up an incredible 92 percent for the 12-month period on the back of strong recent performance in the financial, property and infrastructure industries.
There’s generally a high correlation between the A-share market and China and Hong Kong, but the A-shares have outperformed by a wide margin over the past year.

Last Wednesday the index fell a slight 0.8 percent, ending a 10-day rally that contributed 12 percent, its longest winning streak in 23 years.
Chinese policymakers have recently eased quota controls for foreign investors in mainland stocks and bonds, as they promote the yuan to be accepted as an SDR. The potential for greater inflows into the market should help the Shanghai Composite head even higher.
Our China Region Fund (USCOX) has participated in this rally through the Morgan Stanley China A Share Fund and a closed-end fund.
Read more about China:
- China Consumes More Gold Than the World Produces
“What’s not so well-known—but just as amazing—is that China’s supply of the precious metal per capita is actually low compared to neighboring Asian countries such as Taiwan and Singapore.” - China Just Crossed a Landmark Threshold
“One of the most headline-worthy developments is China’s $16.3-billion infrastructure initiative intended to revive trading routes along the centuries-old Silk Road. Thousands of miles of railways, roads and pipelines will link Beijing to major markets all over Asia, Africa and Europe.” - China Wants to Conduct the World’s High-Speed Rail Market
“In recent months, Chinese Premier Li Keqiang has emerged as the nation’s top salesman for what he calls the ‘New Silk Road’—miles upon miles of high-speed transportation connecting all corners of the world. His plan might very well become one of China’s most lucrative exports and culturally significant contributions to the world: fast, efficient and reliable railways.”
WHAT EXTREMES?
The S&P 500 Index has tripled in 6 years, is overbought, and at an all-time high. See graph showing 7 year cycle highs and overbought indicators.

Earnings do not support the high valuations of US stocks. Note the extreme valuations as shown in the graph below, courtesy of Arabian Money.

Interest rates are currently at multi-generational or all-time lows and consequently bonds are extremely high in the “bubble-zone.” Many European banks and sovereign governments are “paying” negative interest. Unthinkable a few years ago!
The dollar index rallied over 25% between May 2014 and March 13, 2015 – an exceptional and parabolic rally, particularly considering the precarious financial condition of the US government and the Federal Reserve. See article here from Laurence Kotlikoff.

Derivatives, depending on who is counting, are approximately $1,000 Trillion globally. This extreme bubble is growing. All bubbles eventually pop.
Leverage in the financial system is more extreme than in 2008, before the “Lehman moment” crash in which the global financial system nearly froze.
The “Warren Buffett Indicator” is flashing a warning – equity valuations are high compared to GDP. See graph below.

The Bloomberg Surprise Index is flashing a warning.

There are many more extremes that could be shown, but consider a few specifics.
Robert McHugh has listed a sequence of Fibonacci turn dates at the end of March and early April 2015. Risk of a stock market crash or important correction seems high in this time period.
Markets often turn around solar eclipses. We experienced a solar eclipse on March 20.
Greece will exit the Euro. The issue is not Greece, the Greek people, their economy, or austerity, but paybacks to various banks, mostly French and German. The piper and the bankers must be paid or banking cartel profits will be decreased. Banking cartel profits are used to “influence” politicians, so politicians listen to the needs of bankers. It is an old story…
We have many economic and political extremes in our current world. Perhaps this time will be different, but I doubt it. Plan on:
- Debt will increase until a “reset” occurs.
- Politicians will “extend and pretend” and make MANY promises.
- The S&P has enjoyed a large rally in the last 6 years. It will correct.
- Bonds are in a massive bubble, partially created by the low and negative interest rates forced upon the system by central banks. All bubbles eventually burst.
- Gold and silver and their stocks have been beaten down for nearly four years. They will rally to new highs.
Gary Christenson
The Deviant Investor
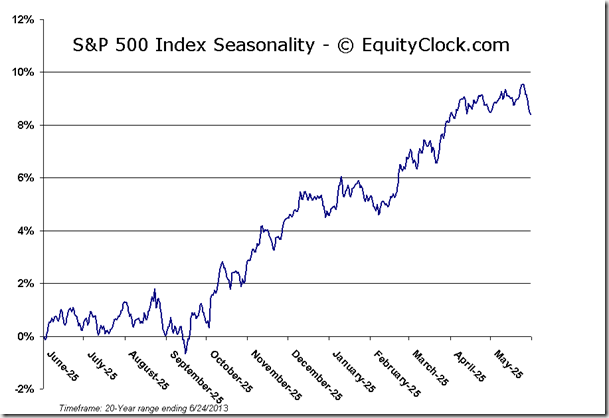
Equity markets and most sectors entered into a brief period of weakness last week. Economic news (ISM and Employment reports) will drive equity prices this week. Beyond this week, seasonal influences turn strongly positive (possibly due to anticipation of good news released by CEOs at annual meetings when they release “difficult” first quarter results e.g. stock splits, share buy backs, dividend increases). Preferred strategy is accumulate seasonally attractive economically sensitive North American and internationals equities on weakness this week for a seasonal trade lasting until at least May and possibly into July.
Seasonal influences are weak during the last two trading days in March, but turn strongly positive in April. In fact, the two strongest periods for U.S. equity indices during the year are the two week Christmas rally near the end of the year and the first two weeks in April. Average gain by the Dow Jones Industrial Average during the first two weeks in April since 1955 is 1.22% per period.
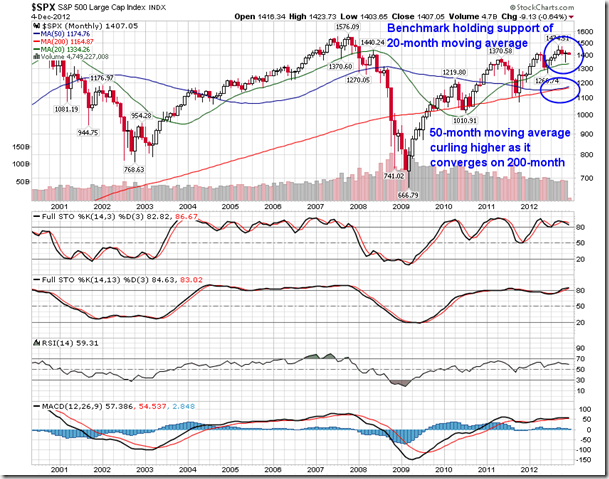
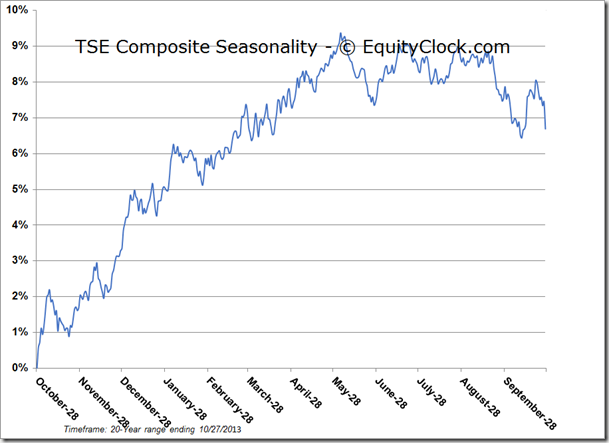
…below is commentary plus seasonal and price charts for the S&P500 & the TSE composite. To continue reading and viewing all 45 charts including commodities, currencies and interest rates go HERE
The S&P 500 Index lost 52.96 points (2.23%) last week. Intermediate trend remains up. The Index remains below its 20 day moving average. Short term momentum indicators are trending down.

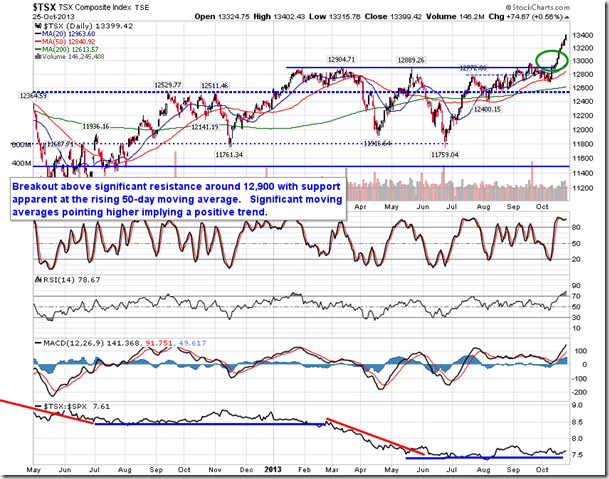
The TSX Composite Index lost 129.99 points (0.87%) last week. Intermediate trend remains down (Score: 0.0). The Index remains below its 20 day moving average (Score: 0.0). Strength relative to the S&P 500 Index changed to Neutral from Negative (Score: 0.5). Technical score improved last week to 0.5 from 0.0 out of 3.0. Short term momentum indicators are trending down.
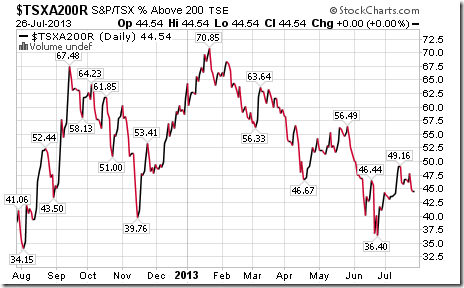
…continue reading and viewing 45 charts including commodities, currencies and interest rates HERE
It’s been a lousy year so far for US stocks.
The S&P 500 is as flat as a pancake year to date.
But if investors are worried, it’s not showing up in the so-called “fear index,” the CBOE Volatility Index (VIX).
The VIX tracks the options market’s expectation for volatility (aka price swings) in the S&P 500 over the next 30 days.
In the dark days of 2008, the VIX spiked to above 80 points. As a rule of thumb, when the VIX is above 30, it tells you that investors see a lot of volatility ahead in stocks, as a result of fear or uncertainty. When the VIX is below 20, it tells you investors are less worried – and even complacent – about the future.
As you can see below, right now complacency is the name of the game.

So far this year, the VIX has barely broken a sweat, never rising above 23.
But just because most investors are complacent doesn’t mean you should be.
Ed Note: Here is the long term chart of the VXX (iiPath S&P 500 VIX ST Futures ETN – VXX)


-
I know Mike is a very solid investor and respect his opinions very much. So if he says pay attention to this or that - I will.
~ Dale G.
-
I've started managing my own investments so view Michael's site as a one-stop shop from which to get information and perspectives.
~ Dave E.
-
Michael offers easy reading, honest, common sense information that anyone can use in a practical manner.
~ der_al.
-
A sane voice in a scrambled investment world.
~ Ed R.
Inside Edge Pro Contributors

Greg Weldon

Josef Schachter

Tyler Bollhorn

Ryan Irvine

Paul Beattie

Martin Straith

Patrick Ceresna

Mark Leibovit

James Thorne

Victor Adair