
Timing & trends

REPORT —————
We are not only living with a bull market in gold, we are living with a potentially monster bull market in gold! The message is loud and clear. All we have to do in order to see this clearly is ignore the fumbling and mumbling of active daily and weekly traders – be they amateurs or so called professionals.
We won’t see this long term corrective pattern very often, if ever, in any stock or commodity. However, leave it to gold and silver to show us the way via this magnificent indication of what we are about to witness. Oh yes, and leave it to the Federal Reserve to be the cause that helped produce this effect.
Simply align the quarterly charts of gold, silver, the Dollar Index, and the Dow Jones Industrial Average and you will see the handwriting on the wall.
Welles Wilder’s Delta Long Term turning points are the icing on the cake. This is the type of icing that only Mother Nature can make. You know the expression:
DON’T MESS WITH MOTHER NATURE.

Indeed it is a rare occasion when a correction in a bull market ends at a higher price than it was when the correction began. That is what gold has accomplished. The extent of the move to follow this type of correction should be monumental and not soon forgotten. We should expect a historic rise in price. The rise in the price of gold should take the entire precious metals complex to unimagined heights not yet recognized.
Running flat


….continue reading this 10 page thorough reoport with larger charts HERE

BIG PICTURE – During the previous year, the stock markets of the developed world consolidated whereas the majority of the developing nations performed poorly.
In 2014, the European stock markets essentially traded sideways, Japan produced modest growth and unsurprisingly, Wall Street delivered the best returns. Over in the developing world, the commodities producing nations (Brazil and Russia) fared badly, whereas China, India, Philippines and Thailand produced decent growth.
It is notable that over the past 12 months, a number of our expectations were met as the US Dollar strengthened, the Euro and Japanese Yen weakened considerably, stocks in the US did reasonably well, high yield bonds ended their epic bull run and commodities as well as precious metals took it on the chin! Finally, over in the emerging world, both of our preferred stock markets (China and India) did very well.
So, as we start this year, we wish to set out our expectations for the following 12 months.
Although there are no guarantees in the investment business, we are of the view that last year’s trends will probably continue over the following months, so you may want to remain over-weight stocks in the developed world. Elsewhere, we suspect that the US Dollar will continue to make headway against the majority of the world’s currencies and this will benefit American assets.
If you review Figure 1, you will note that the US Dollar Index has recently broken out of a huge trading range and climbed to a multi-year high! Usually, such breakouts are followed by explosive moves in the direction of the prevailing trend; so we should expect a big rally in the greenback. As you can see from Figure 1, at the turn of the millennium, the US Dollar Index topped out at 121.21 so at the current level (91.82), there is plenty of scope for additional gains.
Figure 1: US Dollar Index (weekly chart)

Source: www.stockcharts.com
If our assessment proves to be on the mark and the world’s reserve currency appreciates, it will drive capital to the US; thereby benefiting American bonds, real-estate and stocks. Furthermore, the ongoing strength in the American economy should also attract investors’ interest and this is why we recommend an over-weight position in the US.
Over in Europe, we suspect that at some point in the not too distant future, the ECB will unleash its own version of quantitative easing and this will drive up equities at the cost of the single currency. Remember, the European economy is still struggling and with the recent plunge in the price of oil, deflation has become a genuine threat. Thus, it is probable that the ECB will announce some form of ‘stimulus’ this year and it should benefit European stocks.
If you observe Figure 2, you will see that the Dow Jones Euro STOXX 50 Index is currently trading significantly below the highs recorded in 2000 and 2007; so there is sufficient upside potential for this recovery candidate. Should Mr. Draghi commence a wide scale bond buying program, European stocks will come to life. Accordingly, we recommend some exposure to this part of the world.
Figure 2: Dow Jones Euro STOXX 50 (monthly chart)

Source: www.stockcharts.com
Over in Asia, we continue to feel that the Japanese stock market will do reasonably well over the following months, so our readers may want to gain some exposure. After all, the Japanese policymakers are aggressively trying to stimulate the economy and this is driving up equities at the cost of the Japanese currency. Although we do not believe that Japan will regain its competitive edge anytime soon, we believe that quantitative easing will benefit local equities (especially, the exporters which become more competitive from a falling Japanese Yen). Thus, modest exposure to Japanese stocks is recommended.
In the emerging world, we are of the view that the commodity-producing nations will continue to suffer due to the ongoing primary downtrend in hard assets; so these stock markets may underperform over the following year.
Conversely, nations which are massive importers of oil will get tremendous assistance from the recent plunge in crude and their stock markets are likely to appreciate.
In terms of specifics, we believe that both China and India will benefit a great deal from the slide in the prices of commodities, so their stock markets should (once again) deliver good returns this year. It is worth noting that although India’s stock market has already appreciated by approximately 2½ times since the bear market low, China’s stock market (Shanghai Composite Index) has only recently come out of a 7-year bear market and it has appreciated by just 80% from the recent low! More importantly, the Shanghai Composite Index is still trading approximately 45% below its all-time high recorded in 2007; so there is lots of room for additional gains.
If you review Figure 3, you will see that the Shanghai Composite Index has just broken out of a 3-year trading range and once the 2009-high is overcome, we will probably get a big advance. Furthermore, you will observe that during the previous bull market, the Shanghai Composite went up approximately 600% in less than 3 years, so it is conceivable that we may also see some impressive fireworks in the current primary uptrend.
Figure 3: Shanghai Composite Index (weekly chart)

Source: www.stockcharts.com
China bulls may want to take heart from the fact that last month, investors on the mainland opened 2.7 million new stock trading accounts and since retail trading volume accounts for 80% of total transactions, this can only be seen as a positive development.
Although we do not possess a crystal ball, we believe that over the following months, we will witness an epic stock market mania in China! Similar to the last bull market, tens of millions of new trading accounts will probably open up and before it is all over, taxi drivers will proudly boast about their exploits in the stock market. Needless to say, when that happens, the bull market will be very mature and the painful end will be around the corner. Fortunately, we are still several months away from such a euphoric blow-off phase and in the meantime, there is a real opportunity to profit from China’s bull market.
Bearing in mind the above, we have allocated some capital to China’s A-Shares and over the past few weeks, these positions have produced a very good return. In the same vein, we suggest that our readers also consider getting some exposure to China’s domestic stock market.
Now that we have given you our outlook for the stock and currency markets, we want to briefly discuss the state of the commodities market. You will recall that we first turned bearish on the sector in late 2011 and since then, commodities have been in a persistent downtrend.
Even though prices have declined for almost 4 years, we suspect that we are only halfway through this primary downtrend. From our perspective, the macro-economic environment is not conducive to a sustainable bull market in commodities and this is primarily due to weak aggregate demand and ample supplies. More importantly, the US Dollar is in a primary uptrend and this should continue to weigh down on the commodities complex. After all, commodities are denominated in the world’s reserve currency, thus their prices are inversely correlated to the direction of the US Dollar. If the greenback continues to advance over the following months, this will probably create a significant headwind for commodities and precious metals. Accordingly, we believe that this is not the appropriate time to have any significant exposure to hard assets as the coming year will probably disappoint investors.
If you review Figure 4, you will note that last summer, the Reuters-CRB Index (CCI) sliced through an important area of support and by falling below the 500 level, it commenced another down leg in its primary bear market.
The CCI is currently trading at the same level as the 2010-low; so a near term bounce cannot be ruled out. However, the path of least resistance remains down and we are likely to witness further declines in the prices of commodities.
Figure 4: Reuters-CRB Index (weekly chart)

Source: www.stockcharts.com
In addition to commodities, we suspect that the prices of precious metals will also drift lower over the following year. Therefore, this may not be the best time to gain exposure to the metals.
Last but not least, as far as bonds are concerned, we are of the firm view that the high yield corporate bond market topped out last spring and we are now in the early stages of a lengthy bear market. Elsewhere, we believe that capital will continue to migrate towards US government bonds, so the ongoing rally will probably continue in 2015.
In summary, apart from the periodic counter-trend moves, we suspect that last year’s trends will continue this year, so our readers should refrain from swimming against the tide. For our part, we have allocated our managed portfolios to our preferred investment themes and it is our contention that these strategies will perform well this year.
Finally, in terms of sectors, we are seeing ongoing strength in the cyclicals (airlines, asset managers, auto parts, clothing, footwear, railways, retail and restaurants), therefore we have concentrated our equity portfolio in these areas.
 The Swiss National Bank (SNB) shocked currency markets Thursday of this week with a policy decision that crippled the Euro-Franc cross. Their announcement sent the franc soaring 30 per cent against the euro before settling lower, (still 16 per cent stronger) into the end of the week. This was as the SNB abandoned their 1.20 franc peg they’ve been defending since September of 2011, coincidently when the gold market peaked at over 1,900 USD per ounce. The decision by the SNB has far reaching implications for not only financial markets, but also for when policy becomes exhausted and policy makers themselves are rendered helpless.
The move in the Swiss franc really demands the attention of investors as it is one of the biggest, if not the biggest, single day move from a liquid western economy’s currency in modern time. Beyond the questions of the stability of financial markets and the overleveraged and crowded trades that amounted to millions of dollars in losses for investors, there are the direct losses to Swiss businesses and the Swiss economy as their exporters are heavily linked to and trade with a European market. As well, the price adjustment in the franc reminded all investors of a bid for haven assets as even gold ended the week 4.5 per cent higher.
The SNB’s decision to abandon the peg to the euro ultimately came down to necessity. The commonly watched EURUSD is down over 15 per cent over the last year, and pressure on the euro continues for multiple reasons. The first is simply the threat of deflation to the Eurozone. Stagnant growth and the trap of weak business investment and broken fiscal and monetary policy have the region looking hapless. Then if we include the probability of the European Central Bank embarking on an episode of quantitative easing and factor the likelihood of a Greek exit from the currency union, there are many downward pressures on the euro.
The Swiss franc faces the same appreciation pressures as almost all other currencies that trade directly against the euro. In order to defend their peg they’ve been maintaining for over the last three years, they had to expand their balance sheet (print francs) and buy euro denominated assets. The balance sheet of the SNB relative to the GDP of the Swiss Economy has expanded so drastically they are now the largest of any western central bank at around 80 per cent. By comparison, when the US Federal Reserve saw balance expansion to 4 trillion USD during the process of Quantitative Easing, their balance sheet to GDP ratio was around 26 per cent.
The threat for the SNB was that the size of their assets on their balance sheet would soon dwarf their economy, and their large proportion of assets denominated in euros would too heavily impact their economy from fluctuations and volatility in the euro exchange rate. As is the case with most exchange rates pegs, the market forces will eventually takeover and the outcome that the policy makers had been trying to avoid (like an overly strong franc) becomes reality.
As we see central banks like the ECB and Bank of Japan make moves that increase their influence on financial markets via balance sheet expansion, questions center on the idea of stability. Furthermore, was the market action Thursday a “one-off’, or are we amidst an environment that is setting itself up for snap price adjustments that leave investors too slow and unable to react?

 The terrorist attacks in Paris have fixated the world’s attention on the contrast between competing worldviews and what constitutes acceptable behavior in modern society. What are the principles by which society should be organized and run? Who gets to set those rules, and to what standards should others who do not believe in them be held?
While at their core these are philosophical questions, the way we answer those questions can have profound economic consequences. They are especially important to understand in the context of Europe. For today’s Outside the Box reading, I think we should look at two essays by old friends to OTB, Charles Gave and George Friedman.
Charles writes as a patrician French patriot and examines the question “[Do] France and its neighbors have a part of their population that rejects the rules on which the nation is based and wishes to build a nation under a different set of rules?”
He offers a very nuanced and thoughtful analysis of the difficulty of answering that question by means of simplistic reactions. And he comes to the uncomfortable conclusion that
As far as France and most other Western nations are concerned, it is obvious that these questions will now more than ever (in spite of mainstream politicians’ best efforts to keep them out) enter the political stream and discourse. And instead of calming tensions in an era of great economic discomfort, this will likely amplify them.
George sees the problem in terms of geopolitical analysis and through the lens of history (emphasis mine):
The Mediterranean borderland was a place of conflict well before Christianity and Islam existed. It will remain a place of conflict even if both lose their vigorous love of their own beliefs. It is an illusion to believe that conflicts rooted in geography can be abolished. It is also a mistake to be so philosophical as to disengage from the human fear of being killed at your desk for your ideas. We are entering a place that has no solutions. Such a place does have decisions, and all of the choices will be bad. What has to be done will be done, and those who refused to make choices will see themselves as more moral than those who did. There is a war, and like all wars, this one is very different from the last in the way it is prosecuted. But it is war nonetheless, and denying that is denying the obvious.”
George has written a book called Flashpoints: The Emerging Crisis in Europe, which will not be available until later in January, although he graciously sent me a review copy. I’ll get started with that one but will also go ahead and buy it in a couple weeks, so I can read it on my iPad Kindle app. I find reading books on my iPad far more efficient and easy than toting around three or four books in a briefcase. I can highlight and make notes and have them available online anywhere in the world without having to go back and search through a book that I read years ago. I know that many people relish the feel of a physical book, and I admit to that pleasure; but the pain of not being able to find a specific quote or note, or worse, not being able to find the book at all because you lent it to somebody and it’s not back on your bookshelf, is far more of a driver to make me go almost totally online.
That said, when I found out that my flights to Cincinnati and back would not have on-board Wi-Fi, I did jump into George’s book. I think it’s his best work to date. It recalls to mind so many conversations we have had over the years about the tensions in Europe, and it’s giving me a deeper understanding of a region of the world that I am really quite fond of. I suspect we will revisit George’s work in future letters. It is especially relevant to the research I’m doing for my own current book-writing project on the future of the global economy.
Cincinnati is as the Weather Channel forecasted, cold and grey with snow flurries, as I look out my hotel window. That gloom aside, I spent several hours this morning visiting with friends who run a private biotechnology startup across the river. That was a decidedly ungloomy get together, as the optimism that a cure for cancer is potentially in the offing in the not-too-distant future was evident to us all, even as they explained the (to me very frustrating) process of securing regulatory approval. Hopefully that process will come to a reasonable conclusion sooner rather than later, given that over 1,500 people a day die from cancer in the US alone (many more actually contract cancer and undergo treatment and live). The savings in human lives brought about by a cure would be incalculable, but the savings in dollars to our healthcare system and the elimination of other economic losses caused by cancer would be in the hundreds of billions. And that is just in the US.
And on that hopeful note, let’s turn to Charles and George, where the news is not as optimistic. Have a great week!
Your pondering Europe analyst,
John Mauldin, Editor
Outside the Boxsubscribers@mauldineconomics.com
Perspective
It is not just the tech sector that has entered “hyper-drive”, which is a term and convention used for a long time in the world of science fiction. While unwilling to define central banking as “science” or “fiction”, artificial-drive has been employed since the Federal Reserve System was confected in late-1913. In order to prevent bad things from happening hyper-drive has been imposed since the late 1990s.
The saddest part of the experiment is that it has been based upon arbitrary notions about how the economy “ought” to work. It is also based upon the absurd concept of a national economy. The other main absurdity is that expanding credit forces price up.
What’s been happening to commodities?
It is the other way around, soaring asset price permit credit expansions and Mister Leverage has been fully engaged in the financial markets. Not in commodities.
Politically, the US administration has been on hyper-drive on its way to “change” the American culture. This has been the most ambitious assault on the socio-economic fabric, ever, and has employed not just class warfare, but race warfare as well. This was intensified going into the November election with hopes of eliminating any kind of opposition to the Left’s endless pursuit of control.
The election resulted in the strongest Republican position since the 1920s.
Unfortunately, there is the big election in 2016 and while the control freaks were severely damaged in the polls, both kinds of warfare will be fanatically employed. Right through to November 2016.
In a boom everyone gets busy, including the political Left.
Outside of domestic politics, the global warming movement is becoming particularly frantic. That’s in the face of eighteen years of no increase in satellite measurement of temperature. In America the last three years have set successive record lows in tornado activity. The Antarctic ice sheet has set record highs and the Arctic sheet is the largest in almost ten years. A chart follows.
How long can the mania in central banking, financial markets and political markets last?
This is difficult to pinpoint, but we are comfortable in noting that economic and political nihilism will continue until it is seen not to work.
Wrap: 2014
In November a year ago, we concluded that a significant “Rotation” into depressed commodities would provide a good trade. Energy, base metals, grains and precious metals staged important lows and accomplished rallies into late spring. Each rally soared to enough of an overbought to depart the play.
This would be within the bear market that began in 2011 for most commodities.
On the interest rate side, “Rotation” would naturally be accompanied by rallies in low- grade bonds out to around May-June. We got out on the overbought. And a possible credit contraction would be accompanied by a strong dollar.
Technically in December a year ago, the bond future was poised for a rally and we are still “in” and are now looking for “ending action”.
In the stock markets, outstanding action generated Exuberance, Divergence and Volatility. The result was a correction in October for the senior stock indexes and a resumption of excesses. The full “Resolution” of such measurable excesses has yet to be realized.
Outlook: 2015
Financial markets revived out of October and recorded another set of technical excesses. Ambitious central banking will continue until denied by Mother Nature. In so many words, the notion that eternal prosperity can be obtained through eternal depreciation will get slammed by another wave of asset deflation.
Generations of veteran traders have known that concepts about fiscal and financial intervention have been just another example of utopian nonsense. The reason why it has had so many followers is that intuition is always so appealing. That’s in any century. Without knowing it Keynes “discovered” what so many intellectuals before him had discovered in previous crashes.
And that is that more credit from somewhere will make a credit contraction go away. The earliest one we have found was uttered by Edward Misselden in the 1618 to 1622 crash. The sudden change from prosperity to hardship and unemployment provokes the same policy knee-jerk. That would be from “everything is wonderful” to “we have to do something”.
In December 2007 it was the “Dream Team” at the Fed. Nothing could go wrong. In 2008 it was emergency “shovel ready” plans.
In the early 1600s, England’s government essentially duplicated the cloth-finishing business that existed in the Netherlands. It was a make work program.
A London merchant described the grand scheme as like a sepulcher – “attractive without, dead bones within”.
Milton described such folly as “Tyrannical Duncery”.
Essentially many in 2014 realized that the grand plan to “manage” the climate was just plain stupid. Quite likely as 2015 progresses the public will discover that the grand plan to “manage” the economy is just as stupid.
So where does this place the investor?
Orthodox methods of determining portfolio balances based upon conjecture about what the Fed is going to do or “ought” to do has essentially been impractical. This holds for the gold bugs as well. All that Fed recklessness “ought” to have driven gold to “five thousand”, but it did not happen. Essentially because lower-grade bonds reached the equivalent of “five thousand”. The NYSE was working on the same impetus until this week and the bond future is working on it right now.
Where will the best returns be earned?
High-grade US corporates in the 3 to 4-year maturities are an ideal position in a financial storm. Gold’s unique liquidity and financial character is also good for riding out a storm. By later in the year gold stocks could be showing superior returns.
Stock Market
“Steak, Strippers & Sweet Rides: Wall Street’s Back”
This was from a CNBC article published on January 2nd. We think it is accurate and it included advice on how to “spend a $1 million bonus”. Also noted was that automakers were selling millions of high-priced cars. (A “sweet ride” is a nice car.)
This anecdotal measure ranks right up there with the best in the long history of stock markets.
The latest surge has been based upon the benefits of weakening crude oil prices. On December 1st, the Washington post reported “Tumbling oil prices are…injecting a much- needed boost for American consumers”.
Our view has been that the plunge in oil prices and further weakness in other commodities could be signaling a global recession. This melancholy probability is being confirmed by credit spreads reversing to widening in June. Yet to confirm is the curve reversing to steepening.
Some weeks ago we ran the chart of crude’s price and recessions. The chart from The Chart Store follows and starts in 1913. Most bear markets in crude oil have been associated with a recession. Intense speculation in crude oil can leave a lot of financial damage behind.
The year closed with another burst of enthusiasm, followed by volatility.
On the big market, the NYSE Comp (NYA) has been a good guide for cyclical peaks. This set a Rounded Top in 2007 and seems to working on one over the past six months.
On the nearer-term chart, taking out the December low of 10360 would be interesting. Taking out the October low at the 10000 level would set the downtrend.
Banks stocks (BKX) have taken out the 50 and 200-Day moving averages, as well as the December low.
Europe’s STOXX recorded Rounding Tops in 2000 and 2007 that is being replicated since mid-2014. Of interest is that the high in 2000 was 5552, in 2007 it was 4572 and in 2014 it was 3325. That was in June and now it is at 3007, which is at December support.
The sequence of descending highs in Europe helps explain the focus on NYSE senior stocks. The S&P high in 2000 was 1553, in 2007 it was 1576 and December it was 2093.
Selling pressures across many sectors has been impressive – enough to register a Springboard Buy on the senior indexes.
Commodities
Crashes in crude don’t happen all that often but when they do they are impressive.
On timing there are seasonal forces that have been likely to complete in December. Some crashes have run for 6 to 7 months and this month is number seven on the count.
Percent declines have been impressive and the action can take a pause.
In gold terms the full bear could amount to a decline to some 25% of the cyclical high. That was the decline in the last Great Depression.
Another measure of the real price is against the PPI.
One example we used was the 1985 to 1986 crash when the deflated price fell 66% from that fateful November to the following March. The bear market from October 1990 to February 1994 amounted to 65%. The crash from June 2008 to December 2008 amounted to 75%.
As deflated by the PPI, the high in June was 102 and at 48 the plunge is 53%. In gold terms it is down 53% as well.
After a pause, crude can decline further.
At the height of the boom in 1980 all of the banks had to be in the Oil Patch, and then it turned bad. So bad that there were hearings and one of the problems that non-market people have in a bust is wondering where the money went.
There was a particularly aggressive young banker with a new bank in Oklahoma. When the judge asked the question about the money he responded “Well, your honor, we spent it on wine women and song – the rest we just pissed away.”
This was quoted in the Wall Street journal on the way to the nasty conclusion in late 1990. The Fed had to move dramatically to bail out Citigroup and Chase Manhattan.
Grains (GKX) enjoyed a rally from a “saucer” base and became overdone a couple of weeks ago. The low was 290 in September and the high was 342 in mid-December. The drop to 316 took out the 50-Day and it has bounced to 330 yesterday. If it stays above the 50-Day it would be constructive.
Base metals (GYX) continue to decline and are getting somewhat oversold on the Weekly RSI. The 319 set earlier today is a new low for the bear that started at 502 in 2011.
Base metal miners (SPTMN) rallied from the December low of 606 to 710 last week. This could be mainly with the rally in the big market and it has given up a little. We will watch this one as the stocks tend to lead changes in metal prices.
Will there be a “Rotation” such as we called for last year?
That was likely to be significant, but can’t make the equivalent call now.
Credit Markets
With hits to stocks and commodities the bond future has rallied – right up to a Daily Upside Exhaustion on the TLT. In so many words, a correction in high-grade bonds is starting. This could be within our prospect for “ending action”, which would require a Weekly signal as well.
Lower-grade stuff has whipped-sawed with JNK at a Springboard Buy in the middle of December, which was followed by the opposite ten days later.
JNK has declined from 39.98 to 38.18. The last low was 37.08 and that is now support.
Spreads from BBB to treasuries narrowed from 210 bps in mid-December to 197 bps at the end of the year. It has widened to 206 and the trend will likely continue.
Weakening commodity prices suggest weakening producer prices and that suggests weakening earnings. As it continues it will weaken the ability to service debt. With some 17% of junk bonds having been issued by the Oil Patch, this became very clear.
Weakening crude prices had a lot to do with the panic in Russia’s bonds and currency. It reached a crescendo in the middle of December as the yield spiked up to 16.24%, much higher than the 12.80% reached in 2009. As the panic eased the yield declined to 13.12% and it has increased to 14.09% today.
As the Russian panic eased, concerns shifted to Greece as their yield jumped from 7.25% to 10.35%. This was on conjecture that Greece would leave the EU. The spike high in the October troubles was 8.98%.
Then just as the Greek yield started to soar, Der Spiegel editorialized that “The danger of contagion is limited because Portugal and Ireland are considered rehabilitated.”
“Contagion” uttered by the establishment is the term we have been watching for. It, or “contained”, has been used to keep the boogeyman of a global contraction away. Sadly – each time since the Asian Crisis of 1997 – without avail.
It seems like only yesterday when in that July the Thai central bank ran out of reserves and the there was a local panic. International policymakers moved quickly with assurances that it would be limited to Thailand. After quickly engulfing the Philippines, the hit took until September to reach the shores of Manhattan Island.
The German Ten-Year continues to plunge, hitting 0.447% on Tuesday. Away back in September it was 1.00%. In the 2008 Crash the high was 4.63%. In 1981 the high was 10.80 (no typo) percent.
However, it is worth putting the 0.447% yield in perspective. In the unprecedented rise in yields to 1981, Government of Canada long rates reached 19.5%. In that panic there might have been days when the spread between the bid and ask was greater than 0.447 percentage points.
Central bankers have become fanatical and investors have had little choice but to go along with the ride. Quite likely the action in US long treasuries has further to go and will set the ending action, which will be opposite to the mania that drove the yield up to 15% in 1981.
Precious Metals
We have been rather cautious in our re-positioning gold stocks and in early December recommended buying a little. GDXJ set a low of 22.18 in early November and bounced to 29.54. The next low was 21.24 in the middle of December and this week’s rush has upped it to 26.91. That it has broken above the 50-Day ma is constructive.
Our January 2nd special “Something Happening?” noted that gold stocks were beginning to move opposite to the big stock markets, which is also constructive. We should keep in mind that this sector took part in last year’s “Rotation” and shot up to a very overbought on the silver/gold ratio in May. We marked it as “dangerous”.
So we have not been looking for a “V” bottom, but have been looking for the sector to constructively end a cyclical bear market. This would have a period of stability with the gold shares outperforming the bullion price. This has risen above the 50-Day ma.
Also needed would be silver beginning to outperform gold. Since November this has been basing and today it got a little over the 50-Day.
Another item would be gold stocks outperforming the big stock market. Using GDXJ/SPX, this has been the case since the third week in December, with the last two days above the 50-Day.
All of this adds up to rather good construction, but the sector is still vulnerable. Thus the advice to buy in modest amounts on weakness.
The most constructive feature of the sector is that gold’s real price continues to climb. Our proxy is our Gold/Commodities chart and it follows.
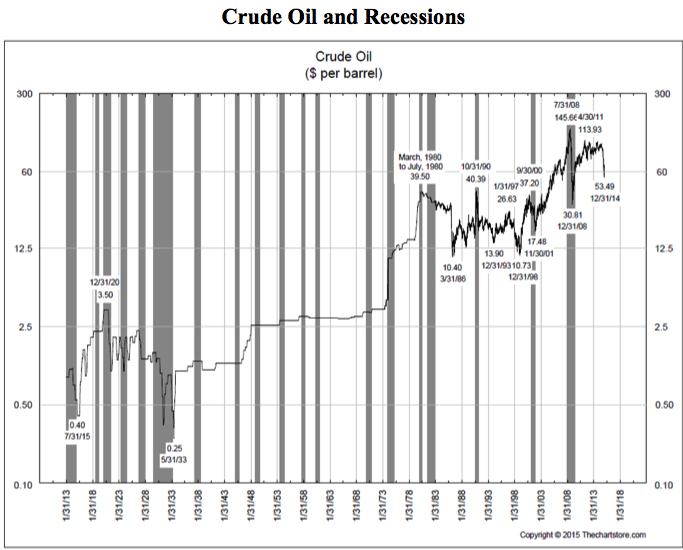
- Most bear markets for crude have been associated with a recession.
- The 1985-1986 crash was not part of a recession.
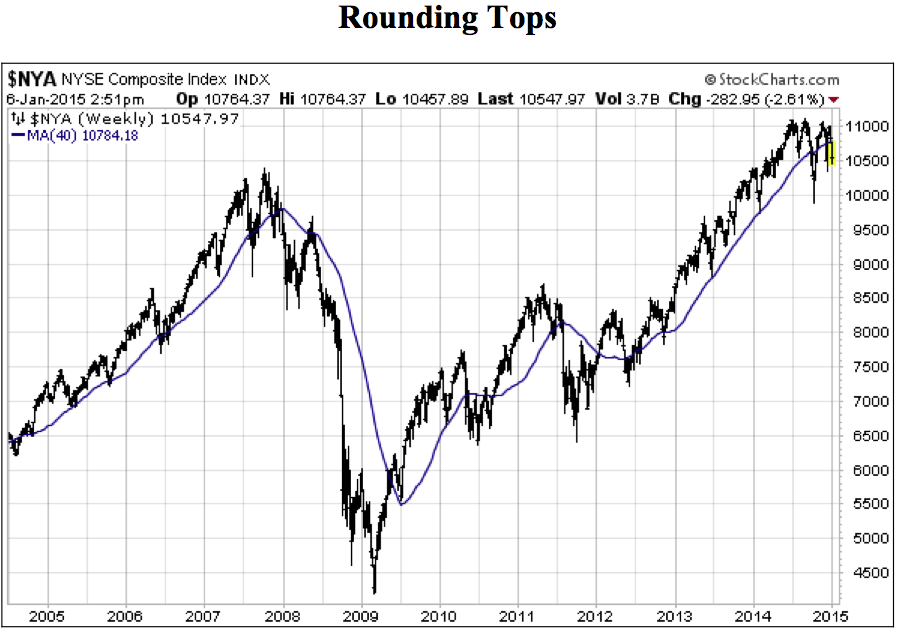
- A big Rounding Top described the completion of the 2007 bull market.
- The simple technical guide that “told-the-tale” were the multiple highs and the take out of the 40-Week ma.
- In 2007 it took two attempts late in the year.
- This example is working on the second attempt.
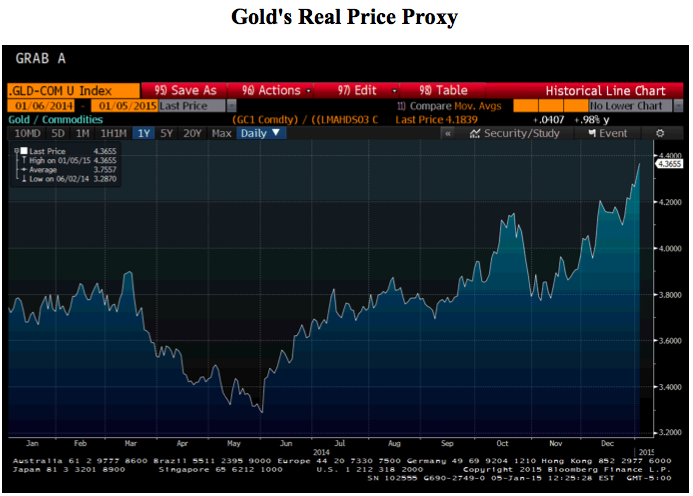
- Our Gold/Commodities Index is our proxy for gold’s real price.
- When it is going up it suggests that the bullion price is outperforming most of the costs of mining.
- We took the low of 3.28 set in June as the end of the cyclical bear that started in 2011.
- This week’s action set a new high for the move at 437.
- This compares to the cyclical high of 487 set in early 2011.
Link to January 9, 2015 Bob Hoye interview on TalkDigitalNetwork.com:
http://talkdigitalnetwork.com/2015/01/collapsing-crude-leads-to-shinier-gold/
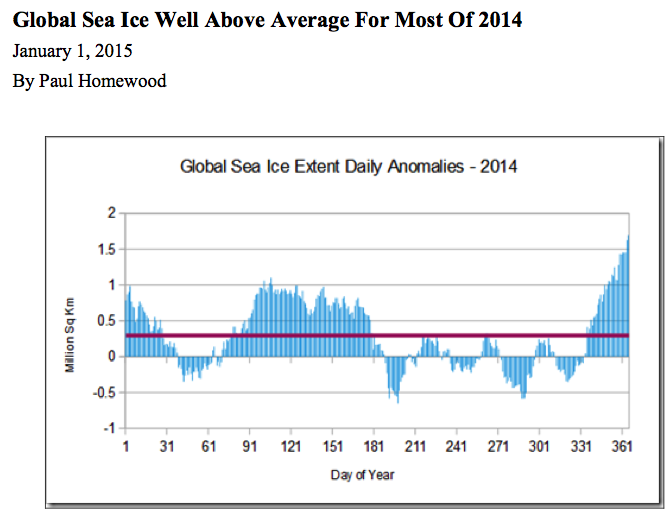
Global sea ice extent finished the year at 1.69 million sq km above the 1981-2010 average. This equates to 8.2% above normal.
During 2014, sea ice extent has been above normal for 245 days, at an average of 295,000 sq. km.
BOB HOYE, INSTITUTIONAL ADVISORS
E-MAIL bhoye.institutionaladvisors@telus.net
WEBSITE: www.institutionaladvisors.com

-
I know Mike is a very solid investor and respect his opinions very much. So if he says pay attention to this or that - I will.
~ Dale G.
-
I've started managing my own investments so view Michael's site as a one-stop shop from which to get information and perspectives.
~ Dave E.
-
Michael offers easy reading, honest, common sense information that anyone can use in a practical manner.
~ der_al.
-
A sane voice in a scrambled investment world.
~ Ed R.
Inside Edge Pro Contributors

Greg Weldon

Josef Schachter

Tyler Bollhorn

Ryan Irvine

Paul Beattie

Martin Straith

Patrick Ceresna

Mark Leibovit

James Thorne

Victor Adair