
Timing & trends
Almost everyone I talk to thinks the European sovereign debt crisis is coming to an end. They claim the decline in the euro will stoke inflation there … that Mario Draghi, the European Central Bank head, will do everything possible to turn the economy around …
That major European companies are now cheap, based on the decline in the euro … and that the leaders of the euro region are finally getting their act together.
I say baloney, to all of it.
First, severe austerity measures continue to this day and they are hollowing out Europe’s economic growth.
The proof is in the numbers. Before the Greek crisis flared up, debt-to-GDP in Greece stood at 113 percent. Today — according to the most recent data and even after all the write-offs — Greece’s debt-to-GDP stands at a whopping 174 percent.
In Spain, pre-crisis debt stood at 40 percent of GDP. Today it’s 97.6 percent.
In Italy, debt to GDP is hovering near 100 percent while France is set to exceed 100 percent early next year.
Clearly, all the austerity measures that Europe has implemented have done nothing to reduce debt levels.
Meanwhile, it’s created some of the worst social chaos we have seen in modern times.
 Second, Italy, Portugal, Spain, and Greece remain hotbeds for massive social unrest.
Each and every one of these countries is in hock way over its head. And each and every one of them is in the depths of a nightmare caused by austerity measures.
Spain’s unemployment is stubbornly high at 24 percent. Portugal’s, 13.4 percent. Italy’s, 13.2 percent. Greece’s, 25.9 percent.
Unemployment among youth is still off the charts. From the second quarter of 2008, the youth unemployment rate — those under 25 years of age — has skyrocketed and now stands at a whopping 23.1 percent.
All told, over 24 million people are jobless in the 28 European member states.
Third, European banks are a disaster in the making. Although their ratings have improved lately, most European banks are still saddled down with huge debts. Plus, the sanctions against Russia are killing small- and medium-sized European businesses, which threatens to set off a new round of loans that will go bad.
Pretty picture? Hardly. It’s the ugliest economic picture for Europe since the 1930s, when 17 European countries went belly up, sending hundreds of billions of dollars’ worth of francs, marks, liras, and more flooding into the U.S.
Fourth, deflation is high. With austerity measures squashing growth all over Europe, deflation is starting to run rampant.
According to the latest data, inflation is running at a very low 0.4 percent. But that hides the problem. In most European countries, prices are now falling faster than at any time since the 2008 financial crisis.
There are huge problems when an economy suffers from deflation. Demand falls off and growth comes to a halt as consumers think, why buy something today when it will be cheaper tomorrow?
That, in turn, causes a host of problems. Debt to GDP worsens, economic activity slows further. Unemployment worsens, and more.
That means Europe is facing more hits to economic growth, more debt going bad, more unemployment, and more social discontent in the months ahead.
In short, nothing, and I mean nothing, has been solved in Europe. The crisis will soon escalate with a vengeance.
So what does all this mean for you and your investments? A heck of a lot!
As Europe’s economy continues to worsen:
First, you’re going to see trillions more euros stampede for the exits. That’s going to send several large European financial institutions down the tubes.
Second, that will likely send global interest rates rocketing higher. The U.S. will not escape rising interest rates. In fact, our rates are now poised to move sharply higher in 2015.
Third, it’s going to send the U.S. dollar further into rally mode. That in turn, will eventually usher in more disinflation here in the U.S., driving commodity prices still lower in 2015.
Fourth, it’s also going to send our stock markets roaring higher. After the current correction completes, which could be the most substantial yet, a roaring dollar again in 2015 could send our stock markets through the roof, just like it did between 1932 and 1937 when the Dow Jones Industrials soared 387 percent as Europe went under.
Fifth, it’s going to give you multiple profit opportunities in 2015 to potentially make more money that you ever dreamed of.
I just gave my Real Wealth Report members the details in my very important 2015 forecast issue. To find out more, and to become a member, click here now.
In the meantime, my suggestions are …
- Keep your eyes on Europe. And keep most of your liquid funds in cash, in the U.S. dollar, ready to be deployed on a moment’s notice, but as safe as can be right now.
The best way, in my opinion: A short-term Treasury-only fund in the U.S., or the equivalent.
- Earmark a portion of your cash for speculation. Not too much, and not too little. I recommend 25 percent of your total investable funds. Funds that you do not need for anything else.
And …
- If you acted on my previous suggestions to buy inverse ETFs on the euro, mining shares, and gold and silver — you’re sitting pretty. Hold those positions!
Best wishes,
Larry

An analysis of the Stock Market, Bonds, US Dollar, Gold & Oi markets using technical analysis comprised of Cycles – Breadth – P&F and Fibonacci price projections and occasional Elliott Wave analysis – Editor Money Talks
“By the Law of Periodical Repetition, everything which has happened once must happen again, and again, and again — and not capriciously, but at regular periods, and each thing in its own period, not another’s, and each obeying its own law… The same Nature which delights in periodical repetition in the sky is the Nature which orders the affairs of the earth. Let us not underrate the value of that hint.” ~ Mark Twain
Current Position of the Market
SPX: Long-term trend – Bull Market
Intermediate trend – A correction of currently indeterminate time frame has started. There is a good chance, however, that it will be more than a short-term correction.
Analysis of the short-term trend is done on a daily basis with the help of hourly charts. It is an important adjunct to the analysis of daily and weekly charts which discusses the course of longer market trends.
TIME FOR A BOUNCE
Market Overview
For the week, SPX lost 77 points and DJIA a little over 700. Technical warnings had been accumulating for several weeks that a correction was due and, in the last couple of letters, I suggested that it could be imminent. Indeed it was! Now we must shift our focus onto how much longer and deeper this correction is likely to be. The bulls will be happy to hear that we are nearing a projection level at the same time that some positive divergence is showing in some indicators. This has always been a good recipe for a re-bound and I would expect it to start early next week. If this takes place, we will then try to estimate how much of a rebound it is likely to be. Let’s check on the indicators.
Momentum: The weekly MACD has turned down after showing some long-term negative divergence, but it remains strongly positive and, in spite of the decline, it has not yet made a bearish cross. The daily MACD has made a bearish cross but did so only after making a new high, hence no negative divergence. It also remains positive.
The weekly SRSI has just barely made a bearish cross and has dropped to neutral. The Daily has been negative for some time and oversold as well.
Breadth: The McClellan Oscillator is now in a downtrend and has reached a mildly oversold position. This has turned the Summation index back down. We’ll analyze it a little later.
Structure: Probably still in primary wave 3, but this could be the beginning of wave 4. More data is required to clarify.
Accumulation/distribution. Short-term: None! Long-term: Current top pattern nearly exhausted.
XIV: Has paced the SPX on the downside. It started to show some positive divergence late Friday.
Cycles: The short-term cycle low was ideally due on Friday, with the possibility of extending into Monday or Tuesday.
This decline could be a shot across the bow by the 7-year cycle topping.
Chart Analysis
We start with the weekly SPX (chart courtesy of QCharts, including others below) with the McClellan Summation Index posted underneath it.

Once again, the top of the intermediate channel has stopped the SPX from moving higher but this time, it did
not take as long to cause a reversal. Of course, bears had help from plunging oil prices and the retracement was abrupt, but not too different from what happened in July. In fact, the July decline found support on its 21-wk MA and, since we almost reached it last week, I would not be surprised if we repeated the July pattern this coming week, but not necessarily with a new high just ahead. There are several contributing factors besides the MA support. For one, the cycle which, ostensibly, at least partly contributed to the decline is supposed to be at or near its low. Also, some of the leading indicators were showing deceleration at Friday’s close. As mentioned above, we are also approaching a Point & Figure projection which is supported by a Fib measurement. We cannot ignore these warnings and it would make sense if at least a temporary low would form in this area — perhaps as early as Monday. There is no accumulation in the short-term P&F chart, so we will either have to create a base if we want this bounce to have some upside potential, or have a V-bottom reversal similar to the one that was created at the last low. But the weekly indicators are still declining and the Summation index, especially, does not show that the selling pressure has been totally relieved in either its RSI or its MACD. That could suggest that this correction will continue until such a time as both of the weekly indicators are more ready for a reversal.
Let’s now turn to the daily chart. Right away, we can add a couple more factors to our list of reasons for finding support in this time frame. The blue line represents the bottom of an unfilled gap. Filling that gap may be what the market has in mind. It also corresponds to the 1991 top, and the bottom of the red channel. Certainly, those are enough reason to suggest that SPX could bounce from this fast-approaching level.
As far as what kind of a rally we might get from here, none of the oscillators shows positive divergence and I don’t think we should expect any worthwhile rally until some has developed. That does not mean that this decline will necessarily go beyond 1820 before finding a low. But that’s for another day to decide.

On the hourly chart, we note that we tried to hold at the support provided by the blue trend line from 1344 which was penetrated once by the index on the way down to 1820 — but was again surpassed on the vicious rally that followed. This time, we are breaking it again and that could be significant; because if the 7-year cycle has topped, after we get through with this decline we may not be able to get back above it a second time. Of course this will largely depend on how far down we go, first.
The oscillators are all still in a declining mode as of Friday’s close. This, in itself, is a fair indication that we have not completed the downtrend and that we could expect more on Monday. Even the histograms have not even started to decelerate. I think we can expect the decline to continue into early next week although, as I mentioned above, there is some deceleration showing in the hourly charts of some of the leaders.

Larger Image
There is one index which should be very helpful in deciding what kind of decline has started, and that is the IWM. On the P&F chart, that index has traded in a tight range over the past few weeks — between 115 and 118. We can currently count 12 points of accumulation or distribution, depending on which way price breaks from here. Should it break on the downside, we could expect the move to re-test its 1820 low, and that could suggest that the current market decline will roughly match the previous one. (Emphasis on roughly!)
Sentiment Indicators
The SentimenTrader appears to have stopped publishing its weekly chart of the sentiment gauge. If this is permanent, it’s going to be tough to find something that matches it (for free!). Jason may have felt that he was giving away too much valuable information. It’s not a huge loss, but it will be missed!
XIV (Inverse NYSE Volatility Index) – Leads and confirms market reversals.
The divergence shown by XIV proved to be a valuable warning that a top was occurring in the market. As you can see at the last low, XIV did not exhibit any divergence because of the V-bottom nature of the reversal. We’ll have to see if this holds true for the next low as well. At the moment, there is nothing showing that would lead us to assume that a low is in place.

Larger Image
IWM (iShares Russell 2000) – Historically a market leader.
As you can see, IWM has made a flat congestion pattern which carries a 12 point potential in either direction. I would surmise that the downside carries a definite edge over the top, but let’s let the market confirm this.

Larger Image
TLT (20+yr Treasury Bond Fund) – Normally runs contrary to the equities market.
Not surprisingly, TLT continued its up-move while the market was correcting. However, it has reached the top of its channel and has remained below the previous top, as well. That is divergence to the market. The question is, does it tell us something about TLT or the market? Or both!

Larger Image
UUP (dollar ETF)
UUP is correcting after touching the top of its channel. If this is a correction of the entire move from the base, it could take a little while to conclude. Let’s give it some time.

Larger Image
GLD (ETF for gold) – Runs contrary to the dollar index.
GLD made a low which coincided with the bottom of its 25-wk cycle. It has found temporary resistance at the top of a downtrend/channel line but, since there is still plenty of time left in the cycle’s up-phase it should be able to break through and extend its move. A potential correction developing in the dollar index should facilitate this move.

Larger Image
USO (US Oil Fund)
USO’s decline, like oil’s, has been nothing short of a disaster for the bulls. Crude has dropped to about 58 dollars and may get some relief around 56, which is a partial P&F projection for WTIC. However, this will not be the end of the decline. There is a lower projection down to (at least) about 45. If this is where crude is heading, you can expect USO (and the market?) to follow.

Larger Image
Summary
“SPX has reached an area of strong resistance which is reinforced by a cluster of Fibonacci targets.”
This was the first line of last week’s summary. It has been vindicated by last week’s action. The sharp correction which was experienced by most indices has now brought the SPX close to a potential support level which should create a bounce when reached. There are many short-term factors supporting this view. There are also many longer term factors warning us that this may not be the end of the decline.
Let’s keep a close eye on IWM. It could hold the key to what comes next over the following several weeks.
For a FREE 4-week trial, send an email to: info@marketurningpoints.com
The TSX Composite continues to get punished by lower oil prices with the market index down 4.7% for the week, now giving up nearly all of the gains generated since the start of the year. After inching above US$100 per barrel in June, the benchmark price for WTI has fallen 45% to end the week at less than US$58.

The current issues faced by crude are multi-dimensional (supply, demand and political) but the easiest piece to understand is supply. At a time when the global economic outlook is dreary, we have seen oil production increase, to which we can largely thank the shale oil boom in the United States. Unconventional, shale oil production which was barely a thought 5 years ago has virtually transformed the dynamics in the energy market of the United States.
Normally when we see oil prices fall at such a rapid pace OPEC (lead by Saudi Arabia) steps in and lowers production to bring the market back into equilibrium and stabilize prices. But that won’t be the case this time with OPEC announcing last week that they were maintaining production at 30 million barrels per day.
So what is going to happen with oil and what does that mean for investors?
The political drama in the oil market is complex but let’s make it simple. Saudi Arabia is the largest exporter of oil in the world and has a very low cost of production. The United States has burst onto the scene just in the last few years with the EIA (Energy Information Administration) predicting that they can be a net exporter of oil by 2020. But the ‘Achilles Heel’ of the U.S. is that most of this new oil they are bringing to market. Estimates are really all over the map, but generally speaking, the consensus seems to be that most of the shale oil production in the U.S. starts to become unprofitable at less than US$60 per barrel (which we are at now). So it makes perfect sense that Saudi Arabia doesn’t want to cut its production if all that is going to do is make their competitor’s product economical. With oil prices where they are we eventually expect to see higher cost producers curtail oil production which will reduce supply and bring the market back into equilibrium.
There is also another factor at play. Lower oil prices while a net negative for Canada is a net positive for most of the rest of the world. Regions like Europe and Asia, which have been struggling, should get a bit of a boost from the lower energy prices. More economic growth means higher energy demand which further helps to bring the market back into equilibrium.
It’s impossible to say how long all of this will take to play out (perhaps 12 to 24 months) or what the equilibrium price will be. Prices could certainly continue to weaken from here, in the short-term, as fundamentals fly out the window in the face of market fear. But eventually the forces will even out as they always do and the volatility will open up opportunity for investors who are willing to take advantage of it.
KeyStone’s Latest Reports Section
11/28/2014
NATIONAL AND INTERNATIONAL WIRELESS RETAILER GLENTEL RECEIVES 121% TAKEOVER BID FROM BCE INC. – SELL


The long awaited Martin Armstrong documentary had it’s world premier in Europe last month at the Amsterdam Film Festival. We’ve always said that Martin’s life and experiences with the US Justice system read like a film script – and we look froward to the North American premier early in 2015.
In the meantime, enjoy the excellent trailer for the film on the movie website – http://forecaster-movie.com/en/the-forecaster/
And don’t forget! Marty will once again be presenting both days of the 2015 World Outlook Financial Conference.
– Ed.
Today’s videos:
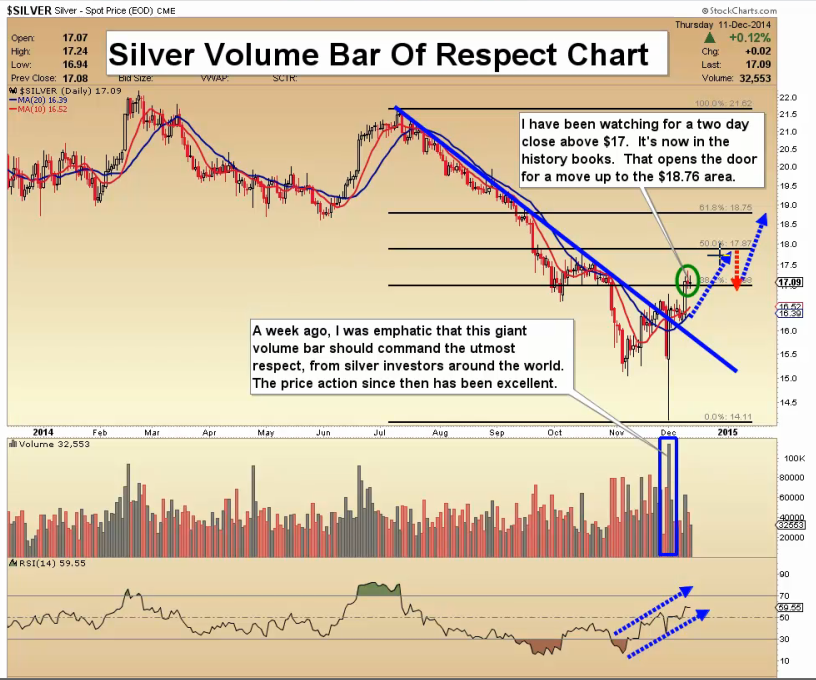
Silver Volume Bar Of Respect Charts Analysis
Gold Downtrend Breakout Charts Analysis
US Dollar Fib Line In The Sand Charts Analysis
GDX Two Day Close Charts Analysis
GDXJ Two Day Close Charts Analysis
Thanks,
Morris
Friday, Dec 12, 2014 Super Force Signals special offer for 321Gold Readers:
Send an email to trading@superforcesignals.com and I’ll send you 3 of my next Super Force Surge Signals free of charge, as I send them to paid subscribers. Thank you!
The SuperForce Proprietary SURGE index SIGNALS:
25 Surge Index Buy or 25 Surge Index Sell: Solid Power.
50 Surge Index Buy or 50 Surge Index Sell: Stronger Power.
75 Surge Index Buy or 75 Surge Index Sell: Maximum Power.
100 Surge Index Buy or 100 Surge Index Sell: “Over The Top” Power.
Stay alert for our surge signals, sent by email to subscribers, for both the daily charts on Super Force Signals at www.superforcesignals.com and for the 60 minute charts at www.superforce60.com
About Super Force Signals:
Our Surge Index Signals are created thru our proprietary blend of the highest quality technical analysis and many years of successful business building. We are two business owners with excellent synergy. We understand risk and reward. Our subscribers are generally successfully business owners, people like yourself with speculative funds, looking for serious management of your risk and reward in the market.
Frank Johnson: Executive Editor, Macro Risk Manager.
Morris Hubbartt: Chief Market Analyst, Trading Risk Specialist.
website: www.superforcesignals.com
email: trading@superforcesignals.com
email: trading@superforce60.com
SFS Web Services
1170 Bay Street, Suite #143
Toronto, Ontario, M5S 2B4
Canada
###
Dec 12, 2014
Morris Hubbartt

-
I know Mike is a very solid investor and respect his opinions very much. So if he says pay attention to this or that - I will.
~ Dale G.
-
I've started managing my own investments so view Michael's site as a one-stop shop from which to get information and perspectives.
~ Dave E.
-
Michael offers easy reading, honest, common sense information that anyone can use in a practical manner.
~ der_al.
-
A sane voice in a scrambled investment world.
~ Ed R.
Inside Edge Pro Contributors

Greg Weldon

Josef Schachter

Tyler Bollhorn

Ryan Irvine

Paul Beattie

Martin Straith

Patrick Ceresna

Mark Leibovit

James Thorne

Victor Adair