
Timing & trends
“I’ll now stick my neck out and claim that the long awaited gold base is completed” – Richard Russell
Also: Billionaire Frank Giustra’s Massive Bet On Gold & Silver HERE
On the heels of volatile trading action in markets around the world, the Godfather of newsletter writers, 90-year old Richard Russell, believes the long awaited gold base has completed and his subscribers can expect to see some historic trading in key markets. Below Russell covers everything from God to major markets as only he can.
….continue reading Richard Russell On God, Gold & Historic Trading In Markets HERE

The gyrations of financial markets can be startling. I am reminded of the following words of wisdom attributed to the economist John Maynard Keynes:
“The market can remain irrational longer than you can remain solvent.”
The words of wisdom reportedly were born in the 1920s after Keynes unsuccessfully performed a series of highly leveraged trades (short-term currency trading on high margin), the result of which was a humbling by the market. In this case, humbling is apparently another world for “wipe out.”
In the past number of weeks, these startling gyrations have been none more apparent than in the price of oil and energy related stocks.
Ed Note: HERE for yesterday’s closing Crude Chart & today’s ongoing hourly chart click HERE
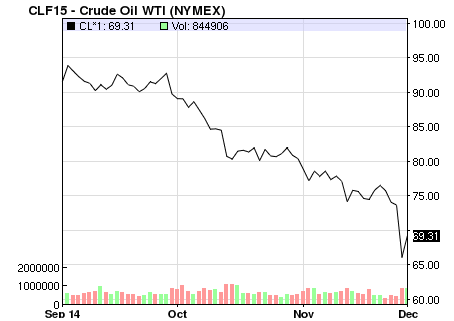
Since September, West Texas Intermediate has lost close to 30%. Given its pervasiveness in the global economy, it is shocking repricing could have far reaching implication, particularly for energy dependant economies such as Canada.
Those implications, of course, are largely dependent on the drop continuing and perhaps more importantly persisting at low relative levels (current range or lower). In this case, lower oil likely supports a continued lower Canadian dollar, weaker government revenues, slower growth in Western Canada (particularly Alberta), and generally lower stock prices for Canadian companies associated with oil. If OPEC continues or increases production for an extended period, in an effort to stick it to its Middle East rivals — curtailing North American shale oil growth as a collateral benefit — then prices are likely to stay relatively low until the corrective measure of lower production that low prices produces kicks in. This would likely be relatively painful for the North American oil sector and dire for those companies heavily levered with high costs of production.
If oil snaps back and trades in the US$80 range of higher, then the sell-off has already been overdone. The truth is likely in between the two scenarios.
So should investors be mortgaging the house and jumping back into anything oil related. The answer is no. Like Keynes said, “the market can remain irrational longer than you can remain solvent.” For those that would point out that the market is acting rationally with the current oil pricing environment, we would point out it had then acted relatively irrationally for the past 3-years pricing crude above US$90 a barrel (well above US$100 for a good deal of the time). Either way, the market can stay irrational in the near term, crushing those that speculate (even rationally) on margin.
As an investor, with a long-term horizon, you should always be alert to potential opportunities, but there is no hurry to be overexposed to oil at present. In fact, if you have not already, paring down exposure to crude is an option – we find Canadian investors are often over exposed to commodities in general.
We think there is likely to be some very select opportunities in the upcoming tax-loss selling season which typically peaks sometime in mid-December. Investors looking to find value with an eye to where these companies will be 1-3 years from now might find some babies are thrown out with the bathwater at that time. Remember to concentrate on companies with strong balance sheets (high net cash positions) that have historically produced strong profits and high return on equity.
KeyStone has two Special Reports slated for upcoming release – our 2015 Cash Rich Profitable Small-Cap Report and a Special 2015 Opportunities Report. Both will take a look at potential long-term winning investments that have been “thrown out with the proverbial bath water” in tax loss selling. We kicked off our 2015 Cash Rich Coverage with a preview Initial Coverage Report this past week on an underfollowed Canadian tech stock with 33% of its market capitalization in cash, zero debt and growth on the horizon.
Glentel Proves to be a Big Long-Term Winner
To further pick up on our Keynes theme, we take a quick look at BC-based Glentel Inc. (GLN:TSX). This is a stock that has been on our Focus BUY list since September 2006 when its shares traded in the $2.93 range and we have recommended it a number of times under the $9.00 range over that past number of years in our research. KeyStone most recently re-issued a BUY on the stock in July of 2013 at $17.76.
Despite continuing to be a free cash flow generating machine, the markets sold off the stock due to an unprofitable expansion into the Aussie market and a slowing of overall growth. The stock suffered this past year briefly trading under $10 once again, as investors lost patience. A number of times our clients questioned whether they should sell the stock given the poor recent share price performance. While we recognized the missteps in Australia, the cash generation in North America remained strong and the valued was still there. As such, we maintained our HOLD on the stock as the markets, in the near-term remained irrational.
This past Friday, we were happy to report our patience and belief that the intrinsic value of Glentel would eventually be recognized paid off. BCE Inc. (BCE:TSX) announced it would acquire all of the issued and outstanding shares of Glentel for $26.50 per share in a combination of cash and BCE shares, sending Glentel’s shares soaring. The transaction represents a premium of 121% based on the 10-day volume weighted trading average share price of Glentel on the TSX.
Essentially, the markets irrational near-term negativity had Glentels’ stock trading over 100% lower than the value at which a large investor was willing to buy it at.
Indeed, the market can stay irrational for a long time, but we believe if you are patient and unlevered, value is eventually rewarded.
In Glentel’s case — handsomely rewarded.
KeyStone’s Latest Reports Section
11/28/2014
NATIONAL AND INTERNATIONAL WIRELESS RETAILER GLENTEL RECEIVES 121% TAKEOVER BID FROM BCE INC. – SELL
Disclaimer | ©2014 KeyStone Financial Publishing Corp.

Crude oil prices had a seemingly exhaustive washout selloff following the Nov. 27 OPEC meeting. Oil bulls had been hoping for a production cutback at that meeting, but Saudi Arabia successfully led an effort to oppose such cuts.
But the message from the Commitment of Traders (COT) Report data is that the washout is not yet complete. An exhaustive move like what we have seen should produce capitulation among the small speculators, but instead the readings from recent weeks showed them them rushing in to buy.
Traders’ positions are reported each Friday in the COT Report, and they are broken down into 3 categories:
….continue reading HERE

 Despite falling oil prices, the Organization of Petroleum Exporting Countries (OPEC) voted on November 27th not to cut production in order to boost prices. The key to this decision appears to have been the attitude of Saudi Arabia, which has long been the first among equals in the coalition. Not surprisingly, the decision led to further oil price declines, and led many observers to conclude that OPEC has largely lost the ability to upwardly influence the price of petroleum. But this determination ignores the wider geopolitical considerations that may be convincing Saudi Arabia to be perfectly content, for now, with lower prices.
With about 20 percent of the world’s proven oil reserves and producing between 10 and 13 percent of the global oil usage, Saudi Arabia is the world’s leading oil producer ahead of the U.S., China, Iran and Canada. Perhaps more importantly, with its developed and easily accessible oil fields, Saudi Arabia has some of the lowest “lifting costs” in the world. Some estimate that it only costs the Saudis less than $5 to extract a barrel of oil from its fields. This is stark contrast to the much higher costs in rival countries and offshore and of shale producers. This permits the Saudis to withstand a protracted price slump far easier than other countries. The Saudis can use this ability as a weapon to achieve its strategic ends.
Modern U.S./Saudi relations were shaped towards the end of WWII by negotiations between President Franklin D. Roosevelt and the Saudi King Ibn Saud. In return for Saudi cooperation over oil, the United States guaranteed Saudi Arabia military protection. Despite the clear ideological differences between a conservative Wahabbi Sunni Kingdom and a Western democracy, this policy has largely held for some 68 years. Saudi Arabia exercised moderation and consistency over oil supplies from the Arab Gulf. In return, the United States led an impressive Allied military defeat of an Iraqi threat to Saudi Arabia in Gulf War I.
While the current dip in energy prices clearly does hurt Saudi Arabia, it hurts her enemies far more, particularly Iran and Russia, which has been a key enabler of Iranian power and an international pariah on its own. Putting pressure on Russia has also become a key strategic interest of Washington.
For many oil exporting nations, the tax revenues generated from petroleum constitute a major portion of government budgets and have become essential to the maintenance of long-term solvency. Nations like Russia, with oil generating 50 percent of tax revenues in 2013, according to the Ministry of Finance, are assumed to have a ‘Budget Break Even Cost’ (BBEC) of around $105 per barrel based on Citi Research’s data. Obviously the current price, less than $70 per barrel, is placing a great deal of strain on President Putin’s finances. Iran has a BBEC of some $131 oil. Recovering from recent sanctions, Iran has few currency reserves. Therefore, oil at $70 will necessitate an early cut in government spending, risking civil discontent and possible regime change.
Saudi Arabia is assumed to have a lower BBEC of some $98 per barrel. And although current prices are lower than that, over decades Saudi Arabia has accumulated vast foreign exchange reserves. As a result, many observers believe she can sustain her economic budget for a considerable time with oil selling at below $93 a barrel. Meanwhile, countries such as Russia, Iran and, particularly, Venezuela, which already is nearing default on its debt, must start cutting government spending to reflect depleted oil revenues. These outcomes are firmly in the interests of both Saudi Arabia and her longtime strategic partner, the United States.
And although U.S. consumers are now enjoying the benefits of lower fuel costs, which will help spark consumer demand, the threat to the U.S. energy industry should not be overlooked. U.S. oil companies have invested heavily in horizontal oil drilling and so-called fracking to increase well yields. U.S. domestic oil production has risen significantly over the past five years and now approaches 8 million barrels per day based on data from the U.S. Energy Information Administration (EIA). However, much of this investment was made on the basis of $100 oil. If the price stays below $70 for long, the continued viability of some smaller U.S. oil companies might be threatened, particularly in Texas and South Dakota. Citigroup Inc.’s recent forecast that the U.S. would pump 14.2 million barrels per day by 2020 could prove illusive and result in job losses.
However, there are more serious strategic concerns currently in play. The Obama Administration’s recent engagement with Iran may be of great concern to the Saudis, who consider Iran to be a mortal threat. Currently, the U.S. and Iran are in protracted negotiations over Iranian nuclear capabilities. The U.S. appears to be willing to acquiesce to Iranian desires in exchange for more cooperation against ISIS.
These concerns may have escalated this week when it was announced that Iran had recently conducted air strikes against ISIS insurgents within Iraqi territory. U.S. Secretary of State John Kerry reacted to these revelations as a “welcome development.” Although ISIS should be considered an enemy to both the U.S. and Iran, American acceptance of Iranian military intervention in Iraq can be seen as a clear shift in Washington’s policy towards Tehran.
If such is the case, the Saudis may begin to feel ‘dumped’ by Obama, and may be tempted to turn more forcefully towards China, the world’s largest oil importer, offering cheap oil in return for strategic protection against a new American-backed Iranian regional threat.
The effects of international recession and the U.S. ‘oil boom’ were slow to create a production glut because, until recently, production from Iran, Russia, Iraq and Libya was curtailed by sanctions and war. Cheap oil likely will protect and increase Saudi Arabia’s oil market share.
The real costs of Obama’s dropping the U.S.’s 68-year friendship with Saudi Arabia in favor of Iran are becoming increasingly apparent. If Saudi Arabia is forced closer to China, taking with her other Arab Gulf States (OAPEC), the long-range implications could be extremely serious for America and Europe.
John Browne is a Senior Economic Consultant to Euro Pacific Capital. Opinions expressed are those of the writer, and may or may not reflect those held by Euro Pacific Capital, or its CEO, Peter Schiff.
Subscribe to Euro Pacific’s Weekly Digest: Receive all commentaries by Peter Schiff, John Browne, and other Euro Pacific commentators delivered to your inbox every Monday!
Central bankers have assisted the biggest bubble – ever – in bonds, demonstrating that they still do not understand inflation in financial assets. Lowest-rated bond price have been deflating since June.
*****
Credit Spreads
This vital part of the investment equation – credit spreads – turned on our “model” in June. The “model” being that when lower-grade bonds become highly speculative going into around May seasonal forces can reverse the trend. It happened in June and we have routinely updated the chart of “BBB” versus long treasuries. With a number of corrections, widening is well-established but not far enough to provoke official anxiety.
However, in the really bad stuff spreads have widened from 390 bps to 560 bps. That’s for “CCC” relative to treasuries prompting the whistling-in-the-dark crowd to state that investment returns are now greater. Yes, but how great will they be next year? As Richard Russell might have observed about junk bonds “They are going to great valuations”.
Recent outstanding reversals that “happened” in June were also clocked in 2007 and in 1998 when the big boys at LTCM were caught betting the farm against Mother Nature. The sure thing was that European central bankers could narrow spreads at will–after June of that fateful year.
One sure thing that has faded after June has been spreads, but the central-bank-friendly crowd is convinced that “they” can continue to lower yields for European debt.
Since their lows in the spring the Russian bond has soared in yield from 6.46% to 10.32%. The spread relative to the German bond has soared as well. From 525 bps to 1107 bps. That is very damaging to unprepared portfolio managers.
The ruble has dropped today and the yield has jumped to 10.52%. The high in the 2008 Crash was 12.80 percent. That becomes out target.
Typically a boom can run for some 12 to 18 months against a flattening yield curve. In big booms such as in 2000 and 2007 the curve reached inversion. In 2000, the reversal in the credit markets counted out to March and in 2007 the count was to June. Both reversals to steepening heralded the onset of contraction.
Using the tens to twos, flattening began on December 1, 2013 and reached a “high” of .0233 in early-October. It plunged to .0163 on October 16th and has jumped back to .0233. Flattening has now run for 12 months so financial history is now within the window when cyclical change would be possible.
Spreads have accomplished a cyclical reversal which is a timely reminder that when Mother Nature wants to change credit markets – she does – and there is nothing that the central bankers can do about it.
The bond future is rising to test the high set at 147.75 on October 15th. Fixed income researchers are still reviewing the serious loss of liquidity in the most liquid market. Quite likely it is due to the massive and continuous intrusion in the financial markets by central bankers acting upon arbitrary whims.
How long can “arbitrary” last?
Well, arbitrary has run ever since the Fed opened its doors for mischief a hundred years ago and the next contraction will provide a harsh criticism. That would be from the markets and eventually from the public.
European bonds such as Spanish Italian and Portugal spent a number of months trying to set a bottom. Since the mini-crisis of October, yields have moved to new lows. The Portugal 10-year is down to 2.02%.
On the October concerns, the Greek note soared from 5.56% in August to 8.98%. It then declined to 7.33% and at 8.45% today it is well beyond near-term resistance at 8.27%.
The Russian and Greek “Oracles” are working on some bad omens.
Stock Markets
We thought it appropriate to review that the credit markets can quietly undermine speculative moves in equities. Some aspects of credit have been deteriorating, a little. Is the action in equities speculative?
Our big theme has been the key stages seen at or near cyclical peaks in the stock markets. These have been Exuberance (second run), Divergence (during the summer), Volatility (since October) and Resolution. The latter phase is inevitable but not yet in play.
With the most consistent rally in years, the S&P is on a run of record highs. The volatility is in the big swings in stocks, treasuries and low-grade bonds. VIX has collapsed.
Deutsche Bank has one possibility and that is “Goldilocks Scenario Materializes”.
Goldilocks, Rosy Scenario, Lady Bountiful and Janet Yellen are current celebrities.
The Springboard Buy registered with the October low and we have noted that following that signal in October 2013 we thought the rally could run into February, at least. Considering the rapid resumption of excesses this timing is uncertain.
We have been looking for another “Rotation”, similar to last year at this time.
This would include base metals and the mining stocks from a likely low in November. The stocks (SPTMN) set an oversold low at 654 on November 9th. The following Pivot noted the oversold and thought it could “pop a rally”.
Mining stocks have jumped to 764 on Friday which was through the 50-Day. It will need a little work to determine if the trend change has been made. Often the seasonal rally can carry into January.
On the zoom to the peak in July, the Oil Patch (XLE) registered a big Upside Exhaustion. The high was 101 and the sell-off was steep into October when it became the most oversold since 2008.
The natural rebound made it to the 50-Day at 89 when it checked back to 84. The rebound made it to 89 and it is weakening.
Our target for the sector and crude’s price has been for a significant low in December. A couple of weeks ago we noted that the RSI had plunged to 20, which was very oversold, but that the condition could last for a while.
The low then was 73.25 and the bounce made it to 77.83 and yesterday’s low was 73.30. The Weekly RSI is now below 20 and in the 2008 Crash it remained at this level for some weeks.
The adjustment, similar to that for natural gas, to a new and lower price range seems to be working out. We have been unsure how long this would take. Our other and more recent concern has been that the price level may fall enough to curb much-needed revenues to the Neo-Soviets and Ancient Crazies in the Middle East.
We can give this one some time before looking to the long side.
This section was written yesterday and the section below updates a sensational change.
Commodities
Grains (GKX) have recovered from a very oversold 290 in September to 327 a couple of weeks ago. We have been noting that on the way up corrections found support at the 50- Day ma. The move was accompanied by a big swing in momentum. While not all that high on the Daily RSI, the move from the extreme low to now is impressive.
Yesterday’s high at 326 could be a test of resistance at 327. If it doesn’t break out the one good commodity sector takes a long rest.
Base metal prices (GYX) recovered from the low of 339 in mid-October to 359.77. The correction was to 349 a week ago and the bounce made it to 359.58 on Friday. It slipped to 354 yesterday, just above both the 50-Day and 200-Day moving averages. Taking these out turns the action down.
The above comments on crude were written yesterday and today it is has plunged to the 68 level. Yeah, gravity and bear markets suck. And the seasonal decline has yet to complete. Also the new paradigm has yet to complete.
Usually the oil stocks (XLE) do not lead important changes in the product price. The recent pop in the XLE seems very vulnerable.
Actually, when looking at the crash in crude many investment sectors become vulnerable.
Our November 13th Pivot included charts showing that spikes up and failures in crude oil have been associated with recessions. That holds for Producer Prices as well. This could take a few months to realize and the path will be interesting.
Precious Metals
Talk about fully metabolized material hitting the fan!
Crude’s crash is profound, but on schedule. As we write, gold is down 0.25% and silver is down 1.00%. The gold/silver ratio is increasing which is appropriate to the possibility of increasing financial concerns.
The key to the sector has been gold stocks outperforming the bullion price. From a very oversold condition in late October the HUI/Gold set a minor uptrend. The ratio jumped from .128 to .153 last week. This bumped its head against the 50-Day and has backed off.
A correction was needed and some stability is also needed to set the bull market for gold stocks. Our advice last week was to wait and “buy on the dips”. The dip is happening and we would wait a while before starting.
On Toronto, Franco-Nevada is down 2% and Silver Standard is down 4%.
Our position has been that buying gold and silver as protection against deluded central bankers is essentially a speculation in currency. In this case against the dollar and the problem in a post-bubble contraction has been that the senior currency firms.
Investors should focus upon gold as an industry and should buy the stocks on the potential for improving earnings. This will be based upon the continued rise in gold’s real price. It is worth noting that since June gold’s dollar price has been rising relative to crude, which represents energy costs.
We continue to stand aside on this sector, looking for the big opportunity.
Link to November 28 Bob Hoye interview on TalkDigitalNetwork.com:
http://talkdigitalnetwork.com/2014/11/lower-crude-symptom-of-slowing-world-economy/

-
I know Mike is a very solid investor and respect his opinions very much. So if he says pay attention to this or that - I will.
~ Dale G.
-
I've started managing my own investments so view Michael's site as a one-stop shop from which to get information and perspectives.
~ Dave E.
-
Michael offers easy reading, honest, common sense information that anyone can use in a practical manner.
~ der_al.
-
A sane voice in a scrambled investment world.
~ Ed R.
Inside Edge Pro Contributors

Greg Weldon

Josef Schachter

Tyler Bollhorn

Ryan Irvine

Paul Beattie

Martin Straith

Patrick Ceresna

Mark Leibovit

James Thorne

Victor Adair