
Timing & trends

Perspective
At 89.4, the US consumer has clocked the biggest number since July 2007. The cyclical low was 55 set in November 2009.
On the other side, commodity or producer prices remain weak. Over time this will feed pricing pressures into commerce and industry. This impairs cash flow and makes it difficult to service debt.
More specifically, Deutsche Bank calculates that if crude drops to $60 some 30 percent of B and CCC bonds would default.
Charts showing the decline in Iron Ore Prices and South African Coal Prices follow. Since the summer both have taken out key lows, extending the downtrend that started in 2011.
Last week we reviewed that the business cycle turns with commodity prices, which has been the case for a couple of thousand years anyway. Included were charts of crude oil and producer prices.
Throughout business history rising prices have indicated prosperity and falling prices have indicated hard times. Our era of chronic and deliberate inflation has obscured this.
For too many decades the policymakers and too many Wall Street pundits really believed that rising oil prices were a tax on the system and too high would force a recession. Then of course, low gasoline prices, such as now, will prompt a recovery.
There is scholarly evidence that the 3 to 5-year business cycle prevailed as far back as the 1500s. Crude oil was not a commercial product then.
In any century falling commodity prices signaled a contraction.
Gasoline prices fell from the peak of 3.29 in June 2008 to 0.96 (no typo) in that December. The plunge did not prevent the contraction but was part of it.
It is worth repeating that the consumer is the most ebullient and carefree since 2007.
Stock Markets
Stock markets are enjoying ebullience as well, which has pushed the AAII Sentiment up to 57.9 Percent Bulls. The following chart shows that it can get higher in the early stages of a bull market. It also shows that at a potential peak this is the highest reading since 2000.
For the senior indexes the decline was a “correction” and for such as the Small Caps (RUT) and the STOXX it was a hit. As with October 2013, the S&P recorded a Springboard Buy. Last year’s target was a rally to around February. This year’s correction was greater and the rebound has been outstanding. Perhaps even impetuous. The S&P has been above its 5-Day ma for 20 trading days without a break. This has happened only three times in the past twenty years.
Of interest is that the “big” market, the NYSE comp (NYA) has not made it to new highs. It is working on a big test.
Last year’s “Rotation” theme worked well and seasonal forces seem to be setting up another opportunity. We have been looking for a low for copper in November. So far the low has been 2.96 earlier in the month with some stability last week at 2.98. However, rally attempts since September have been turned back by the 50-Day ma. So it has to get through that.
Base metal miners (SPTMN) declined from 954 reached on the last “Rotation” to 654 on Monday. The latest decline was sharp, driving the Weekly RSI down to 25. This seems oversold enough to pop a brief rally.
The Oil Patch (XLE) set a magnificent high at 101 in June and slumped to 77 in the middle of October. The Weekly RSI got down to 30, which was big change from the overbought at RSI 83. The rebound made it to 89 a couple of weeks ago. This was turned back by the 50-Day ma and the index has slumped to 84.
Crude oil was likely to set an important low in December. Oil stocks still seem vulnerable.
Bank stocks (BKX) could become interesting. The action is describing a big rounded top with highs at 73.90 in March and at 74.49 in early September. Since late 2012 the “dips” found support at the 50-Week ma. That ended in October when the slide from 74.49 to 65 took out the 50-Day. The 12 percent hit was tied to a sharp turn in the yield curve to steepening and credit spreads to widening.
The curve bounced and is testing the highs with quite a swing in momentum. Another run at steepening seems likely. As reviewed below, spreads have continued to widen. The alert on the banks would be the BKX taking out the 50-Day. This is at 71.25 and the index is at 72.50.
Since the beginning of the month, the spread from BBB to treasuries has widened from 167 bps to 179 bps. This is becoming impressive.
Our overall theme has been some distinctive action from Exuberance (back again) to Divergence (late summer) to Volatility (September, October and into this month). The remaining phase “Resolution” has yet to complete.
Credit Markets
We keep looking back to the extraordinary spike up in the bond future. The instruction was that at the opening on October 14th there was no liquidity and the price shot up 5 points in an instant.
Weird, but perhaps an indication of what might happen when the world loses confidence in the arbitrary aspirations of central bankers. The October event was up, which implies there could be a down event.
The US bond future needs to test the high at 147.75. It is at 141.25 now.
On JNK, the big overbought was set at 41.81 in June and the decline to the 39 level in mid-October was severe enough to register a Springboard Buy. The bounce to 40.56 was fast enough to register the opposite signal.
JNK has been following the 50-Day average down, but this week the decline steepened. Taking out the 39 level would be an important step on the way to credit dislocation.
This shows clearly in the following chart on spreads (mentioned above). This week we have added the chart of spreads on the key reversal in 2007.
Over in Europe, this week the Russian bond yield broke to new highs at 10.42%. The previous high was 10.29% set earlier in the month. In May 2013 the yield declined to 6.46%.
The Spanish yield declined to 5.56% in early in September. With somewhat of a local panic it jumped to 8.88% on October 16. The subsequent low was 7.20% and it has methodically increased to 8.32%.
Other country yields are no longer declining and are building a bottom.
Commodities
Agriculturals (GKX) became very oversold at the end of September. Enough to suggest a sector that could rally. The low was 290 and with some stair-steps the index made it to 327 last week. Corrections have found support at the 50-Day which is at 308 and gently turning up.
Base metals and energy items were covered above, but merit additional comment.
Copper seems to be working on a double bottom. One low was at 2.96 in the turmoil of mid-October with the other at 2.97 on November 4th. Getting above the 50-Day would be constructive.
Crude oil’s plunge has driven the Weekly RSI down to 18.5, which is very oversold. A brief rally is possible. But we remain concerned about a “political failure” similar to the one from late 1985 to early 1986. That failure bankrupted the Soviet Union and this time around it would be very constructive to bankrupt the Neo-Soviet Union as well as terrorist movements in the Middle East.
Precious Metals
Will this sector become “precious” again?
Under the old paradigm of what happens in a post-bubble contraction – Yes!
Gold’s real price, as tracked by our Gold/Commodities Index, completed a cyclical bear in June and has set a cyclical bull market. Threats to the stocks would be diminishing liquidity in the big stock market and the even bigger credit markets. Going back a few years, the other threat was that in bull markets for orthodox investments, precious metals under-perform or head down.
Our November 6th Pivot noted that the bottom in the sector would be determined by gold shares starting to outperform the bullion price.
The plunge in HUI/Gold was the worst since the crash into late 2000. The numbers say it was more severe. In 2000, the ratio fell to .133 with the Weekly RSI down to 24. This time around, it plunged to .124 (November 4th) with the RSI down to 19.5.
Quite likely this took out the last of the “inflationists” playing the “hate-the-Fed” game that started very quietly in the mid-1960s. It became exceedingly popular in 2011.
HUI/Gold rallied to .141 and tested the low at .130 last week. The rise since has been very constructive and getting though the 50-Day at .152 would set the uptrend.
We think that crude oil is a reasonable proxy for the cost of energy when mining. Gold/Crude set its bottom at 11.71 in June and with a couple of corrections has made it to 16.20.
It seems that what was needed to determine the cyclical bottom for the precious metals has been accomplished. Gold shares could become outstanding performers and one should buy the dips. The main setbacks to golds will be liquidity concerns in the orthodox markets.
*****
Roy Spencer has an interesting blog on the snow storm that hit Buffalo, N.Y.:
Link to November 22nd Bob Hoye interview on TalkDigitalNetwork.com:
http://talkdigitalnetwork.com/2014/11/central-banks-admit-their-actions-are-reckless/

Not for the faint of heart, the steps to the iPhone of today is tracked all the way back to beginning in ancient times.
The iPhone is iconic as the culmination of all modern technology and engineering in one instrument. Although taken for granted sometimes, all smartphones are incredible and sophisticated devices consisting of many different and unique parts. Not only do they facilitate modern communication, but they have powerful computation ability, GPS, gyroscopes, interactive touchscreens, multiple cameras, and impressive battery lives.
All these very different technologies have different paths of how they came to be, and this infographic explains how we got to this iPhone Era of technology history. Over centuries mathematicians, chemists, engineers, and other scientists have devoted their entire lives to move incrementally in their field towards today’s tech.
Click the image below to expand to full screen for a more readable size


Review:
- In my last analysis from 19th of October I expected Gold to break down below US$1,180.00 rather sooner than later. After a final push towards US$1,256.00 the bears took over again and Gold sold off all the way down to US$1,130.00.
- Unfortunately Gold never made it to my recommended entry level (US$1,275.00-US$1,285.00) for a short sell swing-trade.
Arguments for lower prices:
- 3.3-years downtrend: Overall Gold still is in a downtrend. US$1,525.00 remains the line in the sand. Gold will need much more time to break through this heavy resistance. Only a move above US$1,350.00, US$1,390.00 and especially US$1,430.00 will indicate that the mid- and longer-term trend indeed has changed. A sustainable move above US$1,275.00 would already brighten up the technical picture. The 8-year cycle for Gold should bring a significant low around 2015/2016. It could mean that this bear market has to continue for one or two more years. But we are very likely in the last quarter.
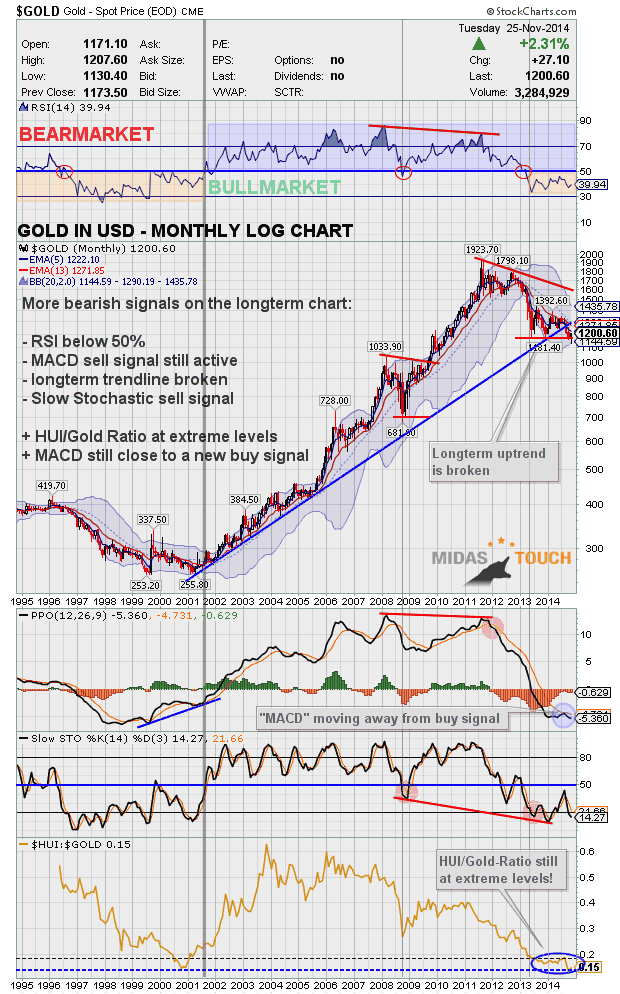
- Gold Monthly Chart: The long term up-trendline has been clearly broken. The chart remains in bear market mode. The MACD indicator has been moving away from a buy signal. The charts looks like gold will need to test the strong support zone between US$1,050.00 and US$980.00 before a new up trend can begin.
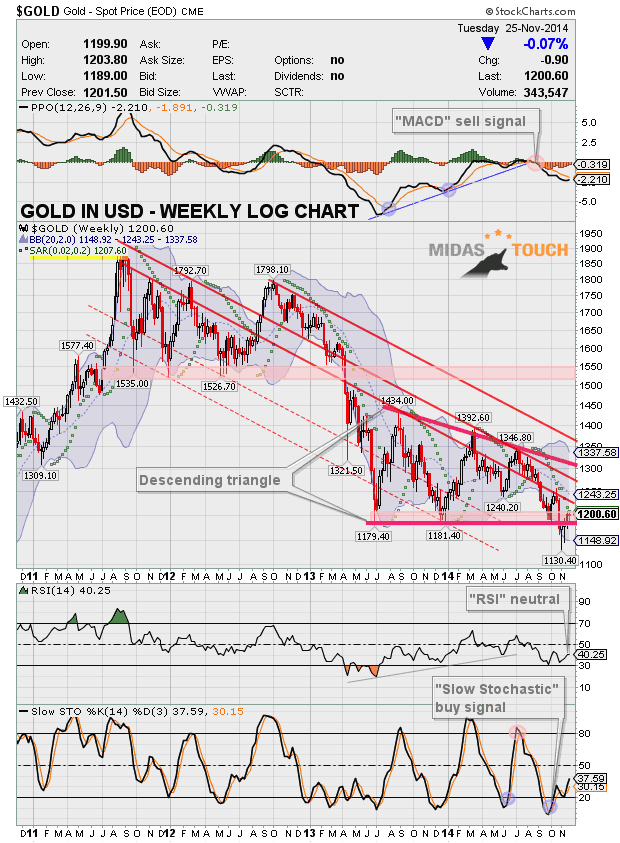
- Gold Weekly Chart: The bearish descending triangle continues to be the important formation here. As well the MACD sell signal remains in place. Gold is respecting the downtrend channel which creates heavy resistance around US$1,230.00 and US$1,270.00.
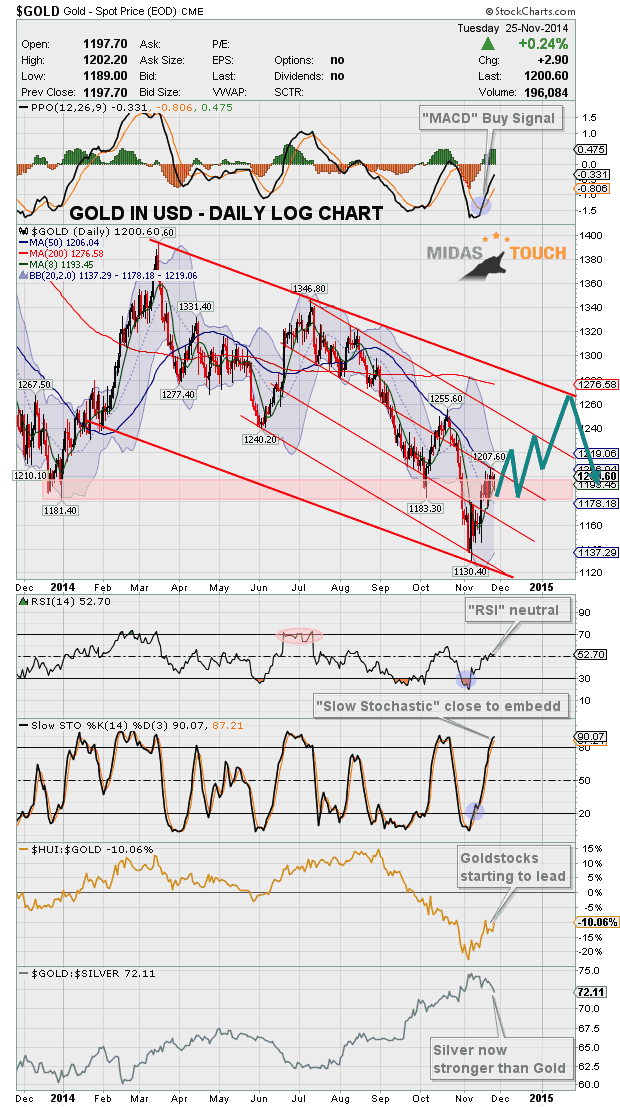
- Gold Daily Chart: Short-term Gold is in an up trend but is struggling to push sustainably through the US$1,200.00 level. The 50-MA (US$1,206.04) and the upper Bollinger Band (US$1,219.06) are resistance. The chart is not oversold anymore and the overall downtrend could resume anytime.
- Gold Stocks: HUI index crashed through important support around 183 points. The recent recovery has brought the index back to this zone which now acts as resistance. Tax loss selling might affect the mining shares in the coming weeks.
- US-Dollar: One of the main catalysts behind the falling gold price has been the strong US-Dollar. Besides some negative divergences there are no technical signals yet that the dollar is topping out indeed.
Arguments for higher prices:
- Gold Monthly Chart: No bullish indication but prices have recently spiked below the lower Bollinger Band which was unsustainable. Also note that the rising lower Bollinger Band is supporting Gold at US$1,144.08.
- Gold Weekly Chart: Although Gold broke through the descending triangle it did not happen in a very decisive manner. Instead Gold has already regained the US$1,180.00 resistance and is close to the US$1,200.00 level as well. The “ParabolicSar-Indicator” is about to switch to a long signal if Gold pushes above US$1,207.60. RSI and stochastic seem to have turned around already.
- Gold Daily Chart: With two big up days driven by short covering gold is up nearly 6.8% in the last 13 trading days. On 7th of November a morning star candle appeared on the chart and clearly indicated a short-term reversal to the upside. The falling 50-MA (US1,206.04) is acting as a magnet and Gold is oscillating around this moving average since about one week already. The next target and at the same time next resistance is the upper Bollinger Band (US$1,219.06). The slow stochastic indicator is about to embed with both lines above 80 for three consecutive days. This is locking in the bullish trend.
- Euro-Gold: €-Gold briefly touched the june lows at 907.00€ only to turn higher again. The ascending triangle is still in play and it looks like €-Gold wants to test the psychological level around 1,000.00€ soon. A breakout would create an immediate upside potential to around 1,075.00€
- Sentiment: Besides the recent recovery sentiment remains at excessive pessimism levels. During the first week of November many extremely bearish forecasts appeared and some famous newsletter-writes even started to finally sell gold short. This type of sentiment continues to support higher prices as the majority is short gold hoping for lower prices.
- Seasonality: Generally seasonality now is very supportive for gold and silver until mid of february. November tends to be the second best month of the year while December statistically sums up with a minor loss. Short-term seasonality is supportive until mid of December.
- CoT-Data: According to the latest CoT-Data the commercials had a 70,997 net short position in COMEX Gold Futures last tuesday. The week before this number was at 50.024 which coincides with a 10-month low. Clearly the smart money is playing the gold-market well and now seems to be positioned for higher gold prices again. At the same time the managed money (hedge funds and commodity pool operators) ramped up their shorts to 19% open interest which statistically is not sustainable. The CoT-Data now supports at least a larger recovery for gold.
- Volatility: On November 7th the CBOE Gold Volatility Index reached a 16-month high at 23.36 indicating high levels of fear and panic in the gold market. Since then volatility has eased. Negative divergences pointing to lower levels of volatility which limits downside risk in gold price.
- Gold/Silver Ratio: The ratio reached my target of around 77 points and posted an island reversal candle outside the bollinger bands on the same trading day. I think we have seen the lows of this bear market in silver already. The zone around US$15.00 is massive support and silver has been stronger than gold in the last two weeks pushing the ratio down to currently 72.11 points. Even if gold will go down to US$1,050.00 I am making the bold call that silver will not make a lower low anymore! Instead it should have bottomed before Gold!
- Gold-Stocks: After being pushed down to an 8-year low at 146.01 points the HUI Gold Bugs Index managed to recover 24.2% within one week. The Gold stocks starting to outperform gold again which is a positive sign. The sector has been massively beaten down in the last 3.5 years and remains in liquidation.
- US-Dollar: After a massive 6-month rally the market’s most crucial extreme is in the US-Dollar. The rally has pushed the currency to a 4.5 year high and sentiment (Optix) to extreme levels. The recent Commitment of Traders (CoT) report on the US-Dollar is coming off its most positive readings in history. When sentiment readings like the CoT and Optix signal extreme optimism, the opposite usually occurs… A falling US-Dollar is getting more and more likely here.
Conclusion:
- Although the bullish arguments are not overwhelming at this point I think this rally has more legs. Short-term Gold should climb until US$1,215.00-1,220.00. After a setback that should hold above the US$1,175.00 level the 200-MA (US$1,276.58) becomes the logical next target. As this moving average will start falling in the next couple of weeks Gold might able to push towards US$1,255.00 until january or february 2015. Overall I think this bear market is not over yet and Gold will need to make another lower low (maybe in may or june 2015?). But short-term the bulls have the advantage.
- Swing-traders could buy any setback towards US$1,175.00 with a hard stop at US$1,145.00 and a target of US$1,255.00 which gives a reasonable risk/reward-ratio of 1 to 2.66. Depending on future developments Gold around US$1,255.00 might offer a good shorting opportunity in the coming months.
- Investors with a long-term perspective should continue to accumulate physical Gold below US1,200.00. I recommend to put 10-20% of your net-worth into physical Gold and Silver as an insurance and hedge against the growing imbalances in our financial system.
Long term:
- Nothing has changed
- Precious Metals secular bull market continues and is moving step by step closer to the final parabolic phase (could start within 1-2 years and last for 2-5 years or even longer)
- Price target DowJones/Gold Ratio ca. 1:1
- Price target Gold/Silver Ratio ca. 10:1 (for every ounce of gold there are 9 ounces of silver mined, historically the ratio was at 15:1 during the roman empire)
- My personal price target remains at US$5,000.00 to US$8,900.00 for Gold within the next 5-8 years
- Fundamentally, when the current bear market is over Gold should start the final 3rd phase of this long term bull market. 1st stage saw the miners closing their hedge books, the 2nd stage continuously presented us news about institutions and central banks buying or repatriating gold. The coming 3rd and finally parabolic stage will end in the distribution to small inexperienced new investors who will be subject to blind greed and frenzied panic.
About the Author: Florian Grummes
Florian Grummes is studying and trading the Gold market since 2003. Parallel to his trading business he is also a very creative & successful composer, songwriter and music producer.

The Catharsis in the Gold Industry Is Healthy
Frank notes that the currency play among the Euro, the Yen and the Dollar is having an impact on commodity pricing given the current stronger dollar. He believes the currencies will re-adjust and in six months the picture will likely be different as U.S. exports slow. They discuss the fracking boom in the U.S., and how that may benefit the Asian economy through lower energy costs. Frank gives his overview of the gold market, and notes the royalty companies are the place to be in these times of weak gold prices. He also believes the catharsis in the gold industry is healthy, and will eventually weed out excessive debt and inefficient allocation of capital. A stronger industry will emerge, but many weaker companies will not survive.
…more from Frank:
Yet overnight two central banks promised what amounts to more monetary heroin and, presto, the S&P 500 index jerked up to 2070. That is, the robo-traders inflated the PE multiple for S&P’s basket of US-based global companies to a nose bleed 20X their reported LTM earnings.
And those earnings surely embody a high water mark in a world where Japan is going down for the count, China’s house of cards is truly collapsing, Europe is plunging into a triple dip and Wall Street’s spurious claim that 3% “escape velocity” has finally arrived in the US is soon to be discredited for the 5th year running. So it goes without saying that if “price discovery” actually existed in the Wall Street casino, the capitalization rate on these blatantly engineered earnings (i.e. inflated EPS owing to massive buybacks) would be decidedly less exuberant.
In truth, nothing has changed about the precarious state of the world since yesterday. Except….. except the Great Bloviator at the ECB made another fatuous and undeliverable promise—- this time that he would do whatever he “must to raise inflation and inflation expectations as fast as possible”; and, at nearly the same hour, the desperate comrades in Beijing administered another sharp poke in the eye to China’s savers by lowering the deposit rate to by 25 bps to 2.75%.
Let’s see. Can it possibly be true that European growth is faltering because it does not have enough inflation? Or that China’s fantastic borrowing and building boom is cooling rapidly because the People Bank of China (PBOC) has been too stingy?
The answer is not on your life, of course. So why would stocks soar based on two overnight announcements that can not possibly alleviate Europe’s slide into recession or the collapse of China’s out-of-control investment and construction bubble?
It can’t be a case of debatable data. Europe’s real GDP is no higher today than it was in the third quarter of 2006. Self-evidently, the temporary slowdown in consumer inflation during recent months owing to plunging oil prices and the transient impact of exchange rates cannot explain this long-standing trend of going nowhere.

Indeed, during this same period, Europe’s CPI is has risen by nearly 20%. Where is it written or proven that an average of 2% annual inflation causes economic growth to grind to a halt? There is not a shred of evidence for that proposition—so Draghi’s pledge to restore 2%/year shrinkage in the value of the wages and bank accounts of European households cannot mean more growth, more profits and more S&P market cap.

In fact, the whole clamor about “deflation” and Draghi’s overnight pledge to do whatever it takes to get inflation rising quickly has to do with a transient blip in the price index during the last 12-18 months. But this the first time that a shift in the global commodity cycle and the euro exchange rate has caused a temporary dip in short-run consumer price trends? The historic data indicate a resounding no.

In fact,the only manner in which weakening inflation could possibly impact short-run real GDP growth is if consumers sharply raised their savings rate, waiting for lower prices tomorrow. This is the hackneyed claim of the Keynesian money printers, of course, but where’s the evidence? After a temporary surge in Europe’s personal savings rate during the Great Depression, it has regressed to its recent historical average, and has remained on the flat line, even as inflation rates have decelerated since 2012.

No, the problem in Europe is not too little inflation in the short-run; it is staggering levels of taxes, public debt and interventionist dirigisme that represents a permanent, debilitating barrier to growth. Draghi already has driven deposit rates through the zero bound at the ECB deposit facility, and now its spreading rapidly through the banking system to businesses and consumers. Precisely who will finance this soaring mountain of public debt at negative real returns when the fast money is flushed out of the ECB’s now plummeting euro?

Likewise, last night”s signal from China was a warning to take cover, not get all giddy in the casino. The People’s Printing Press of China has been on a rampage for this entire century, and has expanded its balance sheet by an incredible 9X since the year 2000. Now, even its masters of red capitalism in Beijing know this has fueled fantastic levels of over-building, over-investment and mind-boggling real estate speculation throughout the land. The fact that they have had to once again open the monetary spigot is evidence that China’s addiction to the printing press is terminal, and that a hard landing is only a matter of time.

The real trajectory in China is tracked by the canary in the iron ore pit. Like almost everything else, its iron and steel industry is massively overbuilt. It has 1.1 billion tons of capacity but in the order of 600 billion tons of sustainable demand. Stated differently, China’s excess steel capacity is greater than the combined output of the US, Japan, and the EC combined. Accordingly, when its real estate and construction bubble finally collapses, the world market will be inundated with cheap steel and every manner of goods made from it, including automobiles. During the current year alone, China will export more steel than the US industry will produce.
 In short, there is a tidal wave of industrial deflation coming owing to two decades of world-wide central bank financial repression. That, in turn, will trigger a race to the bottom by central banks—a race that is already underway owing to Japan’s Hollowing Massacre of the yen. Soon the rest of East Asia—and especially China— will have to join the plunge or find their export based economies hitting the shoals.
Then will come more desperate maneuvers from the ECB, as even the German export machine falters in the face of collapsing growth in China and competitive devaluation all around the world. Stated differently, last night’s central bank announcements were the starting gun for a monetary implosion that will soon shock financial markets and real production, trade, employment and incomes on a world-wide basis.
Someone should reprogram the algos. Otherwise, one of these days they will snatch a headline which says sell, sell…..sell.
Reprinted with permission from David Stockman.
Former Congressman David A. Stockman was Reagan’s OMB director, which he wrote about in his best-selling book, The Triumph of Politics. His latest book is The Great Deformation: The Corruption of Capitalism in America. He’s the editor and publisher of the new David Stockman’s Contra Corner. He was an original partner in the Blackstone Group, and reads LRC the first thing every morning.

-
I know Mike is a very solid investor and respect his opinions very much. So if he says pay attention to this or that - I will.
~ Dale G.
-
I've started managing my own investments so view Michael's site as a one-stop shop from which to get information and perspectives.
~ Dave E.
-
Michael offers easy reading, honest, common sense information that anyone can use in a practical manner.
~ der_al.
-
A sane voice in a scrambled investment world.
~ Ed R.
Inside Edge Pro Contributors

Greg Weldon

Josef Schachter

Tyler Bollhorn

Ryan Irvine

Paul Beattie

Martin Straith

Patrick Ceresna

Mark Leibovit

James Thorne

Victor Adair