
Timing & trends
The American Association of Individual Investors survey (AAII) has a good record in signaling important lows. Despite the previous week’s large sell-off the survey showed optimism at a six-week high (the survey was completed prior to the Friday rally). That aberration should have been corrected last week. Instead, last week’s numbers show optimism surging and pessimism plunging again – implying that the 10/15/14 low was not an “important” low (the “buy the dips” mentality was stronger than any fear created by the market drop). With optimism already more than one standard deviation above average I am beginning to question my forecast for a bullish November. Equities may top out sooner than previously expected . It’s looking very possible that the next high may see equities drop to new lows.

Get your copy of the October Lindsay Report at Seattle Technical Advisors.com

When events “happen,” they happen in a directed way by the elite’s mainstream media outlets. News is presented in a way that is designed to appeal to mass emotions so as to discount reasoned thinking. You get government pimps, be they congressmen, heads of agencies, even presidents who add their fiat 2 cents in order to give some weight to an otherwise weightless argument. While the “news event” is largely untrue, there is a sufficient amount of plausibility added to disguise the misleading [never verified] facts. In other words, psychological manipulation is the main menu of options for the elites to keep the masses “informed,” while still very much uninformed.
As to gold and silver, there are two sides to the coin, as it were. One is well-covered, in fact overly covered, while the other receives coverage but with elite-imposed limitations.
One of the most basic truths in determining the value of anything is that of supply and demand: the availability of a particular product or service [supply], and the desirability [demand] for the product/service. It is an axiomatic rule that cannot be broken, but it can be distorted, as in the case for gold. The distortion via central bank manipulation has been so pervasive over such a long period of time, well over a half-century, that it has become perverse.
Supply for the physical has been replaced by paper. Demand for the physical has been replaced by [fiat and news]paper. Ever since elite-puppet FDR issued his Executive Order that all “persons” turn in their gold [the “news” portion], gold was replaced by the foreign-owned Federal Reserve central bank paper issue [the fiat portion], and demand was made to disappear from the minds of the [dis]informed public and world. Who needs gold when you can have the “almighty dollar?”
Gold coin, when in circulation, represented the greatest stability for medium of exchange conditions. As the duped American public turned in their gold coins, back in the 1930s, [decreasing one area of demand], the coins were melted down into larger bar form, never to return into circulation [supply]. The US was a country where a central bank did not previously exist. Once the privately owned Federal Reserve central banking system was “installed” by corrupt means in 1913, in just 30 years it had successfully withdrawn the use of gold as a means of measured wealth and replaced it with the Rothschild House of Paper. America has never been the same, since.
Financial stability disappeared, and financial dependence on a de facto federal fiat system began in earnest. Yet, if you were to take a poll in the federalized US today, almost none would make any link between the disappearance of gold and the Federal Reserve central bank. This is how successfully the elites work over a protracted period of time, changing the nature and character of things through words, using apparent authority, as in the entire US government, without ever exposing their “hidden hand” directing everything.
About one year after the Rothschild Federal Reserve banking system took over in 1913, there was just over $12 billion on deposit with non-fed member banks. By the end of 1929, these banks held just over $21 billion for a gain of about 75%. By contrast in 1914, Fed-member banks held $6.3 billion in reserves, and at the end of 1929, member reserves were almost $34 billion, an increase of 430%. Shortly after, by strong-arm power, non-member banks ceased to exist, reminiscent of the cuckoo bird.
A cuckoo bird will lay its eggs in the nest of another bird, leaving that unsuspecting other mother bird to raise the newly hatched cuckoo. Once hatched, the new cuckoo bird will get rid of any remaining eggs, and also push out any other newly hatched other-species bird. The Rothschild central banking system, with the US Fed being the most powerful, is the cuckoo bird of the financial world.
The so-called gold standard did not work primarily because the Rothschild banking system would not allow it to work. In order to maintain a gold standard, there are constraints on the factors by which money supply can be expanded, and that hampered the Rothschild formula for creating ever-increasing amounts of paper-issue fiat, with interest to be earned on its issue. With the gold standard, people bought and paid for that which they owned, owing no one. With the Federal Reserve eliminating the gold standard, substantially higher multiples of paper money could be issued in the form of credit expansion. “Buy now, pay later,”
Fast forward to today, almost everyone in the US is living on credit, well beyond their means, debt-serfs, if you will, to the Rothschild elite’s debt system. Very few Americans buy and pay for what they own unless it is on credit, to be repaid based on future earnings. This kind of economy did not exist in the US, over 100 years ago, prior to the insidious establishment of the Federal Reserve central banking system.
So successful has been the Rothschild banking system that gold has been all but erased from the American psyche. “A barbaric relic. You cannot eat gold. It earns no interest.” Can you eat Federal Reserve Notes? Do Federal Reserve Notes earn interest, anymore?
Everyone is aware [or should be] of the unprecedented demand for gold and silver from China and Russia to ordinary people who are buying as much gold and silver as possible. Stories about demand have been headliners for the past few years, with a large degree of accuracy. Not so much when it comes to supply, however. The real supply side of the Supply/Demand equation has been shrouded in secrecy, lest the Western central banking Ponzi scheme come unraveled, which it is now doing.
What you need to understand, as a precious metals buyer and holder, and that gold and silver confiscation have always been the highest priority for the elites, accomplished via their central banking system, for the most part, until the last decade or so when outright theft has been employed via CIA-led or sanctioned operations, like Libya, Ukraine.
This massive distortion of propaganda, mostly against gold, suppressing it as the time-tested store of wealth, along with silver, has served its purpose, and Newton’s Third Law of a reaction that is proportional to the action is getting ready to come into play. It is why our focus over the last several months has turned totally away from all considerations of the overblown and errant attention on the demand factors, and emphasis placed on what the Rothschild elites have been doing to the world economy: plundering its wealth and leaving worthless fiat and economic destruction behind.
Everyone not a part of the upper echelon elites has been financially duped by that parasitic group, robbed of wealth, freedom, property, dignity. While many knew that some kind of correction would follow the highs from 2011, no one, except maybe Jim Rogers, expected the depth of the correction down to current levels, an indication of just how much overly power this handful of people have.
The Western banking system, and particularly the Federal Reserve, have finally become a ticking bomb. At this point, you are either cognizant of the suppressed reality of events that have admittedly succeeded since the 1930s, or you should not be reading articles like this one. It is with incredible irony that the ultimate defeat of the West will be at the hands of the once, and still vilified “evil” nations of China and Russia. While they are building economic bridges around the world, fostering growth, the US/UK led West has only debt, financial destruction, and war, including human destruction as playing cards about to be trumped. Sadly, it may still get uglier as the West becomes more dangerously reactive, clearly demonstrating the elites know no other way.
Nothing, absolutely nothing will impel the price of gold and silver higher until the elites have lost total control over their deeply entrenched system. This means the loss in power of the no longer almighty Federal Reserve Note, better known as the “dollar. The never-ending War Against [insert any reason here] by the tenant of the White House, doing the bidding of his landlord, the New World Order banking elites, is ratcheting up as a sign of desperation that the end is near.
When it happens, it will likely be at a fast pace, perhaps faster than most are prepared, except for those already long the physical. Like many, we bought physical on the way up, held it, and added on the way down, some of which are almost half the value, in silver. At no time has there been any rear-view mirror regret. This is but a temporary phase of a seeming decline in value for taking a stance against an out-of-control Western banking system now closer to collapse than ever before.
Will it be by the end of the year, sometime next year, or sometime thereafter? We do not know or care, not to be cavalier, but instead from a position of comfortable preparation. If an unexpected jump in prices overnight occurs, as could happen, being a year early and not a day too late will have paid off.
We do not look at fundamentals, at all, but do have a general awareness that the “story” for silver can be more explosive to the upside than for gold. There is some credibility to that as found in the gold/silver ratio. If one knew little to nothing about silver, but was aware of this ratio, at 71+:1, gold over silver, odds favor an eventual reversal to a lower number, be it 40:1 or 25:1, or anywhere in between. This means silver would outperform gold. The point to make is how an awareness of what the market is “saying” in the charts is best and most current source available.
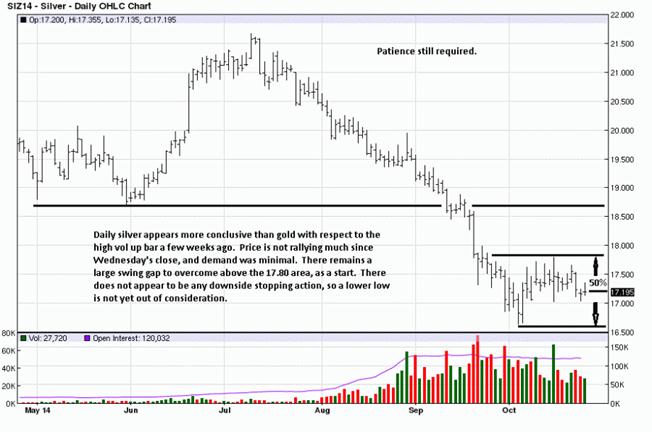
There has not been any large move lower since important support was broken 6 weeks ago. This could be a sign that the end of the decline is nearing, and even if that were true, there is still no indication that a bottom is in place.

One need not “guess” what to do when viewing a chart. The market provides ample information to suit any trader/investor style. For right now, the trend remains down, and that tells us the odds of making money from the long side in futures is slim. One need not be an astute chart reader to look back at the weekly and surmise an estimate as to how many longs are profitable over the last few years. [Long physical is viewed differently, at least from our perspective.]
The daily says the same thing. The mostly sideways activity for October is not a ringing endorsement for demand showing any degree of control. Price has not regained broken support, and it is far from retracing to the half-way area, 19 area, of the last swing high. There should not be any expectations for much upside, at this juncture.
There may be some increased attention being given to a triple-bottom-for-gold scenario, but any evidence for that conclusion is so far from consideration that it does not deserve much attention. The rally off the last low has been weak. That may change starting next week, or some weeks later, but one can only deal with what is known for right now. It is equally possible, maybe even more probable that price could be lower. Either way, it does not matter because the risk/reward factor is not supportive for either side.

Given the position for gold, near its lows, the likelihood of support holding above a 50% retracement, the 1219-1220 area, is not in keeping with the character of a down trending market. For sure, buying rallies, expecting yet a higher rally has not worked in gold, to which we can attest from a few trades some time back. Time is on the side of longs who are best served being on the sidelines, for now.


Ttoday’s videos:
Silver Key Moving Averages Charts Analysis
Dow Technical Deterioration Charts Analysis
TLT (T-Bond Proxy) Volume-Based Breakout Charts Analysis
Gold Needed Pullback Is Here Charts Analysis
Gold Stock Drawdowns Avoidance Charts Analysis
GDXJ Bullish Non-Confirmation Charts Analysis
Thanks,
Morris
Morris Hubbartt
trading@superforcesignals.com
trading@superforce60.com
Super Force Precious Metals Video Analysis
posted Oct 24, 2014
| Friday Oct 24, 2014 Super Force Signals special offer for Money Talks Readers: Send an email to trading@superforcesignals.com and I’ll send you 3 of my next Super Force Surge Signals free of charge, as I send them to paid subscribers. Also, to understand why the upcoming referendum on gold in Switzerland is important, please click this video link. |
The SuperForce Proprietary SURGE index SIGNALS:
25 Surge Index Buy or 25 Surge Index Sell: Solid Power.
50 Surge Index Buy or 50 Surge Index Sell: Stronger Power.
75 Surge Index Buy or 75 Surge Index Sell: Maximum Power.
100 Surge Index Buy or 100 Surge Index Sell: “Over The Top” Power.
Stay alert for our surge signals, sent by email to subscribers, for both the daily charts on Super Force Signals at www.superforcesignals.com and for the 60 minute charts atwww.superforce60.com
About Super Force Signals:
Our Surge Index Signals are created thru our proprietary blend of the highest quality technical analysis and many years of successful business building. We are two business owners with excellent synergy. We understand risk and reward. Our subscribers are generally successfully business owners, people like yourself with speculative funds, looking for serious management of your risk and reward in the market.
Frank Johnson: Executive Editor, Macro Risk Manager.
Morris Hubbartt: Chief Market Analyst, Trading Risk Specialist.
website: www.superforcesignals.com
email: trading@superforcesignals.com
email: trading@superforce60.com
SFS Web Services
1170 Bay Street, Suite #143
Toronto, Ontario, M5S 2B4
Canada
###
Oct 24, 2014
Morris Hubbartt

 Here is the latest Investors Intelligence report along with the all-important sentiment chart: Last Friday’s close showed a major rebound from Wednesday’s lows but the major averages still fell for the fourth straight week. There were turnaround signs with some indicator upturns and over 600 stock selling climaxes. Consecutive sessions with new stock buy signals in the majority added conviction to a positive momentum shift. The speed and size of the rebound wasn’t yet acknowledged by the advisors who remain overall cautious. As we go to print they are not yet convinced that the correction is over. That is a positive sign as they will have to increase their exposure if the rally gains traction. That should add fuel for more gains.
There was a new decline for the bulls to 35.3%, from 37.8% a week ago. Their number is now 22.3% below the start of September reading of 57.6% that was solidly in the danger zone. Bulls above 50% signal high risk but the suggestion now is that they have raised lots of cash. The bulls are just below their late summer 2013 level to a low since June 2012. Both prior lows followed market retreats. Some remaining bulls said to hold positions with expectations that any market decline would be mild. If not fully invested they want to buy the dip.
There was also another increase for the bears to 18.2%, from 17.3% last issue. That is a high since late May when their count was falling from the 21.7%, shown in April. The new bears come from the correction viewpoint with comments that this market pullback would exceed others in 2014 and require major defensive measures.
A higher level also occurred for those expecting a correction, to 46.5% from 44.9% last time. Both readings were 30 year highs! Their count has risen sharply since the September index highs, with Alibaba’s IPO mentioned as a top signal. Even after the recent declines many advisors note the S&P 500’s failure to pullback 10% as a reason to remain cautious, along with the upcoming end of Fed asset buying support. The high correction figure is another hint that a rally is underway as the market rarely fulfills the greatest expectations.
The spread between the bulls and bears dropped to 17.1%, from the 20.5% and 31.4% the prior two weeks. It is near positive levels, down sharply from late Aug and early Sep when two weeks of danger readings at 43.5% and 42.8% occurred. Differences over 30% are a worry but they signal major caution at 40%+. The spread shows a low since Sep-2013 when it was expanding from the favorable reading of 13.4% that Aug. That was close to the 10% (or less) reading that allows for broad buying. Bears haven’t outnumbered bulls (a negative spread) since October 2011.

To subscribe to Investors Intelligence CLICK HERE.
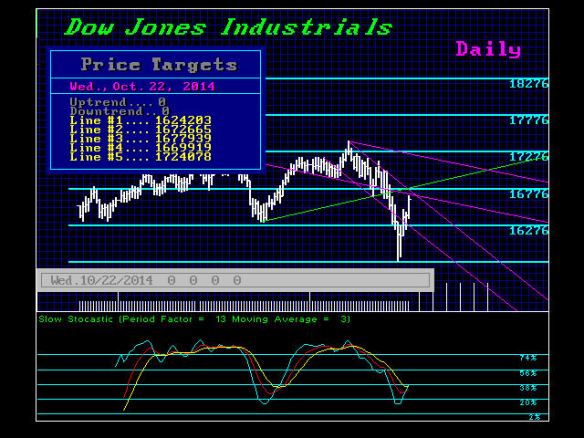
The resistance in the Dow Jones Industrial Index for today (Oct 22nd) stands in the mid 16700 zone on a technical basis. Targets in time for this week were Wed and Friday with the latter being the main target. ONLY a closing back above 17010 would signal that the low is in place for a broader term. This week should produce a reaction high. A closing on Friday at least below 16880 will keep the market in check. A closing BELOW 16660 will signal that a drop back into the week of Nov 3rd is possible with a new low.
Retail participation remains at record lows so this crash we will call the Rich Man’s Panic of 2014. The same trend is witnessed everywhere, including Asia and Europe. While the press was bashing the little guy saying he has missed the entire rally,
The stats show that the total size of the world stock market capitalizations closed 2013 at $54.6 trillion which was only
25% of the total world market capitalization – the rest being bonds.The bond market is larger than the stock market for various reasons. Whereas only corporations issue stocks, governments and corporations both issue fixed income securities. The U.S. Treasury is the largest issuer of bonds worldwide. Because U.S, Treasury bonds provide the bulk of reserves which are just over $30 trillion.
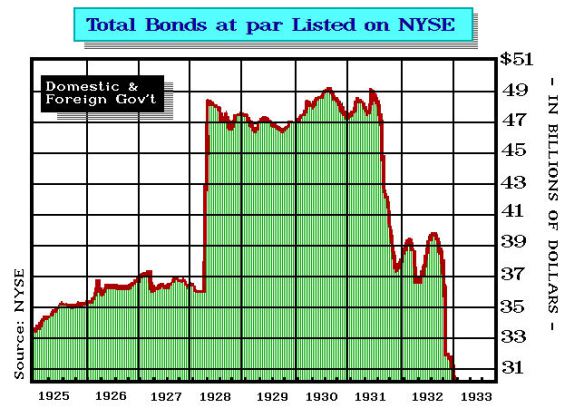
This is the real bond bubble. Capital is so accustomed to just hiding in bonds, it knows no other alternative. We can see that debt increased sharply in 1928. However, the collapse with the Sovereign Debt Crisis is what really made the Depression so Great. You can drop the stock market by 50% and you will not create a prolonged depression. Reduce the bond market by 33% and you get a depression.
 This is why Andrew Mellon first boasted during the 1929 that conservatives were not hurt – “Gentlemen buy bonds.” However, soon the Crash of 1929 turned into a serious Depression and that comes NOT by taking stocks down, but by wiping out the bond market.
In 1987 we predicted the low, and the very day of the low we stated the low was in place and new highs would be made by 1989. Just as at the low on this move I stated the low should hold temporarily. The numbers always define the market – NOT my personal opinion.
In 2011 even Barron’s reported that I was again warning new highs would be made and again they unfolded with the turn in the ECM. Each and every turn, even 1985 and 1998 in the middle of the Long-Term Capital Management Crisis, that low was followed by new highs BECAUSE the bond market was intact. Undermine the bonds, and then we have a crisis. If you do not look at absolutely all markets and how they function, you will be wrong. You simply CANNOT forecast anything be it gold, stocks, bonds, or commodities, unless you look at the interconnections and for that – sorry you need centuries of data not just back to 1971.
The central banks trying to stimulate the economy with lower interest rates have set the stage for the greatest crash of all time. You cannot imagine the bloodbath if interest rates go back to just 8% where they began this Phase Transition in bonds. We will see the worse economic bubble burst all over the street and this will be the real “GREAT” event of all time.
…related:

-
I know Mike is a very solid investor and respect his opinions very much. So if he says pay attention to this or that - I will.
~ Dale G.
-
I've started managing my own investments so view Michael's site as a one-stop shop from which to get information and perspectives.
~ Dave E.
-
Michael offers easy reading, honest, common sense information that anyone can use in a practical manner.
~ der_al.
-
A sane voice in a scrambled investment world.
~ Ed R.
Inside Edge Pro Contributors

Greg Weldon

Josef Schachter

Tyler Bollhorn

Ryan Irvine

Paul Beattie

Martin Straith

Patrick Ceresna

Mark Leibovit

James Thorne

Victor Adair