
Timing & trends
 Dear Diary,
How do you like that Dow? Down 272 on Tuesday. (Oct 7th) Then back up almost exactly as much on Wednesday.
As we predicted, volatility is rising. Investors are beginning to squirm.
Why?
The Fed is ending QE. And it could hike short-term interest rates as soon as next year. The EZ money is getting scarce.
“We are trapped in a cycle of credit booms,” writes Martin Wolf in the Financial Times.
Wolf is wrong about most things. But he is not wrong about this. “On the whole,” he writes, “there has been no aggregate deleveraging since 2008.”
He does not mention his supporting role in this failure. When the financial world went into a tailspin, caused by too much debt, in 2008, he joined the panic – urging the authorities to take action!
As a faithful and long-suffering reader of the FT, we recall how Wolf howled against “austerity” in all its forms.
His solution to the debt crisis?
Bailouts! Stimulus! Deficits! In short, more debt!
….related: Before You Put a Cent in Stocks Read This

Go HERE for Full Market Report including charts, Upcoming US & Intl Events for today and a full list of:
Stocks Entering Period of Seasonal Strength Today
**NEW** As part of the ongoing process to offer new and up-to-date information regarding seasonal and technical investing, we are adding a section to the daily reports that details the stocks that are entering their period of seasonal strength, based on average historical start dates. Stocks highlighted are for information purposes only and should not be considered as advice to purchase or to sell mentioned securities. As always, the use of technical and fundamental analysis is encouraged in order to fine tune entry and exit points to average seasonal trends.
Note: There are 8 stocks in this sections displayed as below, click on the smaller images for full view – Money Talks Ed
Western Digital Corp. (NYSE:WDC) Seasonal Chart


…..click HERE for all 8 Seasonally Strong Stocks & Full Market Report including charts & Upcoming US & Intl Events for today

Now that the Dow has joined nearly everything else in marking a lower low to the August low and the sentiment backdrop is getting very bearish (per October’s reputation), a reversal can come at any time. Yesterday, as the market was positive we NFTRH+’d a bear trade setup on QQQ, but the market reversed downward again. The parameters in that update still apply on any coming bounce.
Sentiment is getting constructive for a snap back rally.


At 24+, the absolute level of the VIX is not out of line with respect to previous market disturbances, but it is getting over done on the short-term. The daily chart shows a burst of anxiety that does not seem in line with fundamentals (is the Ebola scare really that great?) unless there is something acutely broken that we do not know about (we have our bearish junk to T bond ratios, etc. but also Yield Curves, TED, LIBOR, etc. are okay). The weekly shows that what ever is going on in this market has freaked people out beyond anything that has occurred since this post-2012 phase began.
VIX Daily

VIX Weekly

Returning to our short-term (daily) management charts of Dow, SPX and NDX…
DOW joined everything else and made the lower low to August and put a marker there for future reference. Key resistance levels 1, 2 and 3 are noted for any bounces to come. Recall how we used a similar method several months ago in GDX, laying out its resistance levels ahead of time. On its rebound it finally stopped at #3 and failed.

SPX is very similar.

NDX as well.

Of course, with the way sentiment is shaping up, if by some chance the Ebola scare is the primary reason for the sell off becoming impulsive, the Ebola relief rally would be furious. If a rebound gets going I would not want to be short against it.
What I want to do is use this market in both directions. I have already held/added a few Semiconductor stocks as noted in this week’s report, and would get the heck out of the way with remaining shorts (several were covered yesterday) of any rebound that may ignite now that the Dow has officially announced its lower low to even the most casual market participant (i.e. the public that invests through investment advisers). Anecdotally, they are getting nervous as a few people have woken up from their slumber and asked me what’s going on.
Bottom Line
The technical damage we have awaited is now in the books to the degree that even CNBC’s guests have to admit it. But there is a heaping helping of hype in the market now with the FOMC and an array of Jawbones in the media since, fretting about the US dollar (that’s a positive), the Semiconductors all but finished because of one company’s outlook (I retain my doubts, but also respect this information) and of course Ebola, which like Ukraine and every other non-market related event before it should be considered a non-factor other than in its ability to provide a buying opportunity.
I am not saying a buying opportunity will materialize, but I am saying that geopolitical events and disease contagion are not bull enders.
Meanwhile, simple TA states that bounce back or not, technical damage has been done to the US market and we do not need to know the reason. Bounce back or not, there would likely be another shoe to drop later. The markets can recover all the way back to point 3 on the charts above and still remain negative. So, taken at face value, that point – if it is attained, which is far from a sure thing – would be an excellent risk vs. reward short opportunity for another leg down (at least), even if the big bull market remains intact. Stop loss is simple above point 3. Meanwhile, points 1 and 2 can stop any rebound as well and more aggressive or bearishly oriented traders may try to work those I suppose.
Before any of the above takes place, the market has to actually make a low of course. As of now, it has not yet hinted it has done so.
Notable articles at the website since the last eLetter:
- What CB Financial Repression Has Sown David Stockman 10.13.14
- TIPS Continue Upward biiwii 10.13.14
- Semi Support biiwii 10.13.14
- Derivatives Story 2014 Doug Noland 10.11.14
- What Risk-Parity Pairing Could Mean for Equities Michael Ashton 10.10.14
- Bottom for Copper Tom McClellan 10.10.14
- Pivotal Events Bob Hoye 10.9.14
- “It’s Inflation All the Way, Baby!” biiwii 10.9.14
NFTRH is the most serious and comprehensive macro market management service out there. Period. I do not believe in going on auto pilot with any given orthodoxy (hello gold bugs). I believe in rigidly using tools to always keep readers on the right side of things. Long term subscribers realize that staying on the right side of markets takes work and dedication. Let me do that work for you for the cost of about 4 trade commissions a month!
Thank you again for reading. If you’d like an affordable weekly guide (with interim TA and Trading updates as needed) that is always on the job for its clients’ best interests, I’d be more than happy to welcome you to the Notes From the Rabbit Hole Premium subscriber base. –Gary Tanashian
Biiwii.com
Subscribe to NFTRH (premium)
Subscriber Testimonials
Twitter @BiiwiiNFTRH
About & ToS
Biiwii.com does not recommend that any trading or investment positions be taken based on views expressed in this eLetter. If you speculate or invest it is suggested that you consult a financial adviser qualified in your area of interest. See full Terms of Service (ToS) above.
This chart above is a very compelling reason to read this analysis which includes a Special Study of the entrance into stock, bond & commodity crashes of the last 100 years – Money Talks Editor
….read the full report & charts HERE
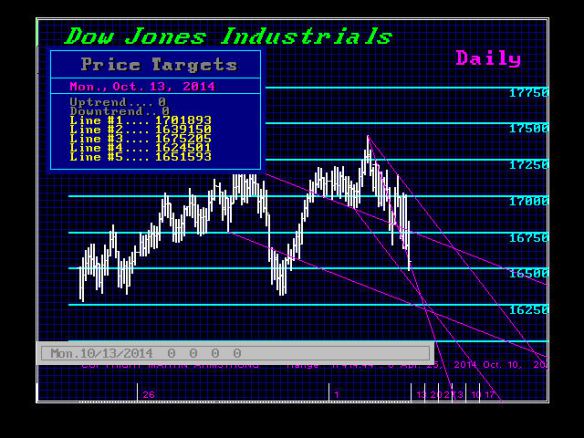
We have elected a Weekly sell signal in the Dow and this is warning that we may yet see that November low during the week of November 3rd. The critical support now lies at 15961 and a weekly closing beneath this area will warn of a sharp correction that will make people’s nose bleed. Nevertheless, our models show next week as a turning point with Directional Changes back-to-back for the next 2 weeks and high volatility for the week of 11/03. Critical support also lies at 15555/ Only a monthly closing below this area would warn of a sustained correction.
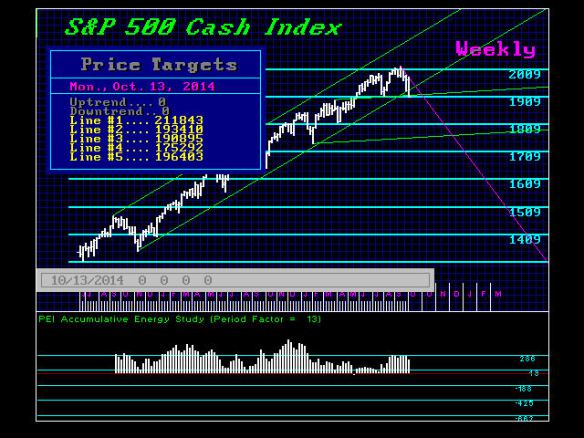
When we look at the cash S&P500, the market is stronger than the Dow reflecting the shift is still in place for the broader market leading. Our energy models are still bullish for the broad-term. Here we do see support lies at 1814 and 1766. We would need to see a monthly closing below 1814 to signal a sustained correction is possible. Where the Dow tends to target November, the S&P 500 targets December for a turning point with high volatility in November. The weekly turning points still show choppiness 10/13, 10/27, and 11/10. Key days next week will be Monday and Friday. This is the same targets in the Dow on a daily level.
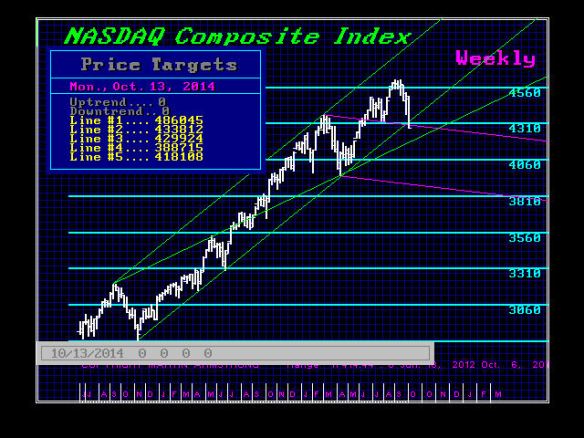
In the NASDAQ composite we see 10/13, 10/15, and 10/17 as daily targets with Wed showing high volatility. Here the key weekly targets are 10/13 and 10/27 followed by 11/10. Key support beings at 4239 and 4207. A monthly closing BELOW 4020 will signal a sustained correction. Keep in mind that November will be 72 months from the 2008 low in the NASDAQ. A low at that time on our long-range volatility models would imply we could set the stage for a strong rally after February.
….related from Martin: The Pending Phase Transition & Cycle Inversion

-
I know Mike is a very solid investor and respect his opinions very much. So if he says pay attention to this or that - I will.
~ Dale G.
-
I've started managing my own investments so view Michael's site as a one-stop shop from which to get information and perspectives.
~ Dave E.
-
Michael offers easy reading, honest, common sense information that anyone can use in a practical manner.
~ der_al.
-
A sane voice in a scrambled investment world.
~ Ed R.
Inside Edge Pro Contributors

Greg Weldon

Josef Schachter

Tyler Bollhorn

Ryan Irvine

Paul Beattie

Martin Straith

Patrick Ceresna

Mark Leibovit

James Thorne

Victor Adair