
 Today, 90-year old Richard Russell, who has lived through depressions and booms, through good times and bad, through war and peace (Russell flew as a combat bombardier on B-25 Mitchell Bombers during World War II), the 60-year market veteran said we have witnessed the “ultimate bottom” in the gold and silver markets. More below:
Timing & trends
Russell: Gold – I can’t prove it yet but I believe the last decline in gold knocked out the last of the gold bugs and gave gold, technically, a clean slate. I believe we saw the ultimate bottom of the gold bear market on Friday, and (yesterday) the whole universe of gold is higher, and closing at its high. Everything I have said about gold is also true about silver. I believe this is the time to invest in gold and silver if you have not done so already.
If I am correct, gold should act like the release of a compressed spring. Gold above 1300 would make me even more certain of my opinion, and gold above 1350 would represent a major buy signal. If you can’t handle physical gold, take a position in CEF, which represents physical silver and gold and is located in Canada.
….continue reading HERE
About Richard Russell:
Richard Russell began publishing Dow Theory Letters in 1958, and he has been writing the Letters ever since (never once having skipped a Letter). Dow Theory Letters is the oldest service continuously written by one person in the business.
Russell gained wide recognition via a series of over 30 Dow Theory and technical articles that he wrote for Barron’s during the late-’50s through the ’90s. Through Barron’s and via word of mouth, he gained a wide following. Russell was the first (in 1960) to recommend gold stocks. He called the top of the 1949-’66 bull market. And almost to the day he called the bottom of the great 1972-’74 bear market, and the beginning of the great bull market which started in December 1974.
The Letters, published every three weeks, cover the US stock market, foreign markets, bonds, precious metals, commodities, economics–plus Russell’s widely-followed comments and observations and stock market philosophy.
In 1989 Russell took over Julian Snyder’s well-known advisory service, “International Moneyline”, a service which Mr. Synder ran from Switzerland. Then, in 1998 Russell took over the Zweig Forecast from famed market analyst, Martin Zweig. Russell has written articles and been quoted in such publications as Bloomberg magazine, Barron’s, Time, Newsweek, Money Magazine, the Wall Street Journal, the New York Times, Reuters, and others. Subscribers to Dow Theory Letters number over 12,000, hailing from all 50 states and dozens of overseas counties.
A native New Yorker (born in 1924) Russell has lived through depressions and booms, through good times and bad, through war and peace. He was educated at Rutgers and received his BA at NYU. Russell flew as a combat bombardier on B-25 Mitchell Bombers with the 12th Air Force during World War II.

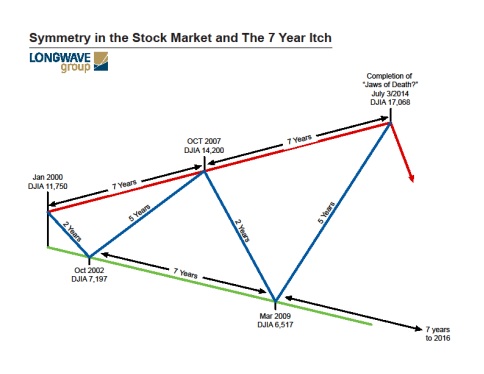
“The world is a mess right now, geopolitical trouble brewing all over the place, and now we see the Ebola virus threatening to become a worldwide pandemic. Hong Kong, Ukraine, ISIS, Libya, Gaza, Irannukes, North Korea, Secret Service, for starters. This is what happens during major Bear Markets, which is what we now have, Grand Supercy-cle degree wave {IV}down. This is because we are measuring the collective psyche of mankind with technical analysis, which is now telling us we are entering a period of se-vere strife. It is going to get a lot worse.
Those patterns look to have topped on September 19th, 2014. That looks to be the top for the multi-decade Jaws of Death pat-tern that started in 1987, and looks to be the top for Grand Super cycle degree wave {III}, which was centuries in the making.”
In his book, “The Coming Economic Ice Age” Dr. Robert McHugh warns readers that we are nearing a very major decline in equities given the massive “megaphone” formation that is taking shape in the Dow and many other major indexes around the world. In the book he shows that the same formation was present before other major equity market declines such as 1929, 1957, 1966, 1973, 1987, 2000 and 2008. In fact all major declines since the 1930s have had a widening megaphone which McHugh labels “The Jaws of Death.”
…..continue reading HERE
Convincingly Irrational
 To make sense of the markets, it may be ever more important to dissect what we may call convincingly irrational behavior by policy makers. To make sense of stocks, bonds and currencies, you might need to discern some of the madness that’s unfolding in front of our eyes. We assume no responsibility if you turn mad yourself in reading this analysis.
Stocks
As most of us love a bull market, not everyone will agree that the markets are embroiled in what former Fed Chair Greenspan referred to as “irrational exuberance.” The exuberance we are facing these days I call complacency: investors may be lured into seemingly docile assets, not realizing just how risky they are. This misallocation is fostered by our central banks whose ultra-low monetary policy encourages risk taking. In the stock market, it manifests itself through higher valuations on the backdrop of low volatility, a common measure of risk. But of course the markets are still a risky place; and anything might shake investors back into reality. When that happens, all those that thought the stock market is safe might be running for the exit (no pun intended) in a heartbeat. Hence, we’ve played party poopers and cautioned of a potential crash in the market. In fact, the party pooper might be the Fed in its attempt to engineer an exit. In our analysis, asset prices need to be re-priced (lower) should the Fed attempt an exit.
Bonds
We find a great number of investors agreeing that bond prices might be irrational. As of this writing 10 year
U.S. Treasuries yield 2.36%. How is this possible if the Fed is serious about an exit? Some argue that we are much closer to full employment than Fed Chair Yellen thinks (and thus leaving us vulnerable to inflation); notably, as loads of baby boomers turn 65 years old, they are eligible for Medicare, providing a major incentive to leave the labor force (and thus contributing to a low labor participation rate). But others argue against it, pointing out that the labor participation rate is low amongst young people; and that the labor force is far from maxed out, as the Affordable Care Act has created a large number of under-employed (businesses have an incentive to move full-time employees to part-time employees to avoid being required to offer healthcare).
So why are long-term rates so low? Is it one of the following:
• The market doesn’t believe there will be an exit anytime soon?
• “Easy money” by the Bank of Japan and European Central Bank depress US yields?
• The global economy is not doing well?
• Forget about the 10-year bond; look at the 2-year Treasury note that’s been inching up (a bit, at least)?
• The longer-term growth potential is lower than it used to be?
• The U.S. issuing much less debt in the short-term (although deficits are projected to rise again, both from increased spending on entitlements, as well as higher cost of servicing the federal debt)
We obviously don’t have a crystal ball either. However, our assessment is that a key driver to the low longer-term rates is that the market has lost faith in the longer-term growth potential. This could be due to excessive disincentives to generate growth, be that regulatory burden for industrial projects; ‘macro-prudential’ supervision to hold banks back from extending credit; be that Medicare and disability insurance (those receiving benefits have less of an incentive to work).
And while policies that hold back growth could be reverted, the high government and consumer debt levels may also make it difficult to raise rates. This is exacerbated by the fact that much of this so-called recovery has been based on asset price inflation. If indeed, as we believe, asset prices have to be re-priced lower as rates rise, the economic headwinds might be severe. In fact, we don’t think we can achieve positive real interest rates before the economy falters once again. We would go as far as questioning whether we will get positive real interest rates over an extended period over the next 10 years. It’s the key reason why we like gold, which pays no interest and, as such, may be more attractive than anything that has a negative real return.
When I discussed this view with a current FOMC member the other day, I was told that this cannot be the outcome, as it cannot provide a stable equilibrium; economic theory suggests we either get the Japanese experience or an inflationary one, but we cannot churn along with slightly negative real interest rates forever. My reaction was: I never said this would be stable.
Complacency may also be a way to describe the bond market. After all, central banks have caused anything from Portuguese bonds to US junk bonds to provide only meager yields. Should the Fed try to engineer an exit, these yields ought to rise should risk premia expand once again.
If all of this sounds academic, let’s just say that my own conclusion is I wouldn’t touch bonds with a 10-foot pole.
Currencies
Last quarter, the greenback appeared to rise relentlessly. The reason? U.S. interest rates will be so much higher than those in the rest of the world. Indeed, it’s not just the pundits saying so, it’s what the market is pricing in. Never mind the analysis above that the Fed exit might be elusive; never mind the fact that real interest rates are more negative in the U.S. than in the Eurozone; never mind that even if the Fed Funds rate were to move up to 1.75% at the end of 2015 (the market prices in much lower rates), real interest rates in the U.S. would – in our assessment – still be below those in the Eurozone. Never mind that when “everyone” knows the dollar will rise that it just might not happen.
So what is happening? It turns out Mr. Draghi, the head of the European Central Bank (ECB) has become what I would deem “convincingly irrational.” In September, Draghi threw the kitchen sink at the market, announcing more refinancing operations (“TLTROs”), that he will proceed with an Asset-Backed Securities (ABS) purchase program, and that the ECB will buy covered bonds. There are just a few problems with these:
• Demand for TLTROs has been lackluster at best;
• In the Eurozone, there is no ABS market to speak of;
• There is a covered bond market in the Eurozone, but there’s nothing wrong with it.
Since then he has provided some vague guidance on how the plumbing on his kitchen sink is supposed to be working. The Bundesbank is not happy as it appears the ECB is willing to put junk into the sink, i.e., buy risky securities. As background, let’s keep in mind that yields in the Eurozone have plummeted. As an example, Spain, which paid almost seven percent on ten-year bonds not long ago, pays less than two percent now. If that’s not a stimulus, what is? The key reasons the Eurozone economy is stuck include:
• Lukewarm credit demand;
• Inhibited banks; and
• Russian sanctions
Incidentally, monetary policy cannot really help with any of these. We have argued that Russia may have greater impact on the Euro than the ECB; that’s because sanctions against Russia destroy confidence in those Eurozone countries that have done reasonably well. Already some are talking about a potential recession in Germany.
The biggest obstacle may well be banks, as too many banks still have legacy debt on their books tying up their balance sheets. It may well be that Draghi is thinking of buying this ‘junk’ – thereby playing the role of a ‘bad bank’; if so, it may get these banks to lend more. Never mind that this violates principles the ECB was founded on. Mr. Draghi has indicated that all he is interested in is to get inflation back up to 2%, as it’s been drifting lower of late. Notably, he has argued that there is no “quid pro quo” with governments – it’s their job to pursue structural reform, while it’s his job to get inflation to be at the right level. With due respect, unless pigs can fly, cleaning up bank balance sheets is the role of the banks and governments, not the central bank. But as the ECB is becoming the chief bank regulator, it might pursue an interpretation of its mandate that has any ‘Bundesbanker’ scream “nein.” Think of it as a Faustian pact, as the ECB might indeed be able to unleash some credit potential by buying loans of low credit quality.
But why does any of this matter for the euro? When someone throws a kitchen sink at you, you duck. Similarly, euro bulls stepped aside, allowing euro bears to give the currency a beating. To understand whether it will last, let’s keep in mind that signaling for central banks might be more effective than action. The announcements of QE in the U.S. moved the markets more than their implementation. Drawing from the U.S. experience, we consider it very likely that the implementation of Draghi’s new alphabet soup may be far less effective than the announcement of the various programs.
Odds are that the refinancing operations will be ramped up; that in itself may be a positive for the euro as past refinancing operations have shown. We doubt the ABS program will be very large, but may well help to further compress risk premia in the Eurozone; the same applies to buying covered bonds.
Ultimately, the question is when the euro bulls come out of hibernation. It turns out that bulls don’t hibernate, so don’t count them out for too long. An encouraging sign that the euro might have found at least a temporary bottom is that the currency has been rallying on bad economic data coming out of Germany. Please join us for our Webinar on Tuesday, October 21, for how we have navigated the euro.
The yen has had a horrible quarter, too. To see where Japan is headed, just consider that the stadium Japan wants to build for the Olympics is likely to cost about US$1.7 billion; that’s relevant because it shows that Japan will do anything to boost growth.
Investing when everything’s up
So how does one invest in this environment? Prudent rebalancing dictates to take some chips off the table when equity prices are higher. One does not need to share the negative view on the markets that we do to sell some stocks, except of course that “buying the dips” has been a profitable strategy in recent years. At a recent conference, I heard a presentation arguing that the older an investor gets, the more they should allocate to equities. I pointed out that the academic papers he was referring to as backup for his theory were each published ahead of a major market top.
But where does one rebalance to? Our analysis suggests bonds may not be the right place. Having said that, a rebalancing into bonds has worked quite well in the past, including over the past year.
And as we have seen, with Mr. Draghi acting ‘convincingly irrational,’ it’s difficult to recommend blindly fleeing the greenback for the euro. Should investors embrace gold instead? Gold performed even worse than the euro versus the dollar in the third quarter, although significantly outshines the euro year-to-date (last year, the euro far outperformed gold). Talking about gold, it has held on quite well in euro and yen terms. So it’s not gold that’s out of favor on a global scale, it’s just that the greenback has had a major rally. Is it sustainable? There are three reasons I don’t think a dollar rally is sustainable:
• Contrary to conventional wisdom, a rising interest rate environment has historically not benefited the dollar. That’s because foreigners buy lots of US bonds; these bonds tend to be less attractive as interest rates rise. Having said that, we would be the first to admit that this is not a ‘normal’ environment.
• Conventional wisdom suggests the dollar rises in a “risk-off” environment, such as when the stock market plunges. It turns out these correlations are not stable; in the last quarter, the dollar rose on a rising stock market. Conversely, as the market has had a rough ride in the first couple of days of the month, the dollar has tended to fall with a falling stock market. If our negative view of the market proves correct, it may well weaken rather than strengthen the greenback.
• Lots of “good news” is priced into the dollar. Conversely, lots of bad news is priced into the euro. As it happens all too often, the best money is not necessarily made where the grass appears the greenest.
We wouldn’t want to encourage anyone to buy anything blindly – especially not when policy makers around the world continue to be what we call convincingly irrational. Should the world – both politically and from an investor’s point of view – become less stable, it may be prudent to consider allocating risk rather than investments. What we mean with that is that risk management might be ever more important. We have long argued that there may be no such thing as a safe asset anymore and investors may want to take a diversified approach to something as mundane as cash. Should we be right and asset prices globally get re-priced, it won’t be easy. The reason we like currencies is because they provide an avenue not only to produce uncorrelated returns, but also to manage risk.
Axel Merk
Axel Merk is President and Chief Investment Officer, Merk Investments,
Manager of the Merk Funds.
Learn more by joining us for our Webinar on Tuesday, October 21.
If you haven’t done so, also make sure you sign up for Merk Insights. If you believe this analysis might be of value to your friends, please share it on your favorite social media site.

Przemyslaw was correctly short Gold until covering here just recently. He is now bullish & recommending the following position, actual trading positions & stops in the summary at the bottom – Money Talks Ed
Briefly: In our opinion speculative long positions (full) in gold, silver and mining stocks are justified from the risk/reward perspective.
The precious metals market finally rallied yesterday. Gold moved lower in the first hours of the session, getting very close to the Dec. 2013 low, but it rallied before the session was over, finally closing over $16 higher. Is the final bottom in?
The final bottom – not likely. The local bottom – very likely. Let’s examine the charts and see what actually changed (charts courtesy of http://stockcharts.com).
Yesterday, we wrote the following:
The Friday’s rally was huge and it’s no wonder that metals and miners declined. The move took place right after the cyclical turning point, so the odds are that we will not have to wait long for a reversal.
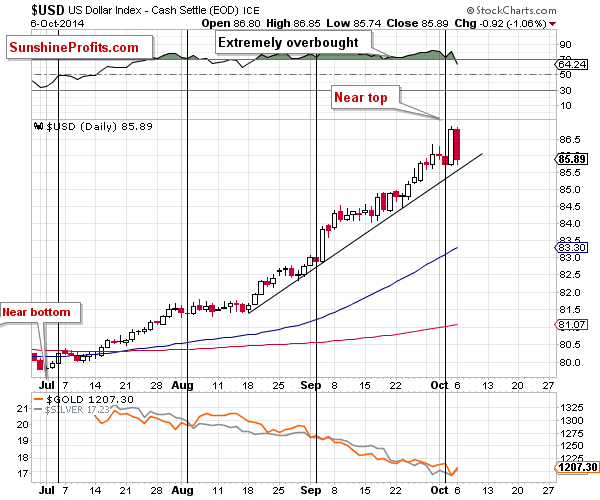
All in all, the outlook for the USD Index is still bearish based on the extremely overbought status, the turning point, and the fact that previous similar breakouts (as seen on the weekly chart) were invalidated.
We already saw a significant daily decline yesterday, so it could be the case that the corrective downswing in the USD Index is already underway. The odds will further increase once we see a move below the rising short-term support line (which is likely to be seen shortly).
What about the precious metals market? It rallied and it’s likely to rally even more.

Larger Image (click twice for super large)
Gold moved almost to its Dec. 2013 intra-day low, which is a very important support, so this fact by itself makes a move higher very likely. The fact that gold rallied shortly after declining to this level and ended the session over $16 higher (and forming a reversal hammer candlestick) makes the situation even more bullish. This kind of action is likely to be followed by further rallying.

Larger Image (click twice for super large)
We recently commented about the gold to USD Index ratio as something that could provide us with technical confirmations. Based on Friday’s and today’s price moves we saw a small decline below the 2008 high (and 2013 low) that was followed by another move higher. Before viewing the decline as a breakdown, please note that back in 2008 the ratio also moved very temporarily below the horizontal support only to invalidate this move and rally shortly thereafter. It seems that we are seeing this type of action once again.

Larger Image (click twice for super large)
Silver moved higher and is once again visibly above the rising, long-term support line. The white metal is likely to rally based on this support combined with its heavily oversold status.

Larger Image (click twice for super large)
Today, we would like to cover a very interesting event that happened in the platinum market yesterday. More precisely, it concerns the platinum to gold ratio. Namely, platinum became, very temporarily, cheaper than gold, and this situation was quickly reversed. The entire event happened on huge volume in the ratio (the ratio of volumes). This kind of action (significant events, reversals and huge-volume sessions) quite often happens at the end of a given move. In this case, the preceding move was definitely down.

Larger Image (click twice for super large)
As far as the mining stocks are concerned, our previous comments remain up-to-date:
Gold stocks are now very close (almost at) their 2013 low, which is a major support level. Combined with a strong support for gold and silver and their oversold status, the above provides us with bullish implications also for the mining stocks sector.
Just a little more strength in the HUI Index will mean an invalidation of the breakdown below 2 support levels, which will be another strong bullish sign.
Summing up, the situation in the precious metals market is still bullish for the short term, even if Friday’s intra-day action might suggest otherwise. Monday’s price action seems to be the true direction in which the market is likely to head next – up. The corrective downswing in the USD Index has probably already begun. The same goes for the precious metals sector, only in this case, the correction would be to the upside. A lot of money has been saved by staying out of the precious metals market in the past months with one’s long-term investments (details below), and it seems that the corrective upswing will provide additional profits from the trading capital.
To summarize:
Trading capital (our opinion):
It seems that having speculative (full) long positions in gold, silver and mining stocks is a good idea:
- Gold: stop-loss: $1,172, initial target price: $1,249, stop loss for the UGLD ETF $11.29, initial target price for the UGLD ETF $13.56
- Silver: stop-loss: $16.47, initial target price: $18.07, stop loss for USLV ETF $23.94, initial target price for the USLV ETF $31.73
- Mining stocks (price levels for the GDX ETF): stop-loss: $19.94, initial target price: $23.37, stop loss for the NUGT ETF $18.25, initial target price for the NUGT ETF $28.99,
In case one wants to bet on higher junior mining stock ETFs, here are the stop-loss details and initial target prices:
- GDXJ stop-loss: $28.40, initial target price: $37.14
- JNUG stop-loss: $6.19, initial target price: $16.34
Long-term capital (our opinion): No positions
Insurance capital (our opinion): Full position
Thank you.
You will find details on our thoughts on gold portfolio structuring in the Key Insights section on our website.
As always, we’ll keep our subscribers updated should our views on the market change. We will continue to send them our Gold & Silver Trading Alerts on each trading day and we will send additional ones whenever appropriate. If you’d like to receive them, please subscribe today.
- Gold-bearish Western bank economists are very lucky. They can gleefully ignore Indian black market imports in their assessment of demand and supply, and nobody questions them.
- Thus, a tiny outflow of gold from Western ETFs in September is relentlessly highlighted as a harbinger of gold price doom, while recent reports that India is importing more than 15 tons a week in the black market, are swept under the rug.
- Unfortunately for the bearish economists, they can’t ignore official imports in India. The consensus among economists was for Indian September official imports to come in at about 60 – 80 tons. Pleaseclick here now.
- The official imports soared to 131 tons for September. It did so with all the import duties fully in place. That can’t be ignored, and coupled with another 60 tons of unofficial imports, total demand was probably about190 tons.
- I’ve argued that the biggest game changer for gold price discovery would be the addition of more LBMA-certified refineries in onshore India. On that note, please click here now.
- Rajesh Khosla runs India’s only LBMA-certified refinery, and he’s calling for more to be built, to encourage FDI (foreign direct investment) in India’s jewellery industry.
- Indian Prime Minister Narendra Modi takes great pride in his track record of encouraging economic growth. Gold jewellery is the second largest employer in India. It will become harder and harder now, for Modi to remain silent about gold….the world’s ultimate asset!
- To view the entire article, please click here now. It’s critical that members of the Western gold community understand that the monetization program proposed by Khosla and the bullion banks only targets about 250 tons a year of scrap gold.
- The bulk of the refining would be aimed at gold that is mined by Western mining companies.
- While demand skyrockets in India, please click here now. A week ago I urged short term traders and options players to be patient, and wait for my price stoker oscillator to reach the 21 area, before buying. It’s there now, and gold looks ready to launch an assault on overhead HSR (horizontal support and resistance), in the $1240 area.
- The meltdown in Japanese and European GDP has caused most fiat currencies to sink against the dollar. In the big picture, this is likely to increase inflation in China, and could create a significant increase in gold buying, by inflation-wary citizens.
- The US dollar is strengthening on economic weakness in other nations, rather than on economic strength in America. That’s very dangerous. Global demand for oil is collapsing, and the dollar rally is exacerbating the problem.
- If oil prices decline further, the entire fracking-focused US oil boom is at risk of imploding. If that happens, America could be thrown back into recession.
- In the short term, the dollar rally seems overdone. Please click here now. The weekly chart shows the Canadian dollar arriving at significant buy-side HSR, in the 88.73 area. A rally towards the 90 – 91 zone would likely coincide with gold rising towards $1240.
- I’ve argued that oil price deflation could create a massive rally in gold stocks, while gold rises modestly, moves sideways, or even declines slightly.
- That’s because falling oil prices are reducing the cost of mining gold. Please click here now. Note the RSI oscillator. It’s turning sharply upwards from the 30 area on this daily GDXJ chart.
- Junior gold stocks are dear to the heart of the Western gold community, and I’m looking for an initial rally towards $34.22, with follow-through action to the $36.76 area.
- If oil declines further, while bank economists begin to acknowledge the gargantuan surge in gold demand that is occurring in India, they may begin to aggressively recommend gold stocks to their high net worth clients.
- On that note, please click here now. With the prospect of rising interest rates, money managers are nervous about moving money from stocks to bonds. Gold stocks are the only sector of global equity markets that should be of interest to value-oriented fund managers.
- A major decline in oil prices that causes a collapse in global stock markets while Indian gold demand surges, is likely to entice those money managers to recommend gold stocks to their clients.
- As the dollar has rallied, the price of silver has declined significantly, and the gold to silver ratio has soared to the 70 – 80 area.
- What are the implications for silver, if there is a global stock markets crash caused by deflating oil prices?
- For the likely answer, please click here now. That’s the monthly chart of the gold to silver ratio. I sold about one third of my physical silver position for gold in 2011, and I’m starting to buy it back in small stages now, using my pyramid generator to systematically allocate capital.
- I view the 70 – 100 gold to silver ratio area as offering value for silver investors, and the 45 and lower area as an area of value for gold investors. If the United States economy collapses back into recession because of deflating oil prices, there’s no question that the gold to silver ratio could rise even higher. Regardless, the dropping cost of mining, would likely mean that silver stocks would enjoy the same type of interest from institutional money managers as gold stocks!
Special Offer For Money Talks Readers: I’m currently in Australia for a week, for a gold conference and other matters. Please send me an Email to freereports4@gracelandupdates.com and I’ll send you my free “Throw A Gold Bear On The Barbie!” report. I’ll show you my favourite Australian gold stocks with significant upside potential, and outline the tactics I’m using to play them. I’ll also include information on the “Swingograms”, a technical indicator I use to predict sizable rallies in gold stocks.
Thanks!
Cheers
st
Stewart Thomson
Graceland Updates
Note: We are privacy oriented. We accept cheques. And credit cards thru PayPal only on our website. For your protection. We don’t see your credit card information. Only PayPal does. They pay us. Minus their fee. PayPal is a highly reputable company. Owned by Ebay. With about 160 million accounts worldwide.
Written between 4am-7am. 5-6 issues per week. Emailed at aprox 9am daily.
Email: stewart@gracelandupdates.com

-
I know Mike is a very solid investor and respect his opinions very much. So if he says pay attention to this or that - I will.
~ Dale G.
-
I've started managing my own investments so view Michael's site as a one-stop shop from which to get information and perspectives.
~ Dave E.
-
Michael offers easy reading, honest, common sense information that anyone can use in a practical manner.
~ der_al.
-
A sane voice in a scrambled investment world.
~ Ed R.
Inside Edge Pro Contributors

Greg Weldon

Josef Schachter

Tyler Bollhorn

Ryan Irvine

Paul Beattie

Martin Straith

Patrick Ceresna

Mark Leibovit

James Thorne

Victor Adair