
Timing & trends
 To listen to Martin Armstrong interviewed Saturday by Michael Campbell on Money Talks go HERE.
Below is what Michael wrote about Martin before this Saturday’s extended Money Talks Interview. (anyone clicking on the HERE its the second mp3 titled Sept 20th Interview of the Week in which Michael and Martin speak)
“To be blunt I don’t usually have time to drop a note regarding my upcoming guest on MoneyTalks but today I’m making an exception.
That’s because for the first time in 15 years the brilliant Martin Armstrong will be my guest. If you don’t know Marty’s work let me sum up by saying, over the last 36 years I have met alot of wonderful analysts – brilliant thinkers – but if I could only talk to just one – it would be Martin Armstrong. His understanding of history, currency movements and the interaction of the widest range of variables on different investments is second to none.
His model has proven ridiculously accurate in its predictions. Including the 1986 published report – The Cycle of War – that foretold that 2014 would mark a dramatic upturn in civil unrest and geopolitical conflict. That isn’t a typo – that was 1986. In January, 2013 he predicted the date for Russia’s incursion into the Ukraine would be the last week of February, 2014.
I wasn’t surprised given that his model had accurately predicted, well in advance, the stock market crash of October 19, 1987, the fall of the Berlin Wall in November 1989 and the precise date of the peak of Japan’s Nikkei Index on December 29, 1989.
His model accurately predicted the bottom in gold, the Canadian dollar and oil – but the point is that when Marty’s model points to an important date I pay attention. As do money managers, investors and governments from around the world.
I am confident that it won’t take more than a few minutes of hearing Marty live to find out why. His methodology is unique as is his global perspective on every aspect of the investment markets.
This week I want to find out what his model says about the bond market. So far his model has been right on with gold but what’s next … should I buy? Have we reached bottom?
What about the stock markets after the strong moves in 2014 – (which he predicted)? How do I know when to sell? Should I buy any pull back?
I have a lot of questions but my point is there is no one I’d rather ask than Martin Armstrong.
Join me Saturday at 9:05 am PST – to hear Martin Armstrong. To listen live while travelling go to CKNW.com – or check it out on Moneytalks.net after the show.
I guarantee it will be worth your time.”
Mike

Gold stocks have plunged in September, crushed by the withering selling pressure from heavy futures shorting hammering gold. As usual, these falling prices have kindled extreme bearishness on this left-for-dead sector. But despite this rotten sentiment, gold stocks’ young upleg remains very much intact technically. This impressive resiliency is fueled by these miners’ incredibly-cheap fundamental valuations.
Gold stocks are without a doubt the most despised sector in all the stock markets. Thanks to the Fed’s brazen debt monetizations and manipulations of interest rates, the global markets are distorted beyond belief. Stock markets have soared to extreme valuations on the Fed’s implied backstopping, leading to epic complacency, greed, and hubris. That artificial levitation sucked vast capital out of alternative investments.
When stock markets do nothing but rally thanks to the Fed, the perceived need for prudent portfolio diversification with alternative investments like gold has vanished. And with investor interest in gold virtually dead, the gold stocks have suffered mightily. Nearly everyone believes they are doomed to spiral lower forever. To be bullish on this loathed sector guarantees ridicule and mocking these days.
Nevertheless, a hardcore remnant of contrarian investors remains very bullish on this sector. They have studied market history, and remember core truths that the Fed has blasted from most minds. Markets are forever cyclical, they rise and fall. Any extreme in sentiment and prices is soon followed by a major reversal. Exceptionally-high greed-fueled prices soon fall, and exceptionally-low fear-drenched prices soon rise.
Contrarians know that successful investing demands buying low then selling high. And the cheapest stocks are always the most hated, the sectors with the most universal and overwhelming bearishness. They have the most potential to explode higher and multiply wealth when sentiment inevitably shifts the other way. That’s why smart investors including elite billionaire hedge-fund managers are long gold stocks today.
Gold-stock fundamentals are exceedingly easy to understand. Gold miners obviously mine gold. And their production costs are largely fixed when mines are built. So their profitability is determined by the gold price. When gold climbs, their profit margins and absolute earnings soar as their costs stay pretty stable. So these companies are ultimately a leveraged play on the gold prices which drive their profits.
Across all the markets, any stock’s underlying profitability determines what its fundamentally-sound price levels should be. Gold stocks are no exception, as they will eventually climb dramatically to trade at reasonable valuations relative to their profits. And not only will their earnings surge as the gold price itself recovers from today’s sentiment extremes, gold stocks are dirt-cheap relative to current low gold levels!
Gold stocks are now languishing at a fraction of their fair value relative to gold because of the epically bearish sentiment plaguing them. But such emotional extremes never last, they are inherently self-limiting and soon burn themselves out. When psychology in this gold-stock sector finally normalizes, the miners’ beaten-down stock prices are going to surge higher to reflect their earnings fundamentals.
This first chart highlights today’s extreme anomaly in gold-stock price levels that was indirectly driven by the Fed’s super-manipulative quantitative-easing campaigns and zero-interest-rate policy. It looks at the ratio of gold-stock price levels relative to the gold price that drives their profits. Since ETFs have grown so popular with traders, I’m using the dominant American ones as proxies for gold-stock and gold price levels.
Gold-stock prices are represented by GDX, the benchmark Gold Miners ETF. And gold prices are represented by the mighty GLD SPDR Gold Shares gold ETF. Dividing the price of the former by the latter and charting it over time shows whether gold stocks are gaining or losing ground relative to the metal that drives their profits and hence ultimately stock-price levels. This chart is still a stunning wake-up call.

MoneyTalks Ed Note: Here is the close of the GDX Sept. 19th/2014

This blue GDX/GLD Ratio line is the key to understanding why contrarians remain so bullish on such a seemingly-hopeless sector. Before 2008’s crazy once-in-a-century stock panic sucked in gold stocks, they traded at a pre-panic average GGR of 0.591x. In other words, a share of GDX was worth about 6/10ths of a share of GLD. The epic fear generated by 2008’s stock panic shattered that long-standing relationship.
GDX plummeted 71% in a matter of months, as many if not most gold-stock investors capitulated and sold low in the dark heart of that panic. Much like today, bearishness was off the charts. But as Warren Buffett has wisely said, the time to be brave is when everyone else is afraid. The greatest times to buy low are when a sector’s stock prices seem the most hopeless. With most investors out, they are just too cheap.
In late October 2008, the GGR had cratered to just 0.227x. The extreme and unsustainable selling that was driven by extreme and unsustainable bearish sentiment had crushed gold-stock prices to a fraction of their fundamentally-righteous levels relative to the metal that drives their profits. Then, like now, contrarians like me bullish on gold stocks were mocked. But we made fortunes as they inevitably mean reverted.
Over the next several years, GDX would more than quadruple with a 307% gain! Buying low pays off big. And coming out of such a crazy low-priced anomaly, gold stocks’ gains easily exceeded those of gold itself. So the GDX/GLD Ratio blasted higher, ultimately stabilizing around 0.419x over the next two-and-a-half years. That level is critical to remember, because it persisted during normal post-panic years.
By August 2011 gold itself grew very overbought and overdue for a major correction, which I warned about right as it topped. And as usual since gold stocks are leveraged plays on gold prices, they fell faster than gold which dragged the GGR back down. It bottomed and reversed normally in mid-2012, but then the Federal Reserve launched its unprecedented open-ended QE3 campaign to manipulate financial markets.
QE3 changed everything in the markets, and temporarily destroyed the demand for gold. Not only was the Fed monetizing bonds with new dollars created out of thin air, it was constantly jawboning that it was ready to ramp up QE if the economy (read “stock markets”) weakened. So stock traders took this as an implied backstop, a Fed put on stock prices. So market history be damned, they ignored all risks to keep on buying.
Capital fled from gold to chase the levitating general stock markets, driving a once-in-a-century gold plunge in the second quarter of 2013. Gold stocks were crushed on this, ultimately falling 69% from their peak on a GDX basis to hit their worst levels since the stock panic’s. But the amazing thing was the GGR actually fell to an all-time low well below late 2008’s. Gold stockshad never been cheaper relative to gold!
This mother of all gold-stock lows happened late last year, days after the Fed announced it was starting to slow down its massive QE3 bond monetizations. Ever since then, gold stocks have been fighting the extreme bearish sentiment headwinds to rally on balance. They are starting to regain ground compared to gold, with the GGR enjoying its best rallying streak so far this year since 2010. Gold stocks have already reversed!
For 6 long years, gold stocks lost ground relative to gold. As the relentlessly-downward-sloping GGR shows, they became cheaper and cheaper compared to their earnings power. The GGR kept being repelled at the strong secular resistance line shown above. But early this year the GGR made another attempt to break out to the upside, and that finally succeeded only a few months ago this past June.
This decisive GGR breakout on top of its strong new uptrend since late last year shows that gold stocks have reversed. The 6-year downtrend in their prices relative to gold is over. And that makes perfect sense. The markets are forever cyclical, no trend lasts forever. Contrary to the bears’ foolish assertions, there was just no way gold-stock prices could continue falling compared to the driver of their profits indefinitely.
After 6 years of the GGR retreating, how long is its mean reversion from bearish to normal to eventually bullish sentiment going to take? Several years at least, and likely longer since great market cycles tend towards symmetry. And that’s why gold stocks are so darned bullish and exciting today. They are dirt-cheap after years of falling out of favor, so their upside potential from here is enormous beyond belief.
Remember that in the normal post-panic years before overbought gold corrected and before the Fed’s extreme market manipulations of QE3, the GDX/GLD Ratio averaged 0.419x. This week it slumped to 0.199x, actually well below the worst levels of 2008’s epic stock panic. So merely for gold stocks to regain fundamentally-normal prices relative to gold at today’s levels GDX would have to surge 110% higher!
You read that right. Even at today’s dismal $1250ish gold prices, gold stocks would need to more than double from here to reflect the metal’s impact on their profitability now. And that’s a very conservative target for two reasons. First, after such extreme bearishness gold stocks shouldn’t stop rallying at merely normal sentiment. The great emotional pendulum should swing far back into the opposite greed side.
So at some point in the next several years, gold stocks are highly likely to power much higher than that post-panic GGR average. They’ll likely attain the pre-panic average of 0.591x, and maybe even higher for a short spell when euphoria flares. Second, gold itself isn’t going to keep languishing near $1250. As the Fed’s artificially-levitated stock markets inevitably roll over with QE3 ending, gold is going to surge.
Alternative investments thrive when conventional ones are struggling. So once the lofty stock markets decisively roll over, investors will remember gold’s unparalleled value as an essential asset to diversify portfolios. Capital will flood back in. Provocatively despite popular wisdom, rising rates will help this. Gold has thrived in rising and high-rate environments historically since they hit stocks and bonds hard.
That’s why I still strongly believe gold stocks are going to at least quadrupleover the coming several years again just like they did after 2008’s anomalous stock-panic low. Pick any GGR higher than the post-panic average, and a gold price way higher than today’s, and the gold-stock price targets surge accordingly. At a 0.6x GGR and $2000 gold for instance, GDX would quintuple from today’s low levels.
Being a quasi-prominent contrarian on the stock markets and gold, my e-mail inbox explodes whenever the former surges near highs or the latter wilts. Myopic traders with no understanding of market and sentimentcyclicality gloat about how stocks will rise forever while gold falls forever. What a dumb bet. And weaker investors succumb to bearish groupthink and fret that some major new gold plunge is imminent.
But despite all the fear and bearishness on gold and gold stocks this past month’s futures-shorting-driven selloff has generated, its impact on the GGR is trivial. Note above that the recent weakness in gold stocks relative to gold barely registers in this long-term chart, and the GGR remains near both its 200-day moving average which recently turned higher and its new uptrend’s support. There is no damage.
That is true technically too. While gold stocks’ dirt-cheap fundamentals are the key reason contrarians are so bullish on them, their price action looks fine despite the past month’s selloff. This next chart looks at gold-stock technicals through the lens of the flagship GDX gold-stock ETF. Though its price action is a secondary concern, so many traders are worked up about this latest selloff that it bears examination.

Despite all the sound and fury and the bears’ supreme hubris this week, GDX remains within its major new uptrend that was born almost 9 months ago in late December 2013! Gold-stock prices are near support and look to be bottoming at another higher low. We’ve seen gradual and sustained buying of gold stocks by smart investors all year long despite the fierce headwinds from the Fed’s stock-market levitation.
GDX’s 200-day moving average, which usually signals the long-term trend direction, continues to move higher after reversing several months ago. And GDX’s 50dma crossed back above its 200dma twice this year, confirming gold stocks’ Golden Cross buy signal. There is literally nothing bearish about this chart, it is actually powerfully bullish for a young upleg. Gold stocks continue to advance on balance technically.
Long-term investors look to major downside fundamental-pricing anomalies to buy low, like the GGR today reveals. But short-term speculators look at trends and support approaches. And GDX’s chart clearly shows gold stocks are at their third best buying point since their decisive reversal late last year. Buying when prices near support in strong uptrends is one of the best ways to make money in trading.
Zooming out to the bigger picture technically, gold stocks have been consolidating sideways in a massive basing formation since last summer. The second quarter of 2013 was gold’s worst quarter in a whopping 93 years, so it spawned off-the-charts bearishness. Ever since, the vast majority of traders have been utterly convinced that gold, silver, and their miners’ stocks are doomed to spiral lower forever.
These weathervane bearish calls couldn’t have been more wrong though. Enough buyers emerged to snatch up all the sellers’ gold-stock shares, leading to the past 15 months’ bottoming consolidation zone. If gold stocks couldn’t be hammered lower with gold sentiment so epically bearish for so long, just imagine how they will soar when psychology mean reverts out of these extremes. It’s going to be amazing.
So with gold stocks exceedingly cheap fundamentally and at an outstanding buy point technically, what are you going to do? Have you forged yourself into a contrarian tough enough to fight the crowd and buy low? Or are you slave to herd groupthink? Will you buy low when a sector is deeply out of favor and reversing higher? Or will you wait until after gold stocks already double and miss the easy gains?
The right answers are so glaringly obvious. The high and loved stock markets can’t rise forever and are long overdue for a serious selloff. And low and hated gold and the stocks of its miners can’t fall forever and are long overdue for a gigantic mean-reversion upleg. With bearishness in gold extreme with it near consolidation lows, and its miners epically undervalued, how can this not be an ideal time to buy low?
At Zeal we’ve always been hardcore contrarians, buying low when few others will to multiply fortunes. So while gold stocks remain the pariah of the stock markets, we’ve continued to diligently research them to prepare for their coming massive moves higher. Just this week, we finished our latest3-month project to ferret out the best advanced-stage junior gold explorers. These elites have vast upside potential dwarfing GDX’s.
We started with over 600 junior gold stocks, and gradually narrowed them down to our dozen favorites with the best fundamentals. All these winners are profiled in depth in our brand-new 23-page report. It is incredibly fortuitous to have one of our deep-research projects conclude when gold stocks happen to be at a super-bullish major low. So don’t tarry, buy your new report today while these stocks remain dirt-cheap!
With the stock markets and gold at such extremes, cultivating a contrarian mindset has rarely been more important. We’ve long published acclaimedweekly and monthly newsletters to help investors and speculators like you gain that critical contrary perspective. They draw on our decades of hard-won experience, knowledge, wisdom, and ongoing research to explain what’s going on in the markets, why, and how to trade them with specific stocks. Subscribe today before Wall Street fleeces you blind!
The bottom line is gold stocks remain radically undervalued relative to the metal which drives their profits, even at today’s dismal gold levels. After falling faster than gold for 6 long years, this secular trend has reversed over the past year. This was despite the extreme bearishness plaguing this sector. Gold stocks’ mean reversion back up to normal valuations should run for at least several more years.
And after suffering such epic valuation anomalies, gold stocks are again due to at least quadruple like they did after 2008’s stock panic. The futures-shorting-driven gold selloff over the past month pushed gold stocks back down to their new uptrend’s support, creating a fantastic buying opportunity. While not everyone is smart or tough enough to fight the crowd and buy low, those contrarians that do will be richly rewarded.
###
Sep 19, 2014
Adam Hamilton, CPA
So how can you profit from this information? We publish an acclaimed monthly newsletter,Zeal Intelligence, that details exactly what we are doing in terms of actual stock and options trading based on all the lessons we have learned in our market research.
The following is a plausible forecast / prediction
Despite my known disdain for time and price predictions, I base the plausible forecast for an October 2014 generational low in the dollar-denominated value of Silver upon the cyclical duration of a prior elongated bear market that occurred from May 1968 thru November 1971.
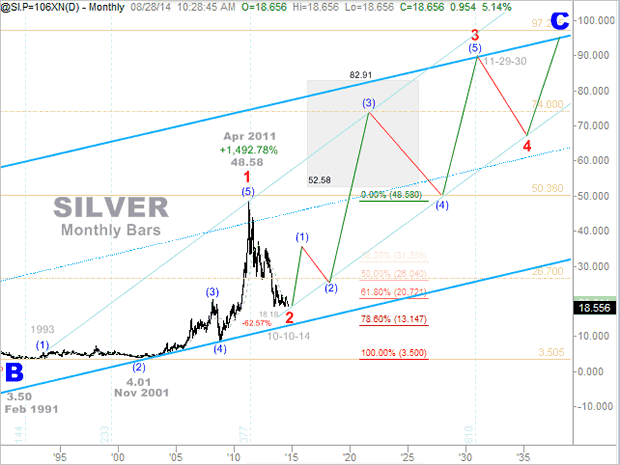
Back then, the price of Silver declined by more than 50% over the course of 3.46 years. We have already surpassed (-62.57%) the magnitude of the previous decline amid the current bear market, and we are rapidly approaching symmetry with the previous time duration – hence, the probability of a similar cyclical low soon forthcoming.
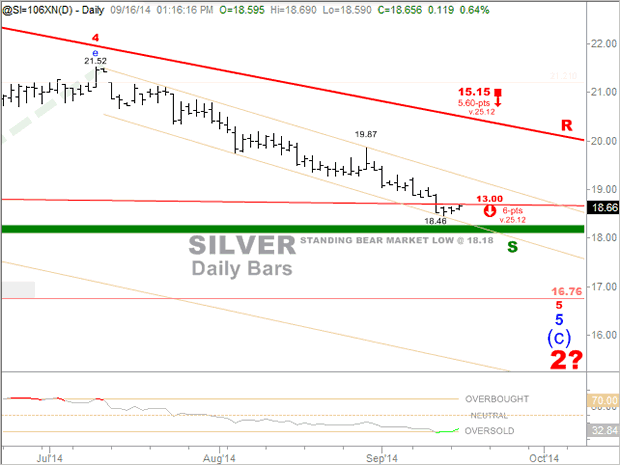
How low can the dollar-value of Silver go before the next generational bottom is in? – From my perspective, there are three such price targets following a retest and plausible breach of the standing bear-market low at $18.18. The nearest is $16.76, and so long as the price of Silver remains beneath $25.12, the second is $15.15, and the last downside price target we have on record is $13.00.
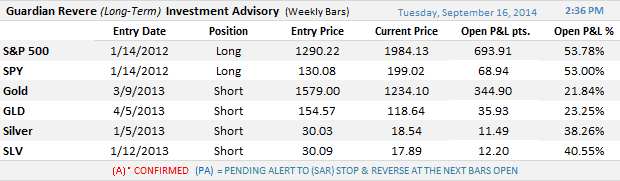
Our Long-Term Trend Monitor subscribers have been hedging their physical rather successfully for nearly two-years now. (See below stats)
Until Next Time,
Trade Better / Invest Smarter
Bottom line – Predictions and forecasting aside, all that matters to our subscribers and us – is being right more often than being wrong, and establishing prudent hedges along with winning and profitable trades in every timeframe. This is what we’ve been all about accomplishing for our members since 2005.
Do you think that you can benefit from such guidance, yes, or yes? Whatever your timeframe and objectives, we have prudent and effective solutions without all the hype and nonsense
Via real-time email alerts and daily PDF reports, the Chart-Cast Pilot conveys exclusive actual positions taken within the portfolio, which continues to sport a phenomenal performance record in every timeframe.
Updated quarterly with unlimited email alerts as market conditions dictate, the Long-Term Trend Monitorprovides the exact same type of service – but is dedicated exclusively to the self-directed long-term index investors of the equity and precious metals worlds. It too performs extremely well, and with limited downside risks.
When compared with “going it alone,” or employing an exorbitantly commissioned hedge fund for so-so results, especially after fees, the choice should be a rather simple one.
The Chart Cast Pilot and Elliott Wave Technology’s Guardian Revere Long-Term Trend Monitor are the proud sponsors of this communication.
Regardless of what the near term may bring, the long-term outlook for gold has not changed. It’s still subject to powerfully bullish forces that will ultimately drive it to $5,000 an ounce and beyond — a massive flight to quality from investors around the world, the madness of bankrupt governments, rising geo-political conflict, and more. Ed note orignally published Sept. 16th.
 But for the near term, the line in the sand has been crossed and we are witnessing a temporary extension of the precious metals bear market. That’s news none of us want to hear, but it’s undeniable.
Always keep in mind that the extension of the bear market in the precious metals also opens up profit opportunities:
Opportunity #1: To profit as the precious metals and mining shares decline.
Opportunity #2: As they decline, die-hard bulls will get washed out of the markets. That will be a great time for you to pick up bargains. And it will provide the necessary fuel for an even greater bull market to follow.
Now, let me turn to what is happening, and why.
First, neither gold nor silver has elicited any buy signals during the past few months, casting a shadow over them the entire time, which is precisely why I recommended refraining from becoming too aggressive on the long side over the past few months.
Second, the deflation specter that is haunting Europe is worsening. Deflation is taking a firm hold on the euro region, and the European Central Bank (ECB) is now taking aggressive steps to devalue the euro.
Those steps, though, will not be enough to stem the tide of deflation in Europe. Further euro devaluations lie on the horizon.
 Third, deflation will now become an ever growing threat in the U.S. as the euro tumbles in value and the dollar continues to soar.
Fourth, I am seeing further deflation already whack the grain markets, which continue to drop sharply. This I expected. But the speed of the recent declines in markets such as wheat, soybeans, corn and even coffee and sugar tells me deflation is already a growing threat in the U.S.
Fifth, and perhaps the No. 1 question on most of your minds, is the war cycles and their positive impact — or lack of impact — on precious metals.
My studies continue to tell me that on a long-term basis, rising social and geo-political discontent will be the No. 1 driving force behind a resurgent precious metals bull market.
 But for now, when combined with the very serious deflation that is hitting Europe, it seems that the war cycles are having the opposite effect, prompting savvy money to simply abandon the euro and go largely to cash, and U.S. equities, which by default, is bearish for gold and silver …
And (mistakenly) into U.S. Treasuries, which is why interest rates are now nearing record lows again.
Let me address what are probably your top two questions right now: How low can gold and silver go and how long will their renewed bear markets last?
My answers:
1. From a technical perspective, it would not be unusual for gold and silver to drop back to near the origins of their previous major breakout points.
Based on the continuous nearest futures, that would put the ultimate lows in target ranges of roughly $920 to $970 in gold, and, worst case, $12.50 for silver.
2. Timing-wise, my cyclic work is now showing two targets for the final lows.
The first comes in January/February 2015 and the second in June. Odds favor the January period.
Now, what to do …
FIRST, and foremost, do not expect the precious metals to immediately collapse.
They are deeply oversold and important short-term support levels are near at hand. Put another way, we are likely to first see a sharp bounce, before the downtrend resumes.
That bounce could bring gold back up to the $1,280 level, even the $1,300 level. Silver could bounce to the $20 area.
Regardless of any bounce …
SECOND …
A. Now is not the time to buy any additional precious metals, in any form.
B. Now is also not the time to add any more miners.
And …
THIRD, for any existing precious metals holdings you have, sit tight. But use any upcoming bounce to hedge those holdings, via an inverse ETF such as the PowerShares DB Gold Short ETN (DGZ).
(Real Wealth Report subscribers will be getting specific hedge recommendations this Friday in the September issue. To learn more about the specific strategies I recommend to hedge your holdings, and to become a Real Wealth Report member, simply click here now.)
Above all, stay tuned and alert. As I stated at the outset of this column …
- There will be many opportunities to profit as the precious metals and mining shares decline.
- There will also be several enormous opportunities to pick up bargains down the road.
In bullion, in mining shares, and in other natural resources.
To add your view on these or any other matters, go to the comment section below. And watch your inbox tomorrow morning for my regular column.
Best wishes,
Larry
P.S. Did you miss Martin’s briefing yesterday? Don’t worry — there is still time to view it! Martin revealed the investment strategy that he personally built from the ground up — the strategy that could have multiplied your portfolio more than SEVEN times over with a 613% return since 2005. You don’t want to miss this video … click here to watch now!
 “I’ve been thinking, the people at the Fed may be deceivers and even liars, but they are not stupid. They know that the current system depends on constant, never-ending growth. But they also know that “no tree grows to the sky.” So what are they really thinking? The people at the Fed realize that they have good jobs and that they have prestige.
They also know that they will continue their Keynesian policies for as long as they are employed by the Fed. And then when the system breaks down, which it must some day, they will be retired and the next Fed employees will take over. So enjoy it while it lasts and let the next guy deal with the ugly consequences. The Fed members may be deceitful and given to lies — but they are not stupid.
I guess the worst offender was Alan Greenspan, who while younger wrote a classic piece on the value of the gold standard. Later as Fed head, Greenspan turned his back on gold in favor of Fed-created fiat currency. Talk the truth when you’re young and idealistic. But when it comes to money and prestige, do whatever the circumstances call for. Is honesty and truthfulness just a matter of convenience?
Friday saw the Dow close below the lower band of its trading range. I accepted this as a bearish indication. When an item closes below a major big number such as 17000, it is usual for the item to decline to test the next big number. The next lower big number on the Dow is 16000. I don’t expect the Dow to collapse or crash down to 16000. In fact, I think we could see the Dow fluctuate around for a time before making its way down to 16000. My brilliant friend, Gary Shilling, believes we are in a period of ten years during which the world will deleverage and deflate. Gary believes that we have passed through six of the ten years, and that we have another four years of deflation and deleveraging to go.
I just received The Campbell Real Estate Timing Letter. This is a unique advisory service that treats the real estate industry with a technical approach. Campbell uses a series of six studies to deliver buy (bull) signals for real estate and sell (bear) signals for real estate. At present Campbell is on a bull signal. But he warns, “GAINS IN US HOME PRICES TO LOSE MOMENTUM.” In other words, Campbell’s studies suggest that we are sliding towards a sell signal.
As an indicator of current sentiment, I often use what I call the real estate indicator for NYC real estate. Prices for choice apartments or condos in NYC are in the tens of millions of dollars. The winner is an article in the New York Times stating that garage space for single cars is going for one million dollars in various choice buildings with waiting lines in some cases for space. Many foreigners (Chinese, Russian) have purchased space in NYC “just in case.” A lot of these apartments are unoccupied but are held for “emergency purposes.”
I suspect that a lot of big money is exiting the stock market in this area. And of course it’s doing it quietly and subtly. Distribution days are a good way to track the path of large investors. A distribution day occurs when an average or an index declines on volume above the preceding day’s volume. There are now two distribution days in the S&P and also in the NASDAQ. A collection of four or five distribution days within a two week period can usually halt any rally.
Investor’s sentiment in this area is “beyond white hot,” and every dip in the averages of a few points or more is seen as an opportune “buy spot.”
My old friend, Bob Prechter, of Elliot Wave fame believes that the great super-cycle bull market may now be close to topping out. His studies suggest that the coming super-cycle decline may take the Dow below 4000 near its final conclusion. Bob suggests that the dividend yield at the bear market bottom may be zero, because dividends on all stocks will be omitted. Gad, how bearish is that. But Prechter isn’t kidding, he’s serious!
October is the time when the Fed states that it will halt its quantitative easing. The Fed believes that by that time the US economy will be strong enough to get by on its own without QE. And I wonder whether the Fed actually believes that and whether the Fed will actually jettison QE. Of course, the Fed’s monthly bond-buying has helped to keep bonds higher and interest rates low. Previously when the Fed threatened to cut QE the stock market fainted, but the Fed believes this time it will be different.
Different? Below we see the widely followed 30 year T-bond. It appears to be crashing ahead of the Fed’s action. Of course, as the bond declines, interest rates go up. The US has been managing its huge deficits with the help of zero interest rates. If rates increase (as they are now doing) the management of the US debt becomes a nightmare. So will the Yellen Fed actually eliminate QE? That’s the question of the hour, the day, and the month. My thinking is that they won’t have the nerve to remove QE. And if they continue QE, the markets will take that as a sign that the Fed doesn’t believe the US economy is strong enough to survive without its beloved QE.

I couldn’t resist including this P&F chart of the Dow. Here we see this horrendous break down to the 16350 box. I expect a period of zig-zags and meaningless fluctuation. After a break like this, it’s normal to see some mixed action and an attempt at recovery. Have you ever seen a boxer get knocked to the canvas? He summons all his strength and staggers unsteadily to his feet – and then weaves around until his head clears.

Late Notes – As I suspected, after breaking under 17,000, the Dow is now recovering from that shock, and is bouncing around aimlessly.
Let me make one thing clear: I sincerely hope that the bull market will be reconfirmed and that my weary bones will have a vacation from anxiety. The Fed with its Keynesian vision believes it can hold off a correction forever. In the history of the stock market, that’s never been done.
Confidence and complacency are more acute now than anytime I’ve seen before. All expressions of overvaluation are at historical extremes. Despite this, most money managers remain in the market. The thesis is “if it’s going up, regardless of anything else, I want to be in it.” Perhaps the best indicator of complacency is the VIX which at its current level of 13 tells us that investors see no reason to protect their positions. Every minor decline is seen as a buying opportunity. The rationale is that the Fed would not allow anything worse than a 10% decline. If the stock market starts sinking between now and October 1st, I will be most interested to see if the Fed eliminates QE.
Despite the surging dollar, gold today is well over $1200, suggesting internal strength of the yellow metal. …Thus I think that the gold universe is strong and that we are building a massive base in gold. By the way, the chatter against gold has been almost deafening of late — no doubt inspired by the Fed’s denigration of gold.
Over the next few months, I expect a resumption of the gold bull market that started in the early 1930s. From a price of $20/ounce in 1930, gold has constructed an enormous bull market that has taken the yellow metal, despite a three year long correction, to a price above $1200 today. Remember, every currency that has sent gold packing has either lost its purchasing power or has disappeared. Thus it is only a matter of time before the US dollar meets its demise. RIP.”
The 90 year old Richard Russell still writes market advice daily. Contact his service at Dow Theory Letters HERE

-
I know Mike is a very solid investor and respect his opinions very much. So if he says pay attention to this or that - I will.
~ Dale G.
-
I've started managing my own investments so view Michael's site as a one-stop shop from which to get information and perspectives.
~ Dave E.
-
Michael offers easy reading, honest, common sense information that anyone can use in a practical manner.
~ der_al.
-
A sane voice in a scrambled investment world.
~ Ed R.
Inside Edge Pro Contributors

Greg Weldon

Josef Schachter

Tyler Bollhorn

Ryan Irvine

Paul Beattie

Martin Straith

Patrick Ceresna

Mark Leibovit

James Thorne

Victor Adair