
Timing & trends
Remember our prediction for the US economy? First Tokyo, then Buenos Aires. That was our guess when the crisis of 2008-09 began.
The idea was simple: The crisis would lead to economic stagnation a la Japan… which would eventually be resolved by government money-printing and inflation.
Held up against the facts, that prediction is an obvious forgery. It is correct in the broad outlines of the last six years. But the details are missing… including some very important ones.
Unlike Japan, the US stock market rallied. The bounce that we thought would be temporary and small turned out to be huge… and continues until today. Investors who took our advice successfully avoided one of the great bull markets of history.
Will it last? Is it real? Who will have the last laugh? We don’t know. But for the moment, you will hear no satisfied giggling from this side of the trade.
On the other hand, the economy did track Japan and continues to do so.
 It is strange the way the two things diverged. There is the stock market – which seems to be telling us that we have an American-style revival going on. And there is the bond market – whose puny yields whisper to us in Japanese.
The stock market is supposed to look ahead. Investors are supposed to anticipate changes in corporate earnings… which tend to come with higher revenue. Stock prices – at or near all-time highs – should be signaling better times ahead.
A real recovery, though, would come to the stock market like an exterminating angel. It would mean higher interest rates and higher consumer prices – as more and more borrowers bid for limited resources. The stock market would soon retreat as fixed-rate investments gained in popularity.
The bond market, where yields are falling, not rising, tells us to beware. It suggests that the economy is not really improving; demand for loans remains weak; inflation, too, will likely be subdued.
What to make of it?
Which market is telling the truth?
Our guess is that we are still in Tokyo… with slow growth, low rates, an aging population, increasing debt and low consumer price inflation. The equity market, on the other hand, is a fake-out… an artifact of the biggest stock manipulation of all time.
Since we are spending so much time there, dear readers may be interested in knowing more of what is going on in Japan. More tomorrow…
Regards,

Bill
Further Reading: The Fed’s stock market manipulation can’t last forever. That’s why Bonner & Partners senior analyst Braden Copeland created a simple 3-step roadmap to help protect your wealth before, during and after the coming equity market implosion. Be prepared when the bubble bursts. Find the full details here.

One of the most salient features of the market environment of recent months is the evolution of investor psychology. From March through May, stocks experienced a classic internal correction in which the most overbought and overvalued stocks declined while fairly valued large caps remained buoyant.
The rationale behind this strategy was the determination of money managers not to give back the big gains from the 2013 rally. Instead of selling everything they simply moved money out of last year’s top-performing (but overvalued) small caps and moved money into stocks sporting lower P/E ratios and higher dividend yields. Consequently, the benchmark S&P 500 large cap index held up well throughout the March-May correction, as did the Dow Jones Industrial Average.
[Read Also: The Two Most Powerful Forces Pushing the Stock Market Higher]
The trading pattern which emerged in the S&P during this internal correction was a lateral trading range. Many investors have difficulty evaluating trading ranges, although it’s a fairly straight-forward procedure. The most important thing to consider isn’t the progression of prices within the range, but the tenor of investor psychology while the range is taking shape. This is one of the ways which makes it easier to predict which direction prices will break out from once the lateral trend has run its course.
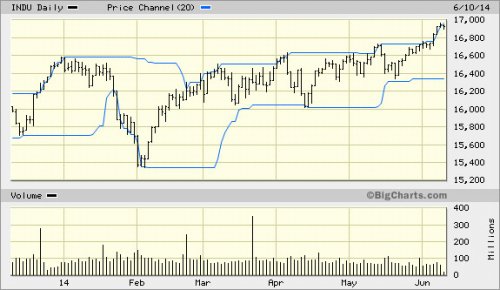
During the last few weeks investor sentiment has shown a remarkable neutrality or lack of commitment. Small investors have been reluctant to take a stand, whether bullish or bearish. Yet while the lateral trend was unfolding in the Dow and S&P, corporate insiders displayed a remarkable bullish bias. Insider purchases of shares in May hit their highest levels since October, the time of a previous interim low. So while small investors were too gun shy to buy, insiders were buying shares of their own companies with both hands.
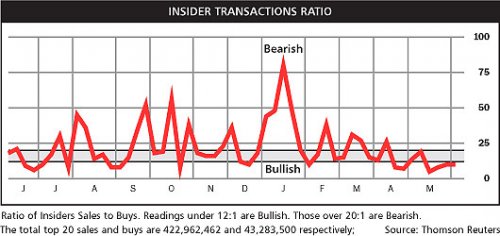
Our Composite Gauge also suggested that “smart money” traders were positioned for an upside breakout from the trading range. This indicator, which combines OEX put-call data with insider buying and other sentiment measures, was closer to the bullish end of the spectrum in the weeks preceding the breakout. True to form, the market eventually broke out above the top end of its multi-week trading range just as the smart money apparently predicted.
As discussed previously, we need to see the 10-day moving average of the Composite Gauge hit a reading of 45 or higher in order to signal the arrival of a frothy market. This would also tell us that a top could be imminent, at least short-term. The indicator is currently at about 40 and is inching closer to the critical 45 level. It’s not there yet, however, so the market could still make some additional gains before this indicator signals that smart money have started pulling in their horns.
[You May Also Like: Market Strength Continues to Build as Laggards Become Leaders]
Another expression of Wall Street money managers’ stubborn refusal to give up the ghost is reflected in the S&P open-close indicator. This indicator is simply a cumulative graph showing the opening hour of trading each day for the SPX along with the closing hour. The theory behind it is that, in a well-established bull market, the opening hour should show a tendency to move higher on most days. This is a simple measure of the market’s forward momentum. What’s amazing about the following graph is that during the entirety of the March-May internal correction, the SPX continued to show a measure of forward momentum in terms of its opening hour performance. This explains how the S&P was able to remain so buoyant during the internal correction period.
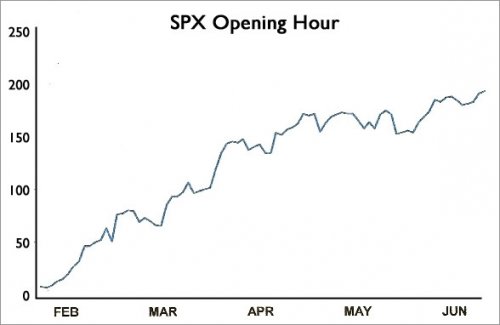
Meanwhile the closing hour component of this indicator was in negative territory throughout much of the last couple of months. In May, however, it started gaining upside traction and eventually broke back into positive territory. The assumption behind this is that “smart money” traders were gradually accumulating large cap stocks and thus the market was still on a bullish footing.
As strong as the stock market has been lately, many are wondering if the trend will remain up through year end or if there’s still a chance for a sell-off. Many investors consider the market to be overvalued and have launched what amounts to a buyer’s strike in the wake of the latest rally. These investors are nonetheless salivating at the prospect of being able to buy in at lower level if given the opportunity. Their hope is that this occurs sometimes between now and this fall when the major Kress cycles are scheduled to bottom.
Keeping in mind that the market is apt to disappoint the majority’s wishes, there’s still the chance that this summer could witness an important correction. The odds of this occurring will increase if the major indices continue rallying from here and become severely over-extended from their 200-day moving averages. This would put the market in a technically vulnerable position.
Under this scenario, a potential repeat of the August-September 1998 mini-bear market would be possible. For now, though, consider that the market’s main trend is up as the bulls still hold sway.
******
Kress Cycles
Cycle analysis is essential to successful long-term financial planning. While stock selection begins with fundamental analysis and technical analysis is crucial for short-term market timing, cycles provide the context for the market’s intermediate- and longer-term trends.
While cycles are important, having the right set of cycles is absolutely critical to an investor’s success. They can make all the difference between a winning year and a losing one. One of the best cycle methods for capturing stock market turning points is the set of weekly and yearly rhythms known as the Kress cycles. This series of weekly cycles has been used with excellent long-term results for over 20 years after having been perfected by the late Samuel J. Kress.
In my latest book “Kress Cycles” I explain the weekly cycles which are paramount to understanding the timing of stock market turning points. Never before have the weekly cycles been revealed which Mr. Kress himself used to great effect in trading the SPX and OEX. If you have ever wanted to learn the Kress cycles in their entirety, now is your chance. The book is now available at:
http://www.clifdroke.com/books/kresscycles.html
Order today to receive your autographed copy along with a free booklet on the best strategies for momentum trading. Also receive a FREE 1-month trial subscription to the Momentum Strategies Report newsletter.
Clif Droke is a recognized authority on Kress cycles and internal momentum, two valuable tools which have enabled him to call most major stock market turning points from 1997 through the present. He is the editor of the Momentum Strategies Report newsletter, published three times a week since 1997. He has also authored numerous top-selling books, including his most recent one, “Kress Cycles.” For more information visit clifdroke.com

On the heels of continued U.S. propaganda, today King World News is publishing comments from a 60-year market veteran. At nearly 90 years old, the Godfather of newsletter writers, Richard Russell, notes that while the mainstream media propaganda continues, the public is literally going broke because of soaring inflation.
Russell: “Well, it should be clear sailing ahead for the markets. How do I know? Easy, I read it in the newspapers. Today’s WSJ headline in big black letters, “Clear Skies for US Shares.”
And today’s USA Today (page b-1) gives “Five Reasons Why The Stock Market Is Growing Again”:
- The momentum stock sell-off didn’t spread to the blue chips.
- The frozen economy did thaw out, as hoped.
- The world’s bankers did their part.
- The Ukraine crisis didn’t spiral out of control.
- The bearish warnings didn’t come to fruition.
Russell asks: But wait, what about the collapsing real estate in China? And what about Fed tapering that’s supposed to end in October?
I can’t wait to look at silver and gold. The long descending trendline on silver below will be breached if silver climbs to 19.25.

….read more HERE
Long-term capital appreciation in all market cycles by tactically allocating its exposure amongst equities, fixed income, commodities and currencies during periods that have historically demonstrated seasonal trends is the objective of the Thackray Market Letter. The 2014 June letter HERE covers the following topics:
- S&P 500 technical breakout, but weak volume

- Draghi rally will it last?
- Biotech back from the dead
- Gold ready to shine
- Bonds still time to go
- 9 Stocks to Buy, Sell or Hold
…..and much more, the entire Letter HERE
also:
June Videos
(1) Market Update: https://www.youtube.com/watch?v=rUhzeXdmq_c
(2) Sector Update: https://www.youtube.com/watch?v=w1Juw4r27vs
Brooke Thackray
WHAT CAUGHT OUR ATTENTION THIS WEEK… & WHAT TO DO ABOUT IT
Stocks: It’s a Bull Market! The S+P 500 is up 13 of the last 15 days…up more than 5% in the last month…up 22% in the last year… up nearly 200% from its March 2009 lows.

Current action: No positions. The Vix is at 7 year lows…right at the bottom of its last 25 year range…margin usage is at extreme all-time highs…bullish sentiment is very strong…the market seems perfectly poised for a smack down…but it’s a Bull Market and skeptics and cranky bears would save themselves a lot of money and aggravation by waiting…we can’t bring ourselves to buy this runaway bull market…we’ve just been wrong in anticipating a top…the market looks like it wants to go higher still! Someday we will have an opportunity to make money on the short side…impatience may be costly!
Bonds: Got hammered in 2013 but had a great run in 2014…until last week. We’re anticipating stronger H2 economic growth in the USA than the market currently expects…which would hasten the Fed taper and bring forward the first interest rate increases. We’re anticipating another leg up in bonds on a stock market correction may give us a chance to short bonds.

Current action: no positions…patiently waiting for an opportunity to get short.
Currencies: We anticipate economic growth in the USA to increasingly outpace the Eurozone and that the ECB will have to “do a lot more.” We expect they “wouldn’t mind” seeing the Euro lower…we look for EURUSD and maybe EURYEN to weaken in the months ahead. We’ve held this view for over a year with little reward…however we maintain our view and make a little money chipping away with short dated short option trades. Currency vol (like vol across all asset classes) is at very low historical levels.

Current action: We’ve held short AUDCAD positions for 5 weeks and this past week saw a decent paper profit melt away. We will exit the trade on a clear break above 102.25. We see this trade as a simplified long USA / short China trade. Over the past few months we’ve had various short option trades on to benefit from a weaker Euro and a weaker CAD. The last of those options expired June 6. We will probably do more of the same in the weeks ahead. We recently bought more US Dollar Indices. We remain long term USD bulls and expect more currency wars…some subtle…some not-so-subtle…
Metals: We believe the gold market remains in a liquidation phase with rising volume and declining open interest on price breaks. Gentlemen obviously prefer stocks…the gold/S+P ratio is at a 6 year low…down over 60% from its 2011 highs. Copper has been in a choppy decline from it’s All Time highs made 3 years ago. In the last 3 months it has bounced about 25 cents from 4 year lows…we wrote last week that we expect it to resume its longer term downtrend…breaking this year’s lows of 295 and perhaps falling to 250 or less.

Current action: We’ve had net short positions in gold on-and-off for the past 2 years (and sometimes we’ve been net long!) We’ve been net short for the last 3 months and continue to hold those positions. We initiated net short copper positions in late May and continue to hold. We would exit on a rally through 322.
Energy: We anticipate that the net supply/demand picture over the next several months will push WTI prices lower. We’ve seen the 105 level act as a “roof” three times since WTI rallied from January into March. We see a historically large long spec position in crude being vulnerable to and perhaps exacerbating a price break. Any lessening of geo-political risks will also contribute to lower prices…the flip side of that is any significant increases in geo-political risks could take prices through 105 in a heartbeat.

Current action: We initiated net short WTI positions in late May and continue to hold. We would exit on a breakout above 105.


-
I know Mike is a very solid investor and respect his opinions very much. So if he says pay attention to this or that - I will.
~ Dale G.
-
I've started managing my own investments so view Michael's site as a one-stop shop from which to get information and perspectives.
~ Dave E.
-
Michael offers easy reading, honest, common sense information that anyone can use in a practical manner.
~ der_al.
-
A sane voice in a scrambled investment world.
~ Ed R.
Inside Edge Pro Contributors

Greg Weldon

Josef Schachter

Tyler Bollhorn

Ryan Irvine

Paul Beattie

Martin Straith

Patrick Ceresna

Mark Leibovit

James Thorne

Victor Adair