
Timing & trends
As the markets set up here, we are in the window for a top. While we’re waiting for weak price action to confirm a trading signal in our QQQ Trader service, this is a good time to start layering on some options and selling covered calls.
On Wednesdays, we start looking at weekly data (written @ 6/4/2014 5:50:23 AM). Here are the primary things we’re seeing in our weekly data:

Probably the most popular and quoted weekly surveys is the Investor intelligence bulls minus bear, which is about as high as it’s been in recent history.
A much less quoted data series, but equally as important:
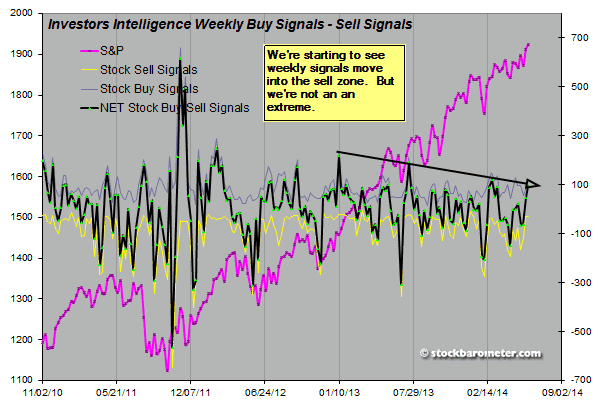
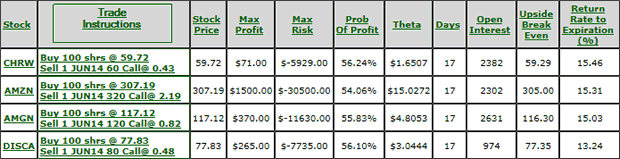
When indicators get to the top of the range, the potential of the market reduces. Also the potential for a move lower increases. Sentiment is pretty bullish here, so the market is even more vulnerable. Accordingly, we’ve recommended 20 or so PUT Option plays in our Stock Option Speculator service. The first 10 are from the Nasdaq 100. And the second 10 are the least efficiently priced options in the market overall. Here’s that list:

Our recommendations are sorted by the bearish percent to double. So the top option has to only move down less than 5% for the option to double in value. Visit www.stockbarometer.com to learn move.
We’ve also released our covered call list for the nasdaq 100, which has about 43 plays, including many popular stocks – if you’re holding them and plan on holding them, why not make some additional change as the market moves sideways or lower! Here’s the bottom of that covered call list:
These are ranked by return rate to expiration, annualized. These numbers are pretty low above, but in the top of the list, the numbers are greater than 100%. That’s where you really want to be playing…
For our QQQ Trader Service, we’ll need to see more bearish price action to move us into Sell Mode. We also plan on bringing back a long/short stock service that will align with our timing signals. So stay tuned.
Regards,
Author: Stock Barometer
Stock Barometer is completely independent. We have never and will not ever accept compensation from any company whose stock we recommend.
Our goal is to make you money. We offer you the tools and information to do so and leave it to you, the individual investor, to apply them in the best way possible.

Quotable
“It ain’t over till it’s over.”
Yogi Berra
Commentary & Analysis
Dow Jones Industrial Average Daily [last 16,711]: In a modified wave methodology, larger wave patterns are counted as three wave moves—consistent with Dow Theory (whereas Elliott Wave looks at 5 waves to make up a sequence). In the chart below, the measuring distance or projection of Wave C (blow-off rally in the Dow Jones Industrial Average) targets 16,817. I had calculated that target a while back, but honestly didn’t believe we’d see the Dow move this high. That’s what you get from not believing in your charts.
At 16,817, wave A and C are equivalent—this is the highest probability target using a three-wave approach; but obviously it is no Holy Grail. “Nobody rings a bell at the top.” “Top picking is a mug’s game.” But, this technical analysis suggests we are getting very close to a major top.
Also notice on the chart (below) the interesting divergence pattern between price and momentum we saw last time we got a decent correction back in 2011.
Larger image Click HERE

Click HERE & scroll down a bit for a larger chart, further & a June 2nd article on USD/EUR
If you would like to sample our forex service, I will set you up for a two week trial and you can see more of what we do and determine if Black Swan Forex could be a resource to help you make real money in the currency market.
Please click here to request a free trial. We simply need your name and email address.
Thank you.
P.S. The US dollar reserve status and case for a continued bull market power point presentation has been posted to our homepage at the top: www.blackswantrading.com
Regards,
Jack Crooks
President, Black Swan Capital
Twitter: @bswancap
In this month’s Markets at a Glance, we present a collection of thoughts on why we think precious metals are a compelling investment now.
On physical demand and the shortage of precious metals:
- The Gold Forward Offered Rate (GOFO) remains very low, with extended periods of time in negative territory (Chart 1).1
- Why is Germany’s repatriation of their 674 tonnes of gold taking so long? As of March 2014, only 69 tonnes had made their way back, a pace of less than 5 tonnes a month.2
- If there is no shortage of gold, why are the U.S. and U.K. exporting so much gold to Switzerland? (which itself exports most of it to China).3
- According to some estimates, China consumed over 4,800 tonnes of gold in 2013, implying that about 3,600 tonnes were drawn from global stocks (i.e. western vaults) to satisfy demand.4
- All this Chinese buying is reflected in the monstrous amounts of gold deliveries on the Shanghai Gold Exchange.
- Dubai is building a new gold refinery capable of handling 1,400 tonnes, and current global gold refining capacity is about 6,000 tonnes (world mine production is less than 3,000 tonnes a year).5Why would they need so much refining capacity if physical demand was not buoyant?
- As the major gold miners cut back on exploration, future mine supply will remain constrained.6
- Another “temporary source of supply” (900 tonnes) has been ETFs, which have been raided for most of 2013. However, as Chart 2 shows, they have now stabilized. Other things being equal in demand, where will that 900 tonnes of supply come from in 2014?
- Interestingly, the Silver Institute, in its 2014 World Silver Survey, noted that there was a 96 million ounces shortfall in 2013 due to strong physical demand.
On the macroeconomic environment:
- The real level of inflation is high and much higher than official figures (Chart 3). Precious metals have historically hedged against inflation.
- Speaking of inflation, the large amount of money printing and the bloating of U.S. Central Bank’s balance sheet will most likely end badly.
- According to Jürgen Stark, former European Central Bank board member, central banks have lost all ability to control the economic situation. In other words, we live in a fictional sense of security.7
- Vladimir Putin thinks that “China and Russia need to ensure their gold and other currency reserves are secure”.8 At the same time, the Russian Central Bank continues to be a large buyer of gold and a seller of U.S. Treasuries.9,10
On manipulation:
- The CME Group might introduce daily limits on gold and silver price moves to limit the extreme volatility we have seen in recent years (i.e. to prevent, going forward, any large spikes up in price).11
- Investigations into the gold fixing mechanism by the German financial regulator BaFin and the subsequent withdrawal of Deutsche Bank from the gold fixing suggest something is wrong.
- More recently, Barclays got fined 26 million pounds because one of its traders manipulated the gold fix to avoid paying on a gold derivative.12
- Some market participants are suing the banks responsible for the gold fix over alleged manipulation.13
- The company that ran the Silver fix “suddenly” decided to stop running the process.14
- As argued in the January 2014 Markets at a Glance, we find it strange that in 2013, gold ETFs were raided, whereas silver, which experienced the same price declines, stayed in the ETF’s vaults (Chart 2).15 This suggests that the ETF’s gold was needed to satisfy physical demand.
To conclude, we believe that any rational investor considering this collection of facts would consider, like us, that gold prices are long overdue for a re-rate. As we all well know, almost all markets are manipulated; and the recent Barclays settlement is one example vindicating our views (more to come?).
» The global macro environment is weak,
» Supply/demand numbers in our favour,
» Ponzi finance is in full bloom.
We encourage readers to protect themselves with any/all precious metals.
CHART 1: 1-MONTH GOLD FORWARD OFFERED RATE (GOFO)

Source: Bloomberg
CHART 2: KNOWN HOLDINGS OF PRECIOUS METAL ETFS (INDEX DEC 2011 = 100)

Source: Bloomberg, Sprott Calculations
CHART 3: CONSUMER INFLATION – OFFICIAL VS SHADOWSTATS (1980-BASED) ALTERNATE (YEAR TO YEAR CHANGE. THROUGH APRIL 2014 (BLS, SGS)

Source: shadowstats.com, published May 15, 2014
This excellent 50 chart & commentary report makes this powerful case – Money Talks Editor

Except the S&P 500 Index and the Dow Jones Transportation Average, equity markets around the world have ended their annual period of seasonal strength. Equity markets recently have entered into a period of higher than average volatility and lower returns from the first week in May to the last week in October. Strength if occurring is an opportunity to take profits, particularly in economic sensitive sectors.
…..for this superb report go HERE

“In God We Trust” Vanishes From Coins
While gold prices just reached a 16-week low, a treasure trove of rare gold U.S. coins just hit the market for auction.
“RadioShack” Conspiracy Kills Another Company
GameStop shares are up after earnings. And a little-known market phenomenon suggests that the momentum will continue…
Black Ops Militia Cuts Bangkok’s Head Off
A “Secret” War That Costs $500 Per Second

Pure, Unbridled C.H.A.O.S. Ripped From Silicon Valley
Positive legislation could see defense companies win more gov’t contracts. But should this stock win your investment dollars?
Coming to An O.R. Near You: Minimally Invasive Heart Surgery
Using innovative new technology from Californian firm, BioVentrix, doctors are performing minimally invasive heart surgery.

Dangerous Warning Sign Lurking Below the Surface
Due to a relative lack of asset price volatility, the options markets are now showing a historic level of complacency.
Perusing the Preferred Stock ETFs
Many high-yielding preferred stocks are performing well as interest rates fall. Here’s a look at several preferred ETFs.

Did China Just Swindle the Kremlin?
Russia’s massive new natural gas deal with China craftily dodges the West – and bodes very well for this company…
Indonesia’s Move Can Send Aluminum Skyrocketing
Indonesia’s export ban on raw ores already boosted nickel prices. The same ban may boost aluminum prices, too. Here’s why.

Veterans Crisis Goes From Bad to Worse
As the VA scandal continues to unfold and more politicians look to place blame, let’s not forget to care for the veterans.
White House Blunder Puts Family’s Life At Risk
If the last five years of U.S. foreign policy feels like slapstick comedy, that’s because Obama’s team has made it a farce.
About Robert Williams
Founder and Publisher
In addition to once being a full-time trader of equities and equity derivatives, Robert has also served as the lead financial analyst for a Forbes top-50 private corporation and an analyst for the endowment of a major academic institution.
Robert has been profiled in such books as Trade with Passion and Purpose and Alexander Green’s The Secret of Shelter Island. He’s also featured in Karim Rahemtulla’s bestselling book, Where in the World Should I Invest?
Robert is regarded as an authority in corporate finance, specifically in gauging the investment health of companies.

-
I know Mike is a very solid investor and respect his opinions very much. So if he says pay attention to this or that - I will.
~ Dale G.
-
I've started managing my own investments so view Michael's site as a one-stop shop from which to get information and perspectives.
~ Dave E.
-
Michael offers easy reading, honest, common sense information that anyone can use in a practical manner.
~ der_al.
-
A sane voice in a scrambled investment world.
~ Ed R.
Inside Edge Pro Contributors

Greg Weldon

Josef Schachter

Tyler Bollhorn

Ryan Irvine

Paul Beattie

Martin Straith

Patrick Ceresna

Mark Leibovit

James Thorne

Victor Adair