
Timing & trends
First I want to acknowledge how frustrating the markets have been over the last several months for most of you. There has been no clear cut trend in which one can just take a position and not get caught up in the chopping action the markets have been giving us. As I have said in the past the hardest part of trading is to get your initial position to stick before your sell/stop gets hit. If your a bear it’s two steps down and one step up and if your a bull it’s two steps forward and one step back. It’s that one step after you take your initial position that usually gets you if you don’t buy the exact high or low.
As of right now there is nothing broken in any of our portfolios as the consolidation patterns keep in building out. This is the frustration that most of you are feeling right now as there is no direction, one day up and the next day down. This is the how markets work. They will frustrate you until you can’t stand it anymore then you will sell out to save your sanity. Believe me there is nothing wrong with saving ones sanity as that is the most important feature for playing in the markets. The markets are hard enough to play when your sane but impossible if your emotions get in the way. I wish I had a magic wand I could wave to make it all better but I don’t and I don’t know anyone that does. So the game goes on until one side wins the battle and then we get a move we can actually hold onto for awhile.
Lets start with a daily chart for the Dow Jones that has been consolidation or topping since the first of the year. It has completed 5 reversal points so far making it a reversal pattern at this time. The only problem is the price action bouncing off the bottom rail that could be a 6th reversal point if the price reaches the top rail. At that point it would be a consolidation pattern if it was to break through the top rail of the rising wedge. As of this moment the rising wedge is a reversal pattern because it has completed 5 reversal points so that is what we have to go on until something changes.
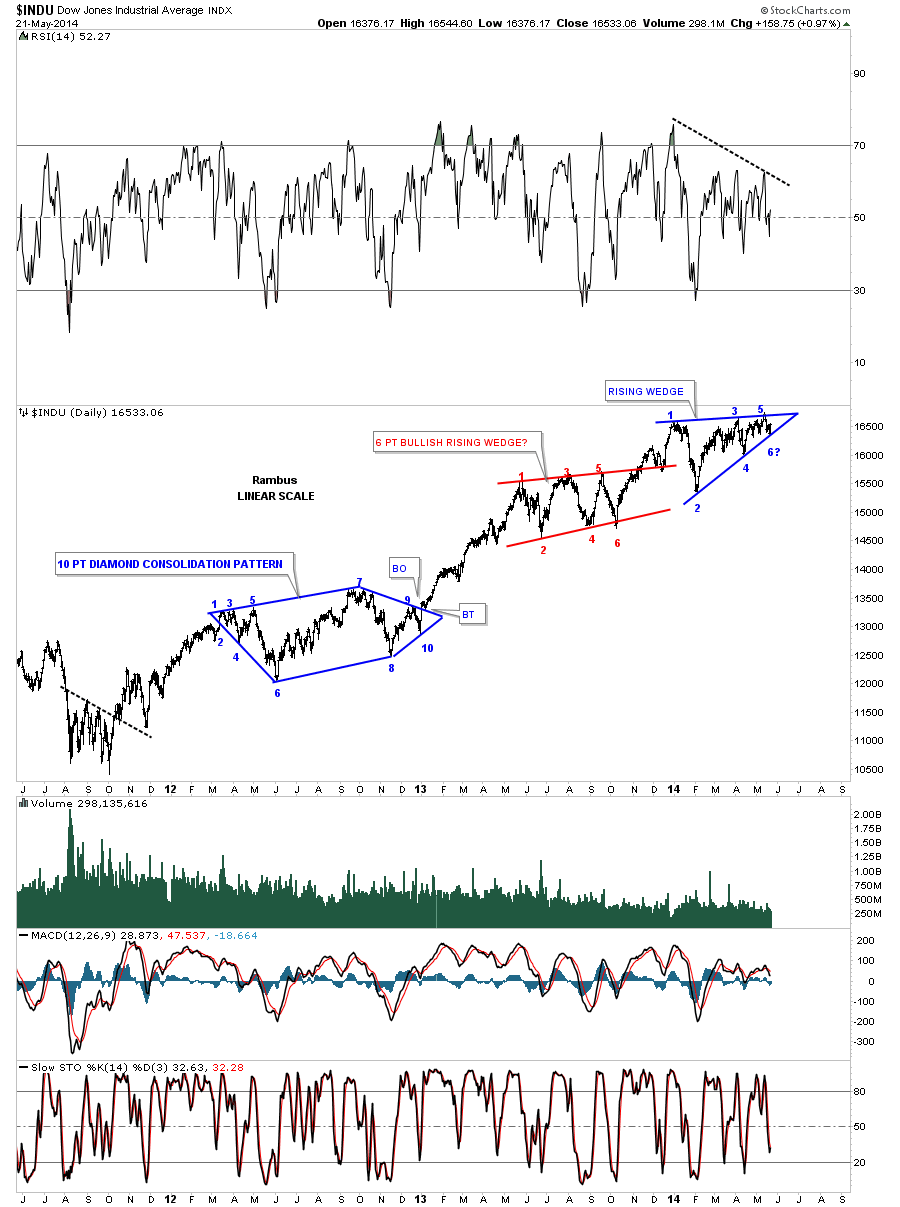
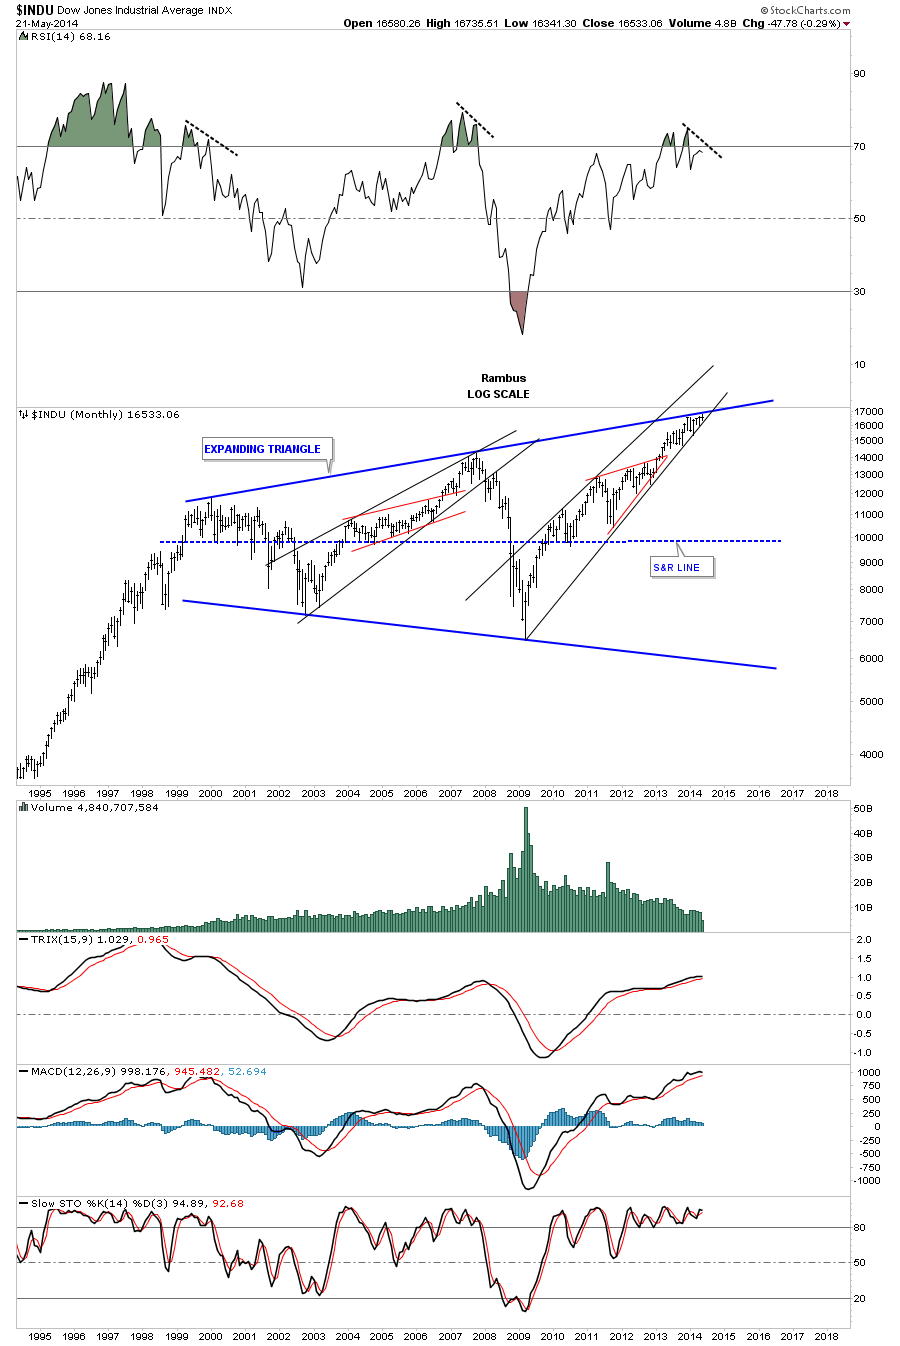
This very long term monthly chart for the Dow shows it’s trading at the top blue rail of a huge expanding triangle that starts back in 2000. As you can see the price action is squeezing right into the apex of the top blue rail of the expanding triangle and the bottom rail of the rising wedge. This is either a great shorting opportunity or if the price action can break above the top rail of the massive blue expanding triangle, a great buy. The jury is still out on this one yet.
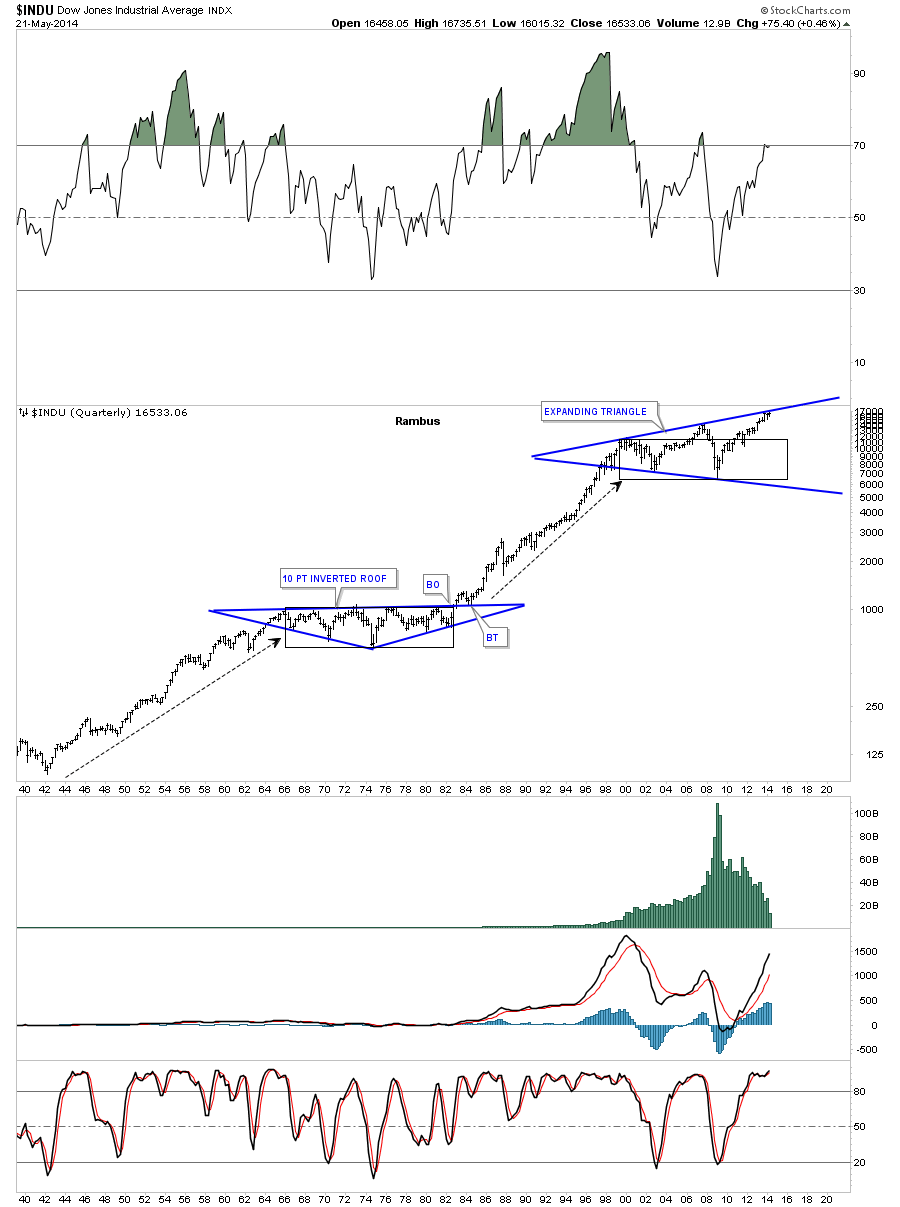
Below is a very long term chart for the Dow that goes all the way back to the 40′s. You can see the inverted roof pattern that formed during the big bear market of the 70′s. This chart does a good job of showing how an impulse move, on any time scale, plays out. Note the secular bull market that started in the early 40′s and ran all the way up to 1966 where the secular bear market began. You can see how long it took to work off the bull market run, black rectangle, before the Dow was ready for the next major impulse move higher that would take it to the 2000 top where our current consolation pattern is forming. The million dollar question we have to ask ourselves is the blue expanding triangle finishing up with the 14 year consolidation pattern or is there still more work that needs to be done to work off the excesses from the previous secular bull market? Again you can see how critically important the price action is that is trading at the top blue rail of the 14 year consolidation pattern.
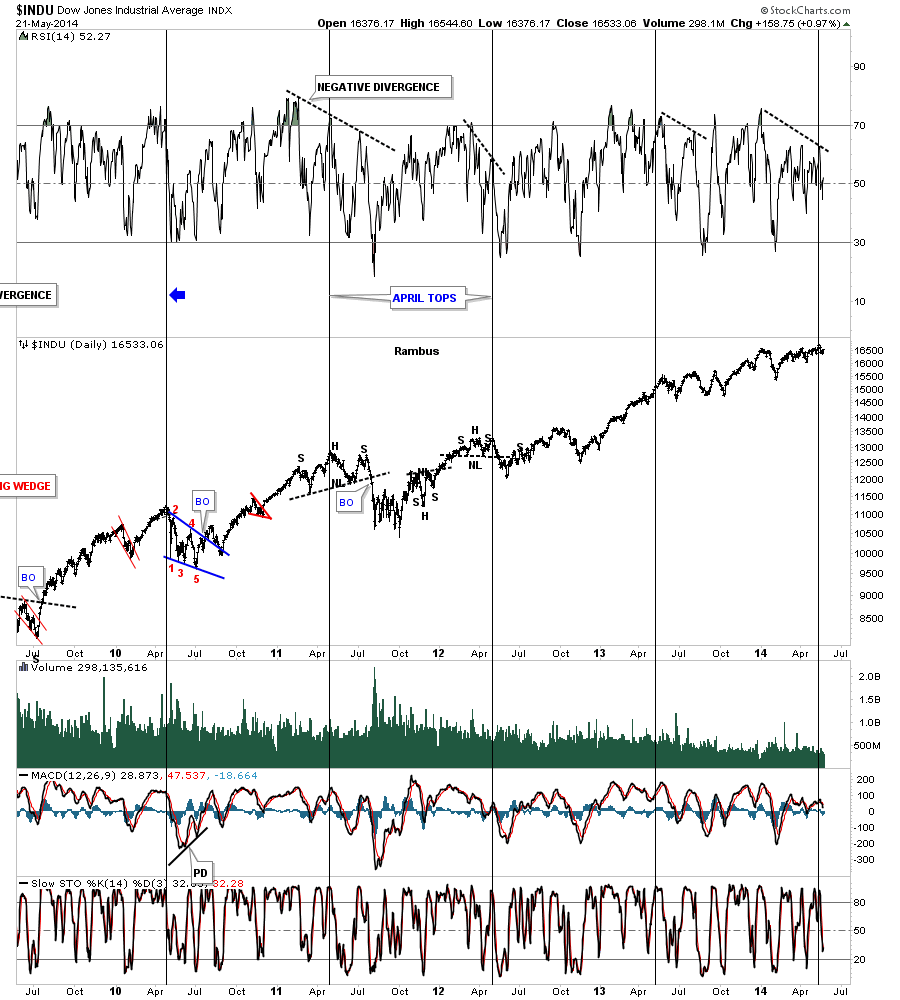
Below is a 5 year chart of the Dow that shows an important intermediate term top was made in April of each year. Will this year be any different?
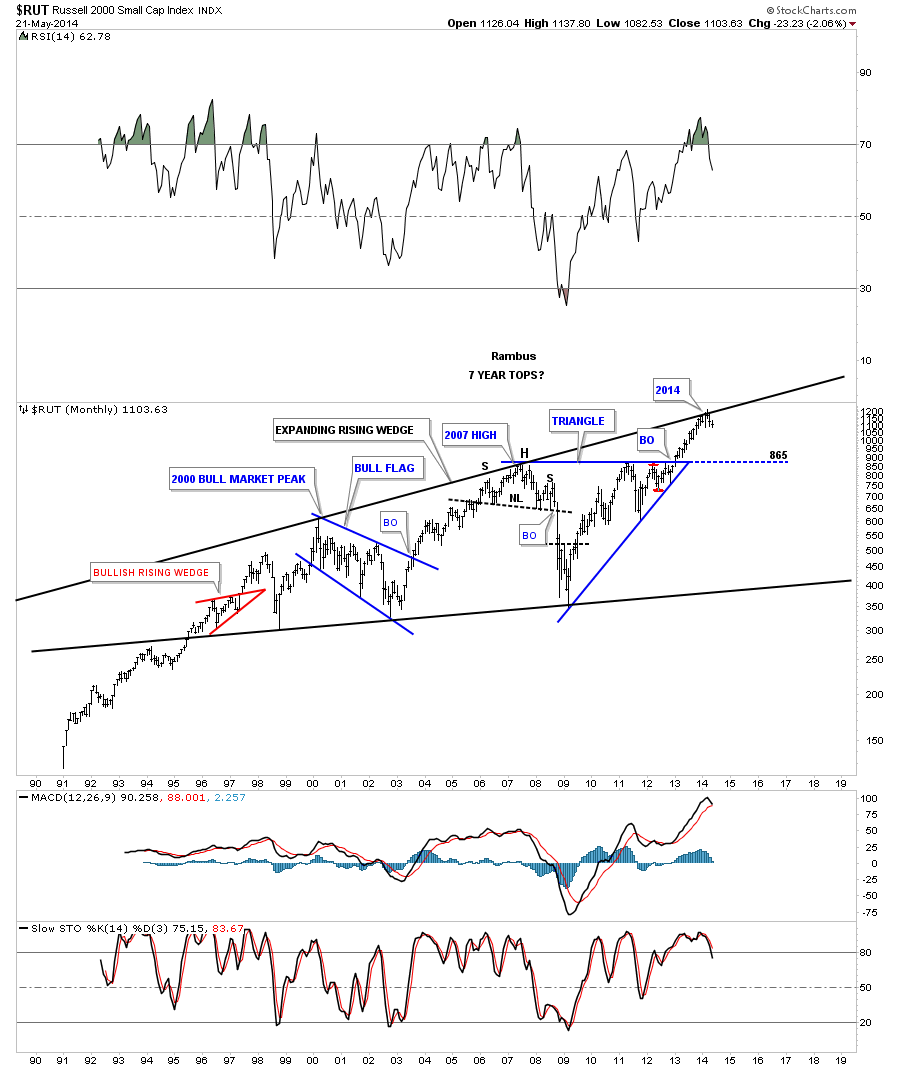
Lets now take a look at the Russel 2000 that is trading up to the top blue rail of its expanding rising wedge formation. As you can see there was a top in 2000, then seven years later another top in 2007 and now we are at the top rail seven years later in 2014. I don’t want to sound like a broken record but this area does look like a good place to try a short trade. As we know there are no guarantees. If we do see a correction I would expect the first line of support to come in around the previous tops at 865 or so.
Of all of the stock market indexes the SPX has the most bullish look to it as it has already broken out of its expanding flat top triangle. The only thing lacking to make this chart super bullish is there is no backtest yet. A backtest down to the 1550 area, the old highs, would be a great buying opportunity if the SPX does a backtest.
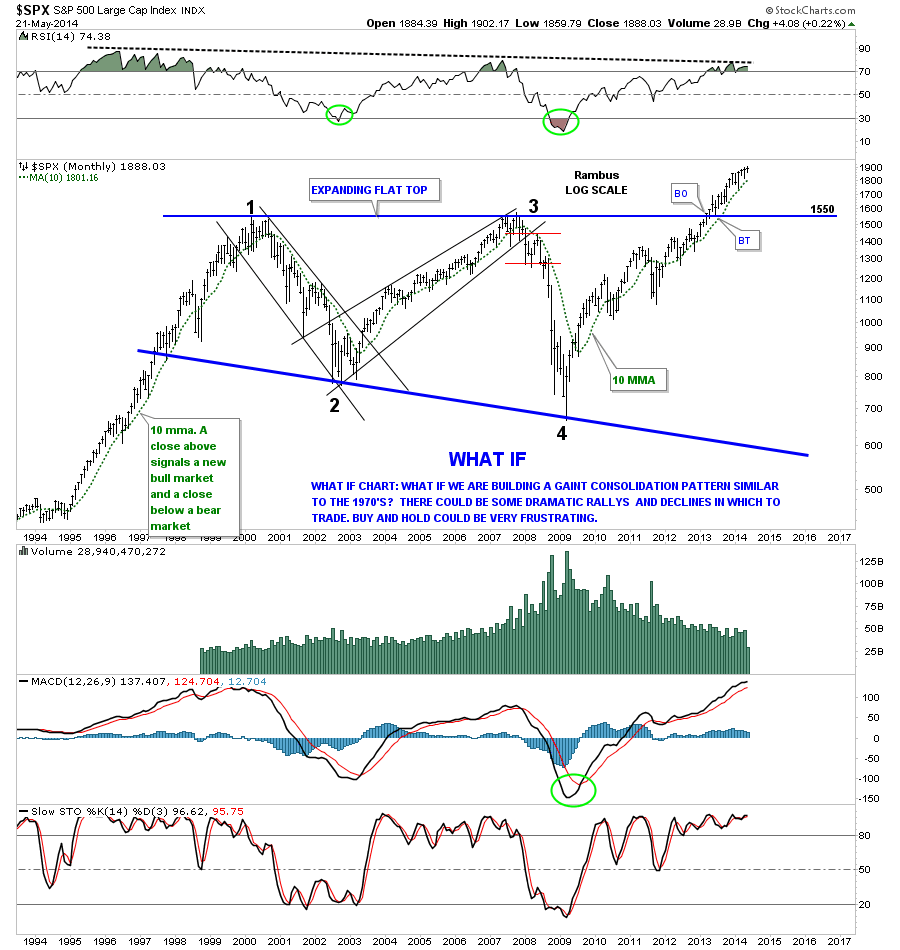
The monthly chart for the SPX shows its been trading in a rising wedge formation since the bear market low in 2009. There is also a bit of a negative divergence taking place similar to the 2000 and 2007 tops.
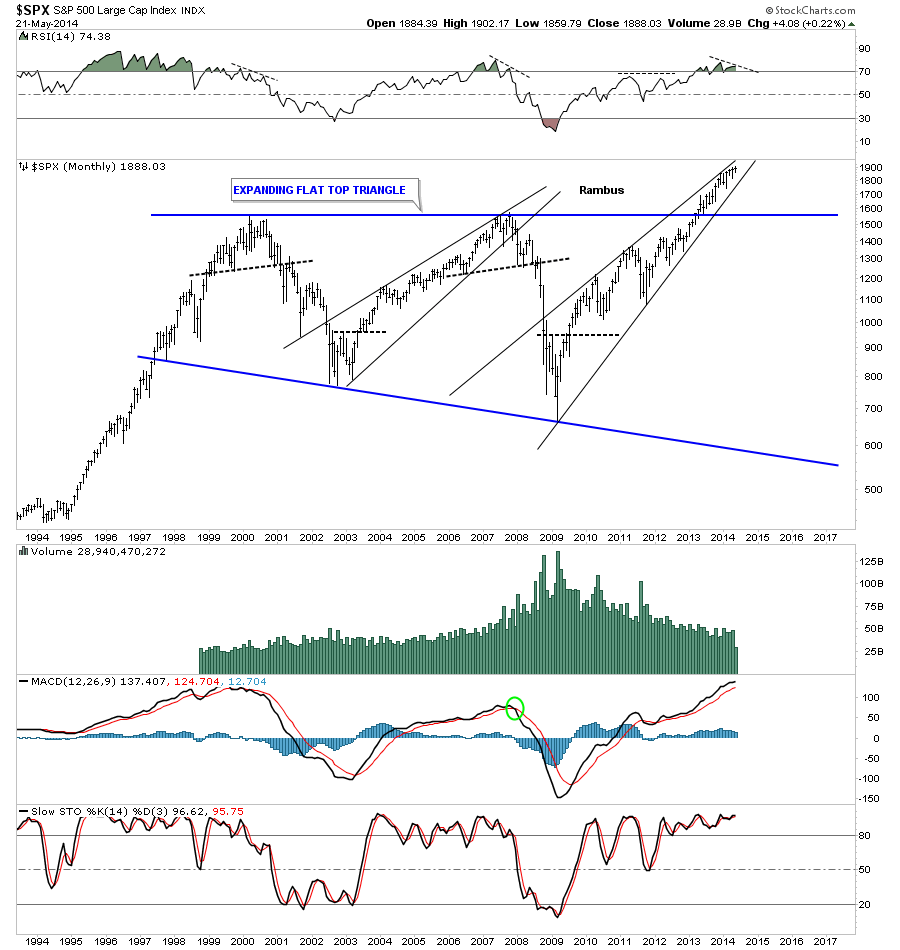
The quarterly chart for the SPX shows it has broken out of its expanding flat top triangle but no backtest so far. As you can see in the 70′s bear market the SPX did have a clean breakout and backtest before it started its secular bull market.

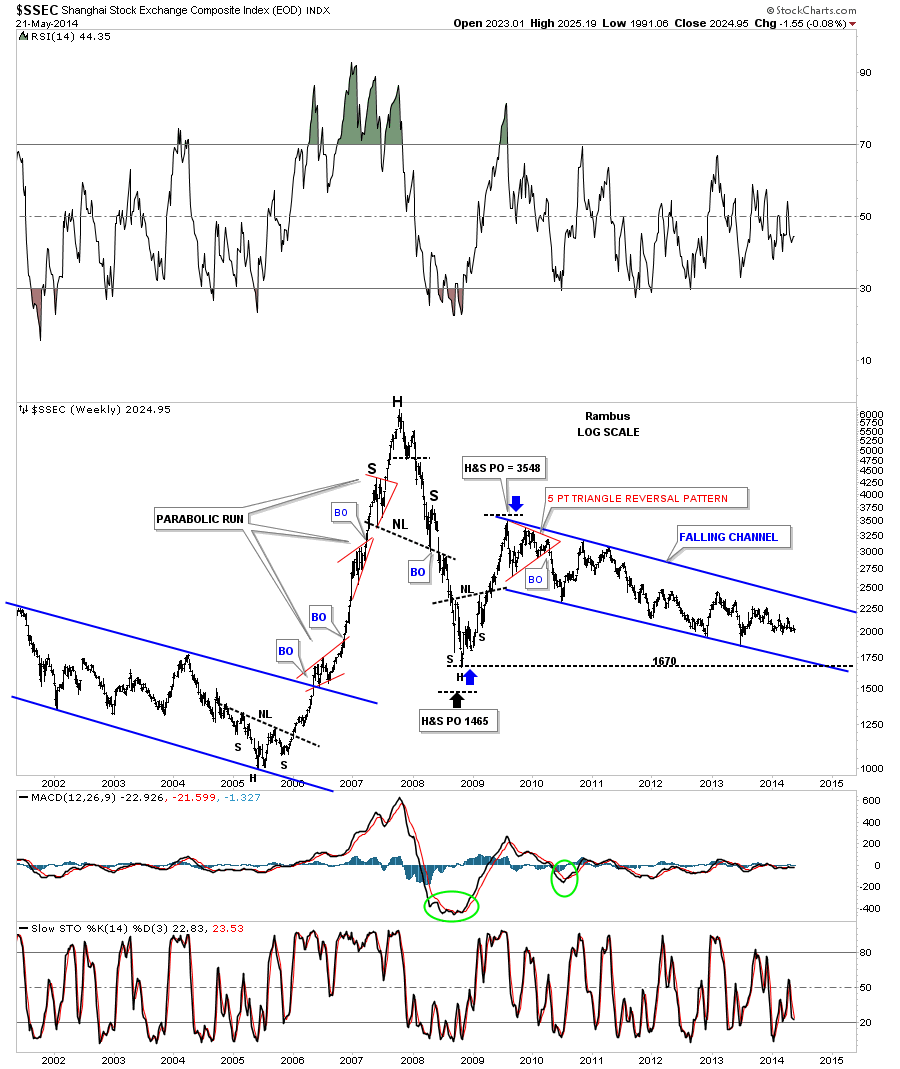
A lot of folks believe China is the cure all for just about everything out there. If China gets moving to the upside commodities will be soaring once again. China is supposed to be buying up all the available gold out there that should be bullish for the price of gold. As you can see on this chart below China has been in the doldrums since it put in its parabolic run in 2007. This is exactly how a stock looks after a parabolic blow off phase. After the initial decline from the parabolic top the SSEC had a counter trend rally back up to 3548 where it has been drifting lower for more than 5 years. There is nothing bullish about this chart.
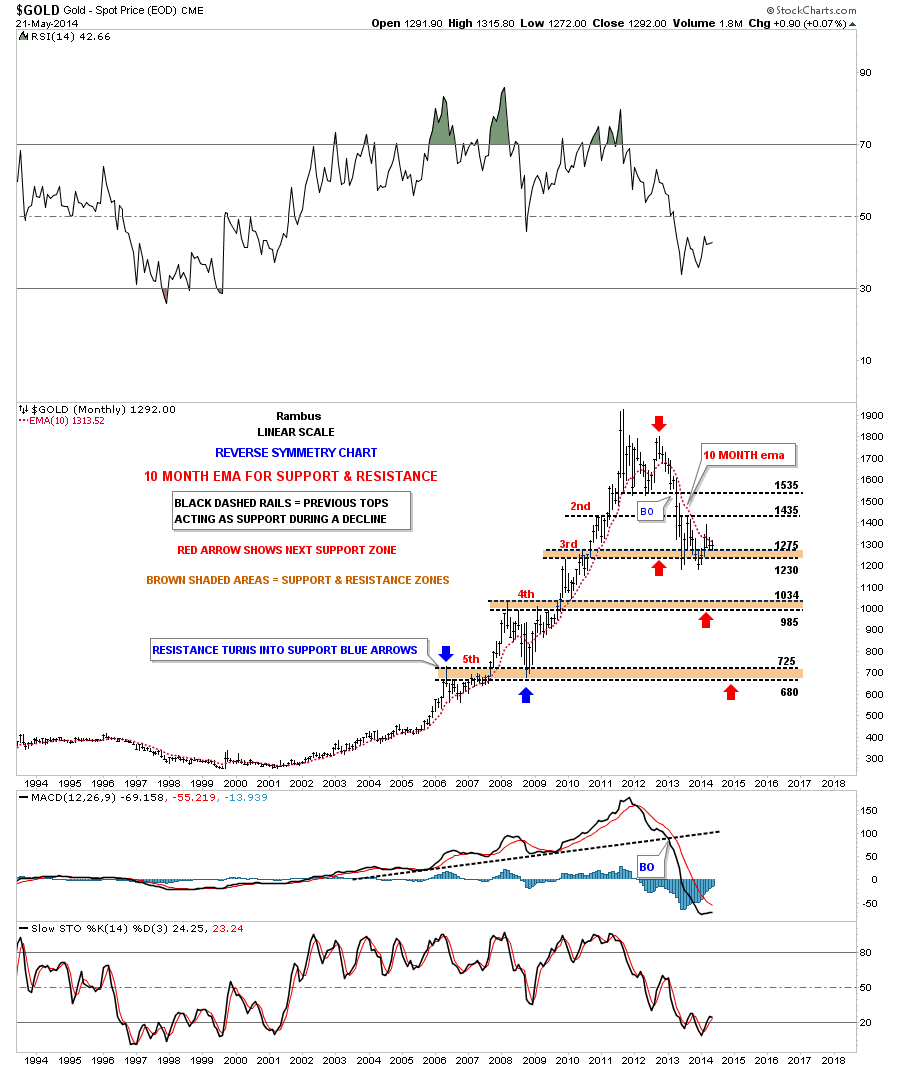
Does gold share the same fate as the SSEC after its parabolic run?
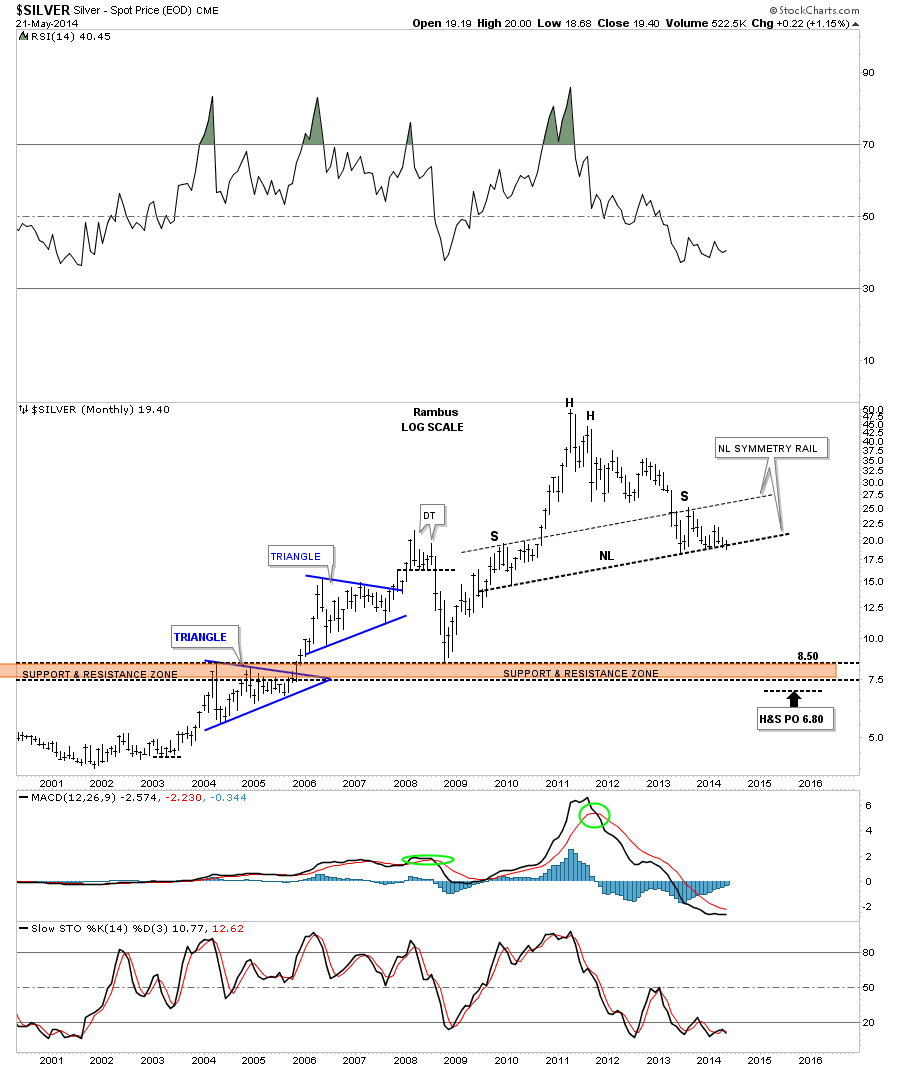
The last chart for tonight is the long term look at silver that we’ve been following for sometime now. Part of the frustration you are feeling with silver is the major support rail its been testing that has a good chance to be a neckline of a major H&S top. Big important trendlines like that don’t give up easily. As you can see this month of May has cracked the neckline but not decisively yet. There is still a week and a half of trading yet before this monthly chart shows the closing price. This is either the best buying opportunity or the greatest short of a lifetime right here and now. You know how I’m positioned. All the best…Rambus

 Eric Holder proves he is no US banker puppet by smashing another foreign bank: BNP Falls as U.S. Probe Said to Cost More Than $5 Billion (BBG)
- Fuld Was Top CEO When Fed Last Raised as New Neutral Era Beckons (BBG)
- Tymoshenko loses her magic in Ukraine presidential race (Reuters)
- GOP Sees Primaries Taming the Tea Party (WSJ)
- Heard that one before: Russian troops preparing to leave Ukraine border area (Reuters)
- Vietnam riots land another blow on the global supply chain (FT)
- Heard that one before too: Bank of England minutes show some members closer to voting for rate rise (Reuters)
- BOJ Refrains From Easing With Signs Japan Weathering Tax Rise (BBG)
- Miner Freeport Pressured by Water Costs as Copper Prices Slide (WSJ)
- Talks to end Thai crisis inconclusive, new round called (Reuters)
- Japan Court Blocks Reactor Restarts (WSJ)
Global synchronized growth, as measured by the Global Purchasing Managers’ Index (PMI), remained stable or positive for the past 12 months until Japan reversed the momentum in April with a precipitous drop in its PMI. China is contributing modest growth but, fortunately, the U.S. and Europe are rebounding. This lack of consistent global momentum has created a short-term, volatile, hot and cold, stop and go sentiment. Global real GDP growth peaked in 2010 at 5.2 percent, then slowed for the next three years, to 3 percent. Global growth in 2014 is likely to accelerate, for the first time in four years, to 3.5 percent, according to ISI. This is constructive news for commodities.
Brian Hicks and I co-manage the Global Resources Fund (PSPFX) using a model that focuses on companies demonstrating robust fundamentals in sectors showing strength. I’ve asked Brian to share his thoughts on the opportunities we see in today’s market.
Q: We’ve seen strength in the major oil companies, service and equipment companies, oil and gas exploration and production (E&P) companies, chemical companies and refiners. What’s behind the strength?
A: The major oil companies have benefited from higher Brent pricing and cheap relative valuation to energy and the broader market. E&P stocks are especially solid because the price of oil is strong. The shale revolution has been a transformative factor for a lot of companies in this space, creating very strong growth in production. Chemical companies and refiners are downstream beneficiaries of the shale play as relatively inexpensive oil and natural gas prices lower their main input cost in the manufacturing of chemicals and refined petroleum products. Because of this competitive advantage in the U.S., we’re seeing chemical companies moving back to the states and creating jobs. Global demand is also increasing for oil and chemicals.

Q: Other commodities such as copper, aluminum and iron ore have been struggling. The Brent oil price hasn’t moved as much as the WTI price. Explain what is happening in these areas.
A: Brent oil isn’t necessarily struggling, but it has been stuck in a sideways trading pattern. Copper prices have fallen hard and subsequently rebounded recently. The metal has experienced a lot of volatility as well. This is mainly due to soft economic growth in China and high inventory levels in global exchanges. Aluminum and iron ore are both oversupplied and the glut has weighed on prices. Until we see cutbacks in production and prices that support profit, they will likely remain weak. Australian iron ore producers have cranked up production to the point where 2014 will likely remain a year of oversupply.
Q: Talk about some of the recent “success story” stocks in the fund.
A: Raging River Exploration is a Canadian junior oil and gas producer. The company has a deep inventory of drilling prospects, strong netbacks (the gross profit per barrel of oil produced), and has seen rising profit growth. We bought this name on a price pull back.

Sherritt International Corp is another Canadian based resource company. It has interests in nickel, coal and cobalt mining. Nickel prices were under tremendous pressure last year due to oversupply but have surged this year since Indonesia banned exports of unprocessed ore in an effort to encourage domestic industrial development. Indonesia is the world’s leading supplier of high-grade nickel ore, which is used to make stainless steel. Sherritt has benefited from this drastic change in the nickel market.

Goodrich Petroleum Corp is an exploration and production company that looks for natural gas and crude oil. The company has had positive drill results recently in a developing new play, the Tuscaloosa Marine Shale in Louisiana and Mississippi. We first bought the stock around $14. Today it is trading around $24.

Q: Recently the overall market sentiment has shifted to prefer large cap companies over small cap stocks. Why do you still believe in small caps for the long term?
A: Small caps are where the growth is going to come from, and this is true of resource companies as well. These types of stocks may be out of favor for the time being, but in the stock market everything is cyclical. Eventually, the market will recognize (again) that smaller companies have higher growth potential and the sentiment will shift back.
Going back to 1926, small cap stocks have historically performed better from November through April. Check out the difference between a buy and hold strategy and one where small cap were held during the May to October period.

Vancouver is a lovely summer destination and the perfect place to learn more about resource investing. I’ll be speaking there at the Natural Resource Symposium July 22-25. I hope to see you there.
Please consider carefully a fund’s investment objectives, risks, charges and expenses. For this and other important information, obtain a fund prospectus by visiting www.usfunds.com or by calling 1-800-US-FUNDS (1-800-873-8637). Read it carefully before investing. Distributed by U.S. Global Brokerage, Inc.
Foreign and emerging market investing involves special risks such as currency fluctuation and less public disclosure, as well as economic and political risk. Because the Global Resources Fund concentrates its investments in specific industries, the fund may be subject to greater risks and fluctuations than a portfolio representing a broader range of industries.
Fund portfolios are actively managed, and holdings may change daily. Holdings are reported as of the most recent quarter-end. Holdings in the Global Resources Fund as a percentage of net assets as of 03/31/14: Goodrich Petroleum Corp 1.13%, Raging River Exploration Inc. 1.21%, Sherritt International Corp 1.24%.
All opinions expressed and data provided are subject to change without notice. Some of these opinions may not be appropriate to every investor. By clicking the links above, you may be directed to third-party websites. U.S. Global Investors does not endorse all information supplied by these websites and is not responsible for their content.
The J.P. Morgan Global Purchasing Manager’s Index is an indicator of the economic health of the global manufacturing sector. The PMI index is based on five major indicators: new orders, inventory levels, production, supplier deliveries and the employment environment.

 The low-profile Canadian who serves as one of Warren Buffett’s chief lieutenants is making a big bet on the economic potential of his home province amid speculation that he might one day succeed the famed investor at the helm of Berkshire Hathaway Inc.
Edmonton-born Greg Abel, 51, presides over Berkshire Hathaway Energy, the power and utility arm of the Oracle of Omaha’s sprawling conglomerate. He has earned plaudits for guiding the Iowa-based energy unit on an acquisition binge, including a $3.2-billion deal earlier this month for AltaLink, Alberta’s largest electrical transmission company.
More acquisitions may be in the works he hinted….
The press is demanding the attention of investors more than ever. Whether it was the recent jobs report or last week’s testimony from Janet Yellen, sorting through the market noise is no easy task. Since the world is so interconnected from Facebook to WhatsApp, a spark of news can ignite unfounded fear in an instant. What’s truly significant when it comes to your investments?

Twice a day, in the morning and at lunch, our investment team sits down together to discuss what’s important and what’s immaterial. Last week, in my opinion, the good outweighed the bad. Much of the economic news was a direct result of government policies, both fiscal and monetary. Here are my findings, which I hope will help you filter through the noise.

What are the challenges?
1) As you probably know by now, the Global Purchasing Managers’ Index (PMI) is one of the key metrics we pay attention to as a gauge of the global economy’s strength. In April the Global PMI fell from 52.1 to 52.0, and though the drop was small, investors who previously were encouraged by a synchronized growth cycle, lost some confidence. Japan’s services and manufacturing PMI readings dropped precipitously. The services PMI plunged to 46.4 in April and the manufacturing PMI fell to 49.4. Both numbers were above the 50 mark in the previous month.

The reason for Japan’s slump lies in the consumption tax rate hike, from 5 percent to 8 percent, imposed on the country on April 1. The tax increase was aimed at decreasing the country’s huge public debt, nearly 245 percent of GDP. Just when Japan was finding its economic foothold for recovery, the restrictive fiscal policy caused economic activity to stumble.
Why it matters: The reason for the fall in Global PMI is directly related to Japan’s fall in PMI. Japan has become a drag on global growth. It’s important to recognize the root cause – increased taxes just as monetary stimulus measures were seeing results. This is not good for economic growth and should serve as a cautionary tale for other countries.
2) Another challenging area of the market is China. China’s manufacturing PMI came in lower at 48.1 in April, contracting for the fourth month in a row, and the country also saw a decline of 0.3 percent in its consumer price index (CPI). Employment in the Asian nation is also at a seven-month low, adding growth concerns for the country.
Why it matters: This negative data means there is potential for fiscal policy easing, allowing the Chinese government to boost the economy in the coming months.
Focus on the strong points.
1) The rate of change of global industrial production (IP) was slowing until the close of 2013. Now, however, the global growth outlook is improving. You can see that an inflection point was hit in mid-2013, reaccelerating IP and coinciding with the global GDP outlook for 2014.
Europe is also doing well. The eurozone composite PMI, a good indication of growth, rose to 54.0 in April. In addition, Spain and the U.K. saw increases in GDP in the first quarter and Spanish banks are seeing a decline in bad debts.
Why it matters: When global IP moves up, this is a sign that momentum in the global economy has changed – for the better. This is good for commodities such as oil, gas and copper, but also for cyclical areas like energy and industrials. There is no doubt that people in every country want upward mobility for their families, and as the demand for better education, cars, etc. continues, commodities and cyclicals should benefit.
2) In a recent report, ISI also highlights that minimum wages are going up in the U.S., citing examples of multi-year wage increases for those who had not received pay increases for the last several years. Various groups who received no increase before will now see a 4 percent rise per year, a leading indicator of wage growth trends. Consumer net worth is also expected to rise by $7.1 trillion in the second quarter, taking it to $82.5 trillion.
Why it matters: Real incomes are expected to rise as wage increases outpace inflation. With the uptick in consumer net worth and steady job growth, consumers will feel more comfortable spending.
3) Bank loans have seen an increase of 10.4 percent annualized rate over the last 14 weeks. As you can see in the chart below, the number of loans continues to increase. According to the Wall Street Journal, one area where bank lending has accelerated is to commercial businesses.

Why it matters: This positive trend is a potential inflection point for the economy because it indicates economic acceleration. Not only are banks making it easier to borrow by relaxing lending standards, companies are confident enough about the economy to want more money to grow and invest. The WSJ goes on to say that earnings in April from the six largest banks in the U.S. pointed to an increase in commercial loans of 8.3 percent in the first quarter from last year.
Economic data around the globe continues to remain supportive. Even among challenges, there are opportunities to be found. For example, on Thursday we heard that the European Central Bank is likely to ease interest rates in June. This could be another catalyst for Europe, which is already showing improving economic activity.
Similarly, China’s inflation is at an 18-month low as of Thursday, which could increase the odds of a policy response, a positive stimulus for the economy. Japan is dealing with the same thing; the country committed to Abenomics and will likely respond with additional policy support to get back on the recovery track. Don’t let negative news overshadow good news and keep in mind that bad news tells you where the opportunities are.

Fund portfolios are actively managed, and holdings may change daily. Holdings are reported as of the most recent quarter-end. The following securities mentioned in the article were held by one or more of U.S. Global Investors Funds as of 03/31/2014: Facebook.
All opinions expressed and data provided are subject to change without notice. Some of these opinions may not be appropriate to every investor. By clicking the links above, you may be directed to third-party websites. U.S. Global Investors does not endorse all information supplied by these websites and is not responsible for their content.
The Consumer Price Index (CPI) is one of the most widely recognized price measures for tracking the price of a market basket of goods and services purchased by individuals. The weights of components are based on consumer spending patterns. The Purchasing Manager’s Index is an indicator of the economic health of the manufacturing sector. The PMI index is based on five major indicators: new orders, inventory levels, production, supplier deliveries and the employment environment. The J.P. Morgan Global Purchasing Manager’s Index is an indicator of the economic health of the global manufacturing sector. The PMI index is based on five major indicators: new orders, inventory levels, production, supplier deliveries and the employment environment.

-
I know Mike is a very solid investor and respect his opinions very much. So if he says pay attention to this or that - I will.
~ Dale G.
-
I've started managing my own investments so view Michael's site as a one-stop shop from which to get information and perspectives.
~ Dave E.
-
Michael offers easy reading, honest, common sense information that anyone can use in a practical manner.
~ der_al.
-
A sane voice in a scrambled investment world.
~ Ed R.
Inside Edge Pro Contributors

Greg Weldon

Josef Schachter

Tyler Bollhorn

Ryan Irvine

Paul Beattie

Martin Straith

Patrick Ceresna

Mark Leibovit

James Thorne

Victor Adair