
Timing & trends
 Is Wall Street right to ignore Ukraine?
The sometimes-violent fracturing of Ukraine has commanded international headlines, evoked scary comparisons with Cold War-era diplomatic chess games and spurred the White House to send Vice President Biden to Kiev, in a bid to calm the crisis.
So why are global financial markets mostly shrugging over the geopolitical drama?
Sure, the Russian stock market (RSX) and the world value of the ruble (RUB=X) have been hammered as Western economic sanctions take hold. Potential disruptions of Ukrainian grain shipments have lent force to the rally in some agricultural commodities. And Continental Europe is bracing for potentially crippling constraints in Russia’s crucial natural-gas exports.
Yet, on the whole, stock markets have registered little alarm over possible economic and geopolitical ripple effects from Russia’s de facto annexation of the Crimean region and apparently building risk of all-out civil war in Ukraine.

 Jim Puplava: The international monetary system has collapsed three times in the past 100 years: in 1914, in 1939, and in 1971. Each collapse was followed by a period of turmoil: wars, civil unrest, or significant damage to the stability of the global economy. The next financial collapse will resemble nothing we’ve seen in history. Deciding on the best course to follow will require comprehending a mine field of risk while poised at the crossroads pondering the death of the dollar. Joining me on the program is my special guest, Jim Rickards. He’s the author of a new book called, “The Death of Money: The Coming Collapse of the International Monetary System,” and, Jim, in your book you talk about the demise of the dollar and, by extension, the potential collapse of the international monetary system because if confidence in the dollar is lost—and this is a very key point—no other currency stands ready to take its place as the world reserve currency because the dollar is the lynchpin. If it fails, with it is a failure of the entire system. Let’s talk about that.
Ed Note: For the entire 33 minute interview on Youtube go HERE
Jim Rickards: Thank you Jim. As you mentioned in the introduction, the title of the book is “The Death of Money: The Coming Collapse of the International Monetary System,” and when I say that it sounds provocative but it’s really not meant to be, as you correctly explained: the system has collapsed three times in the past 100 years. The last time was in 1971, a little over 40 years ago, so these things do happen every 30 or 40 years. Now it doesn’t mean it’s going to happen tomorrow like clockwork, but I would expect this sooner than later for some reasons that I explain in the book. But the important thing is when the system collapses it doesn’t mean the end of the world. It doesn’t mean we all live in caves and eat canned goods. What it means is that the major financial and trading powers sit down around a table and rewrite what they call the rules of the game. And the rules of the game is not my expression, that phrase has been around for a hundred years and is the way experts describe the workings of the international monetary system. So what I do in the book is first of all to explain things that are visible today, the dynamics that are leading to the collapse but then go further and say, okay, when the collapse comes, what will the new rules of the game be, what will the new system look like and what can investors do today to prepare for that so they can preserve wealth through not only the collapse but into the new system as well. So, it’s got some history, it’s got some economics, it’s got some international security aspects to it. It’s got some forward forecasts so I hope the readers enjoy it.
What ever happened to inflation?
“Well, two things happened: a lot of our potential inflation got exported abroad to other countries…it did show up in China, it showed up in Brazil, it showed up in the Arab Spring—that was one of the contributors to the rise we saw in 2011 and so forth. But it’s just a matter of time before other central banks throw in the towel, which is what Bernanke told them to do, and then that inflation comes back to the United States. So, that’s one thing you can see coming.”
“The other reason is that the increase in nominal GDP has two parts…and this is the failure of Bernanke’s helicopter money theory. He’s said, well, I never worry about causing inflation. I know I can do it because I can just push money out of helicopters: print it and push it out of a helicopter. But what if people just left it lying on the ground? In other words, picking up the money involves going into debt. People don’t want to go into debt. They want to sell assets, get cash, and pay off debt: deleverage their balance sheet. They don’t want to go into debt. So, even the printing of money doesn’t work if people don’t want to spend it and that’s what’s been going on. So, the combination of exporting some of the inflation abroad and the declining velocity or turnover of money have meant that they can print all that they want and you still don’t get the inflation. But here’s where it breaks down: Janet Yellen is determined to get inflation. Central banks have to get inflation—they cannot tolerate deflation. So they print and they print and they’re still not getting the inflation. Guess what they’re going to do? They’re going to keep printing! And they’re going to say eventually we’re going to wear you down, we’re going to get that inflation. And my thesis is that you might get that inflation but you might cause a collapse in confidence in the meantime on the way to printing so much money to get the inflation. You might actually destroy confidence, and that’s when you have this kind of catastrophic collapse. So, we’re only halfway through this movie, we’ve got to see the rest of it yet. But it’s going to end badly.”
Is this the reason China is buying so much gold? Are they hoping to establish a new gold-backed currency to replace the dollar?
“Everyone thinks the U.S. is in trouble because we owe the Chinese so much money—we’re not. We can just print it and hand it to them. We can say, hey, here’s your trillion dollars, good luck buying a loaf of bread; and that’s what the U.S. has always done. So, the Chinese have a problem. So, they said, OK, we can’t dump these Treasury bills—we can’t. The market’s big, but it’s not that big; and it would be extremely costly to do so. So what we’ll do instead is acquire gold by thousands of tons… There are only about 35 thousand tonnes of official gold in the world—I’m not counting private gold—I’m just talking about official gold. So, when a country goes out to buy 3 or 4 thousand tonnes, which the Chinese have done, that’s 10% of all the official gold in the world. It’s an enormous amount of gold… And China is sitting there saying, fine, we the Chinese want a strong dollar. Believe it or not, they are the dollar’s best friend because they have so many dollar-denominated securities—really trillions of dollars’ worth. We want a strong dollar, but if you, the U.S., cheapen the dollar through inflation and money printing, we’re going to lose on our paper but we are going to make it up on our gold… So what they’ve done is built a hedge position. If the dollar is stable, they might not make much on the gold, but their dollars will be valuable. But if we inflate the dollar and diminish the value of their savings, they’ll lose on the paper but they’ll make it up on the gold. So, a lot of people speculate that China is trying to buy the gold to come out with a gold-backed currency. That’s not going to happen anytime soon. China is not even close to having a reserve currency. What they are doing is building a hedged position to preserve their wealth. And what I say to investors is hey if it’s good enough for the Chinese, it’s good enough for the rest of us. In other words, we should have some gold—not all in—but kind of 10% gold to hedge all of your other assets.”
In the rest of this part 1 of 2 interview, Jim Rickards and Financial Sense Newshour host Jim Puplava discuss the nature of financial warfare, the threat posed by Russia and China to take down the U.S. financial system, and a number of other fascinating topics.

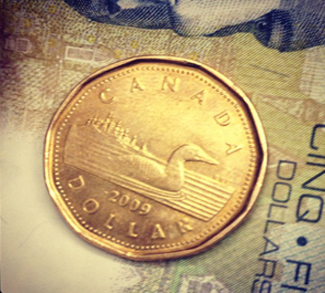 The Canadian dollar, commonly known as the loonie, derives its nickname from the North American loon, an aquatic bird known for diving to great depths. Similarly, the currency has taken a plunge since the start of 2013, falling 10 percent against its American counterpart from parity to C$ 1.1.
The period marks a sharp reversal for the Canadian dollar, which enjoyed a strong rally in the aftermath of the global financial crisis. Last month the loonie declined to its weakest in nearly five years, reflecting an increasingly fragile economy.
Canada proved an attractive safe haven for investors in the post-crisis years, with the currency being viewed as a reliable alternative to the uncertainty surrounding the US dollar and euro. A stable environment underscored by relatively robust banks and a global commodity boom allowed the central bank maintain higher interest rates than the US for much of the past five years, meaning that holders of Canadian assets could obtain a greater yield.
However, in recent years the commodity rally has stalled and despite a pickup over the last few months, prices remain far from the lofty levels of 2010. While a focus on commodities once gave Canada an advantage over other nations, it could now prove a detriment. Too much reliance on exporting its natural resources has resulted in reduced investment in the manufacturing sector.
Over the past decade the number of Canadian manufacturing firms has fallen by 20% and the sector’s share of GDP has shrunk from 16% to 12%. It is a worry trend, possibly indicating that the commodity boom has masked vulnerabilities in the core economy; something that could be painfully highlighted if food and energy prices tumble.
Improving US growth should boost demand for Canadian goods (it takes in about 70% of Canada’s exports) but the central bank recently warned that Canada’s non-commodity exports were becoming uncompetitive, even at C$1.1. The country’s growth outlook isn’t particularly encouraging either, with real GDP expected to increase 2.4% this year after rising 2% in 2013, marking a third straight year of slowing growth.
Canadian policymakers face a difficult challenge in supporting the economy while trying to manage an overheating housing sector. House values have ballooned, with the average price of a home more than doubling since 2002. Moreover, household debt has climbed to record levels of about 100% of GDP, on par with the US at the peak of its housing bubble. Similarly, at 7% of GDP, residential investment has become an unhealthily large part of the economy, outdoing the pre-crash US and rising much faster than population growth. The sector is undoubtedly on an unsustainable trajectory.
While interest rates were kept at 1% last year, the central bank had a tightening bias, intimating that it would raise rates in the near future to cool excessive spending. But new governor Stephen Poloz adopted a neutral stance in October, recognizing weakness in the broader economy. His dilemma is that low rates could add fuel to the housing boom, encouraging indebted households to increase borrowing, while higher rates could strangle business activity.
Inflation pressures are minimal at present, with the consumer price index rising 1.1% in February from a year earlier, well below the central bank’s 3% upper target. This has built up expectations that rates will be maintained at 1% until at least mid-2015. The prospect of no rate hikes should keep the Canadian dollar at relatively weak levels, helping boost the competitiveness of exporters.
This will help with a necessary longer-term goal of shifting the economy’s growth drivers, which have been imbalanced over the past decade. A transition is needed from reliance on debt-driven household consumption and residential construction to an export-led economy boosted by strong manufacturing investment.
Such a goal involves discouraging housing speculation through tighter mortgage conditions and limits on residential investment, hopefully resulting in a gradual stabilization of house prices. Policies targeted at revamping the much-neglected manufacturing sector will also help provide sustainable growth, effectively sheltering the economy from fluctuating commodity prices.
The deleveraging from an excessively indebted economy will take time and be somewhat painful, but that is the consequence of years of largess. Action now can prevent a severe hemorrhage later. For inspiration, policymakers just need to remember what happened to the housing market south of the border.
Ronan Keenan is a contributor to Geopoliticalmonitor.com
- In many countries, inflation is beginning to creep higher. Please click here for larger image .That’s the Australia CPI
 (Consumer Price Index), courtesy of Trading Economics. The next report will be released today. Note the recent jump in prices. It comes as the Western economic recovery enters a more mature stage.
 - Inflationary pressures normally tend to appear after a period of strong growth. When central banks raise interest rates to combat that inflation, a strong economy will weaken, but it’s not disastrous.
- In the current situation, most Western governments have truly horrific balance sheets. Their economies are recovering from the 2008 meltdown, but very slowly. In the United States, this recovery has been one of the weakest on record. It’s unknown how the Fed would respond, if prices began to rise strongly while GDP growth faded away. The central bank could quickly become“stuck between a rock and a hard place”.
- Please click here now . That’s the daily gold chart. I realize that in the Western gold community, a tremendous amount of bearishness has manifested itself recently. I think it’s largely unjustified.
- As gold rallied towards $1392 in March, most investors were focused on the Ukraine situation. They believed gold was ready to surge above $1400.
- In contrast, I warned that large banks tend to take their cue from the action of Indian gold dealers. The banks will often enter short positions on the COMEX, when the Indian dealers reduce their physical gold bids. At the time, those dealers did indeed begin pulling their bids, and they talked about a likely drop to the $1300 area.
- That’s exactly what happened. From there, Indians prepared to vote, and I suggested that while they headed to the polls, gold would trade in a range between $1280 and $1330. That’s also precisely what has occurred.
- Charts don’t create fundamentals. Fundamentals create charts. Bank traders take their cue from demand, or lack of it, in the physical gold market. Investors who are currently afraid of lower prices may be overly focused on the picture they see on various gold charts.
- As mentioned, fundamentals create charts, and when those fundamentals change, the picture on the charts changes quickly. On that note, a modest decline in price that occurs while the world’s largest gold buyer class heads to the polls is perfectly normal.
- At this point, gold could continue to trade in that $1280 -$1330 range. It could also enter a new trading zone, either below or above the current one. I certainly don’t see a possible new range of $1230 – $1280 as something that any investor should fear. To understand why that is, please click here now . That’s the latest COT report for gold. It’s clear that the most powerful banks in the world aren’t afraid of this election-related softness in the price.
- They are aggressive buyers of outright long positions, and rightly so.
- Please click here now . That’s the most recent COT report for silver, and the banks are even more aggressive buyers here.
- In both the gold and silver markets, I’d like to take a moment now, to invite the entire Western gold community to join the world’s most powerful bullion banks on the buy side.
- The precious metals world changed in 2013. A gold bull market ended,and a gold bull era began.
- To understand the true power of the Indian gold buyer class that helps define that era, please click here now . That’s the ten year government bond yield in India. The yield is incredibly high, at almost 9%.
- Most Western gold analysts think that if a central bank raises interest rates, it creates heavy selling in the gold market. In the gold bull era, which is really the Chinese and Indian gold jewellery era, that mantra will no longer apply.
- When it comes to making their decision about buying gold, Indian gold buyers don’t really care if interest rates are high or low. For all practical intents and purposes, their demand for gold is virtually inelastic. It rises somewhat during key festivals like Diwali, and it wanes a bit during events like the current election.
- Western bank traders take advantage of these modest fluctuations in demand, helping gold experience trending moves of $50 – $200.
- The bottom line is that the Indian economy is phenomenally strong, and poised to get vastly stronger after the election, regardless of who is declared the winner, and regardless of any change in US interest rates. Despite a whopping 9% government bond yield, Indian GDP is growing at a 5.5% rate.
- I’d like to pose an open question. What would happen to American GDP, if American interest rates went to 9%? Would American GDP rise to 5.5%? I think everyone in the gold community knows the answer to that question. The already anemic GDP growth rate would turn negative in a heartbeat, and the entire financial system would again be at risk of shutting down.
- Please click here now . That’s the existing home sales chart for the United States of America. It’s not a pretty picture, and the next report is scheduled for release today. Americans tend to buy gold when the economy gets into trouble, and the economic road signs are beginning to point towards the end of the road.
- In a few short weeks, the Indian election will be completed, and the world’s most powerful gold buyer class will return to the physical gold market, with bids of size. They are ready to buy increasing amounts of gold from Western gold mines, for decades to come.
- I would argue that the world’s most powerful bullion banks are buying gold and silver aggressively now, in anticipation of the imminent return of the Indian “titans of ton” to the physical gold market.
- Please click here now . That’s the GDX daily chart. Western gold stock investors should be well accustomed to the more violent nature of sell-offs in their stocks, when there is modest softness in the gold bullion price. That’s part of the gold stocks game, and players have to accept it with a shrug. I’m watching a key downtrend line that I’ve highlighted there, to accompany a sizeable return of the Indian buyer to the physical gold market. The buyers are not gone. Their bids are simply diminished during this election. That’s why gold isn’t declining much, even though some chart patterns are seen by amateur technicians as bearish. The bears are making a mistake, taking on both the Indian buyers and the bullion banks, using just charts. Gold is the ultimate asset, but perhaps some people have to learn that, the hard way!

Apr 22, 2014
Stewart Thomson
Graceland Updates
website: www.gracelandupdates.com
email for questions: stewart@gracelandupdates.com
email to request the free reports: freereports@gracelandupdates.com
| Tuesday Apr 22, 2014 Special Offer for Money Talks readers: Send an email to freereports@gracelandupdates.comand I’ll send you my free “Gold Shorts Barbeque!“ report. The widespread negativity that has permeated the Western gold community over the past few weeks opens the door to a “barn burner” of a short covering rally. I’ll show which gold and silver investment vehicles I’m playing, to take advantage of this scenario! |
Graceland Updates Subscription Service: Note we are privacy oriented. We accept cheques. And credit cards thru PayPal only on our website. For your protection we don’t see your credit card information. Only PayPal does.
The Stockscores Approach Simplified
Over the past 15 years, I have been developing and writing about my approach to the market. When I look back through the archive of Stockscores weekly newsletters, the daily newsletter atTradescores.com, my course books, articles I have written for different media outlets and my most recent book, The Mindless Investor, it is clear that there are a lot of words out there. I can imagine that a person who is new to my approach could get overwhelmed with understanding it all or even knowing where to start.
Clearly, it is time to condense my approach down to a manageable group of articles and videos with the ultimate aim of understanding the different strategies that I use for trading stocks. That is a task that I am immersed in now with the ultimate goal of having a new education area on Stockscores.com. However, that is a job that is going to take some time.
For this week’s newsletter, I want to give a simplified overview of the Stockscores Approach to trading and how everything fits together.
To begin, an overly simplified explanation of what it is I do as a trader. I look for abnormal trading activity out of predictive chart patterns.
That one sentence pretty much describes all of my trading strategies. I realized a long time ago that most market beating trends start with abnormal trading activity but not all abnormal trading activity leads to market beating trends. The best opportunities come when the abnormal trading activity comes from one of the predictive chart patterns that I look for.
Abnormal trading activity is something that can be identified by a computer; it is something that can be described mathematically. Predictive chart patterns are more subjective, you have to learn to see them and it takes practice to get good at it.
You can apply the concept to different time frames. A longer term trader will look for abnormal activity from predictive patterns on a 3 year weekly chart. That is what I tend to do for the stocks I feature in this newsletter each week. The medium term trader will look for these strategy set ups on a daily chart, doing the research process each day either after the first hour of trading or in the evenings.
How to apply my method on the weekly and daily time frames is what I teach in the Stockscores Investor course.
For a person who has the time and desire to trade the market more actively, there is the Active Trader course which teaches my active trading strategies. Same concept, look for abnormal trading activity from a predictive chart pattern but do it on a chart that has a shorter time frame. I tend to use 30, 13 and 2 minute charts. Shorter time frame means it takes more of your time but you also have an opportunity to turn your capital over more often and improve return.
As I write this, I have found three stocks that fit the criteria of my Simple Swing strategy which uses 13 minute charts. In the first few hours of the trading day, those three stocks are up a reward for risk of 4, which means $500 risked on each trade currently have a profit of $2000. Yes, trading is simple enough that you can do it while writing a newsletter article.
Concepts like reward for risk are what make up the material that needs to be understood if you are going to apply my strategies. My book, The Mindless Investor, is a good starting point for learning these concepts. Each week, I write this newsletter to focus on basic concepts of trading and there is an archive of newsletters going back to 2003 that you can use to expand your knowledge of the basics.
The greatest value that I provide comes in my strategies. Not just the rules for when to buy, sell and manage risk but also the processes and tools used to find them. My strategies are taught in my courses which also include the support I give to my students while they learn my approach.
Learning my approach is a process. Read these weekly articles and read/www.stockscores.com/mindless.asp“>The Mindless Investor to get started. Then complete the Investor or Active Trader course to learn the strategy rules and processes. Use the Stockscores Market Scan (Investor) and the Stockscores indicators for Tradestation (Active Trader) to find trades. Practice trading without risking capital using the trading simulator at Tradescores.com. Once successful on the simulator, start to trade with real money.
Trading should be kept simple. For me, it is about abnormal activity and predictive chart patterns. Everything else is part of the effort to overcome emotion and stay focused on the strategy. Trading is simple, but not easy.
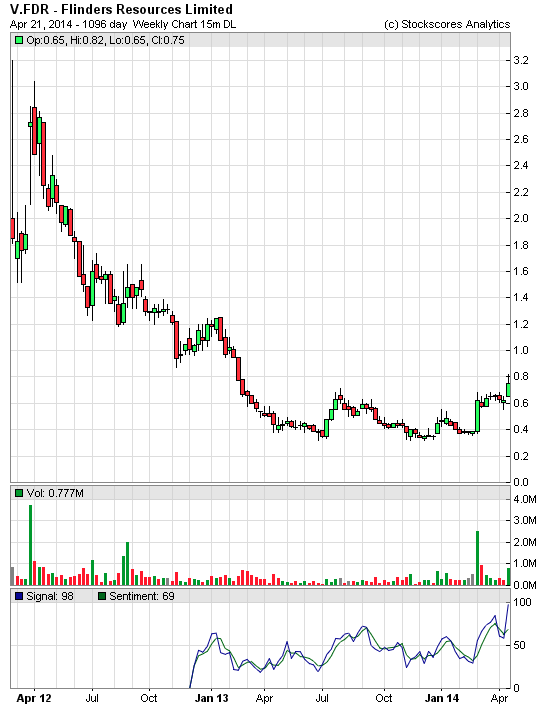
This week, I ran a scan for stocks making abnormal price gains with abnormal volume and then inspected the weekly charts for a good pattern. It seems traders are a bit slow to get back to trading after the long weekend as there are not too many stocks making strong moves. One does stand out, see below.
V.FDR has been trading sideways for about a year and making a nice price pattern. Today, it is breaking through resistance with strong volume and looks like it has decent potential to go to $1.20. The company is a Graphite miner, an area that is heating up because Graphite is used in batteries for green technologies. My main concern with this stock is that it is not yet very liquid. Also consider V.GPH. Support at $0.55.
- Get the Stockscore on any of over 20,000 North American stocks.
- Background on the theories used by Stockscores.
- Strategies that can help you find new opportunities.
- Scan the market using extensive filter criteria.
- Build a portfolio of stocks and view a slide show of their charts.
- See which sectors are leading the market, and their components.
Disclaimer
This is not an investment advisory, and should not be used to make investment decisions. Information in Stockscores Perspectives is often opinionated and should be considered for information purposes only. No stock exchange anywhere has approved or disapproved of the information contained herein. There is no express or implied solicitation to buy or sell securities. The writers and editors of Perspectives may have positions in the stocks discussed above and may trade in the stocks mentioned. Don’t consider buying or selling any stock without conducting your own due diligence.

-
I know Mike is a very solid investor and respect his opinions very much. So if he says pay attention to this or that - I will.
~ Dale G.
-
I've started managing my own investments so view Michael's site as a one-stop shop from which to get information and perspectives.
~ Dave E.
-
Michael offers easy reading, honest, common sense information that anyone can use in a practical manner.
~ der_al.
-
A sane voice in a scrambled investment world.
~ Ed R.
Inside Edge Pro Contributors

Greg Weldon

Josef Schachter

Tyler Bollhorn

Ryan Irvine

Paul Beattie

Martin Straith

Patrick Ceresna

Mark Leibovit

James Thorne

Victor Adair