
Timing & trends
Strength in mid-week last week is expected to prove to be the last chance to take profits in a variety of seasonal trades that were approaching their average exit dates. Intermediate downside risk remains. Any short term strength will provide an opportunity to reduce positions.
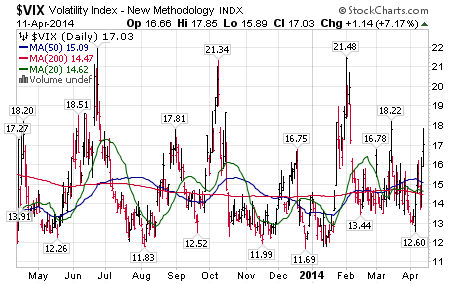
The VIX Index spiked 3.07 (21.99%) last week. The Index moved above its 20, 50 and 200 day moving averages.
Technical action by individual equities in the S&P 500 was bearish last week. On Friday, 48 S&P 500 stocks broke intermediate support levels. Look for more stocks breaking support than stocks breaking resistance this week.
Technical action by individual equities in the TSX Composite Index was neutral. Energy stocks dominated the list of stocks breaking resistance. Seasonal influences in the sector remain positive until early May.
Major breakdowns by broadly based U.S. equity indices last week imply that an intermediate correction has started. Short and intermediate technical indicators for U.S. indices and sectors generally are trending down from overbought levels.
Economic news this week is expected to confirm a rebound in the U.S. economy from depressed December/early March weather-depressed levels.
First quarter reports start to pour in this week. Main focus is on the Financial Services sector. Technology also is in focus. The market is anticipating a “difficult” comparison for earnings and revenues on a year-over-year basis. Consensus for S&P 500 companies on average is no change from last year. However, most first quarter reports are released at annual meetings where stock splits, dividend increases and share buy backs frequently are announced.
Historically during U.S. Midterm Presidential Election years, U.S. equity indices have reached an intermediate high near the middle of April followed by a correction that lasts until early October. Technical action last week suggests that the correction this year already has started. We are not alone with this call. Following is a link to a MarketWatch.com call published on Friday with a headline reading, “A bigger 10%-15% correction is coming this autumn: Bank of America/Merrill Lynch”.
http://blogs.marketwatch.com/thetell/2014/04/11/a-bigger-10-15-correction-is-coming-this-autumn-bank-of-america-merrill-lynch/
International focus this week is on China’s first quarter GDP to be released on Wednesday. Consensus is for a slowdown to 7.3% from 7.7% in the fourth quarter. Other international focuses include developments in Ukraine, Venezuela and Iran.
Trading activity is expected to diminish during the week as the Good Friday holiday approaches.
Weakness in the U.S. Dollar continues to impact equity markets, particularly the Materials and Energy sectors.
Equity markets outside of the U.S. continue to show positive returns on a real and relative basis.
Equity Trends
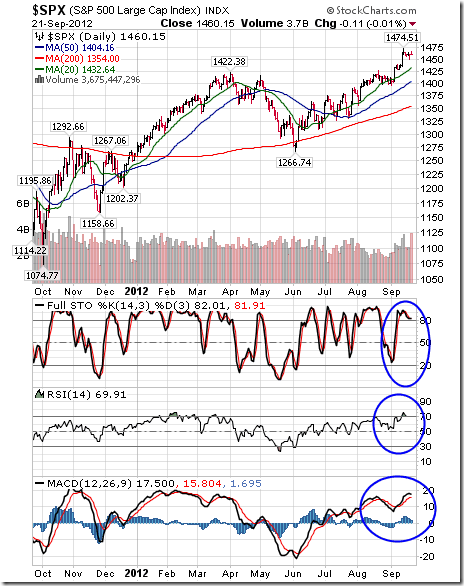
The S&P 500 Index plunged 49.40 points (2.65%) last week. Trend changed from up to neutral when the Index fell below the 1,839.57. The Index remains below its 20 day moving average and fell below its 50 day moving average. Short term momentum indicators are trending down.
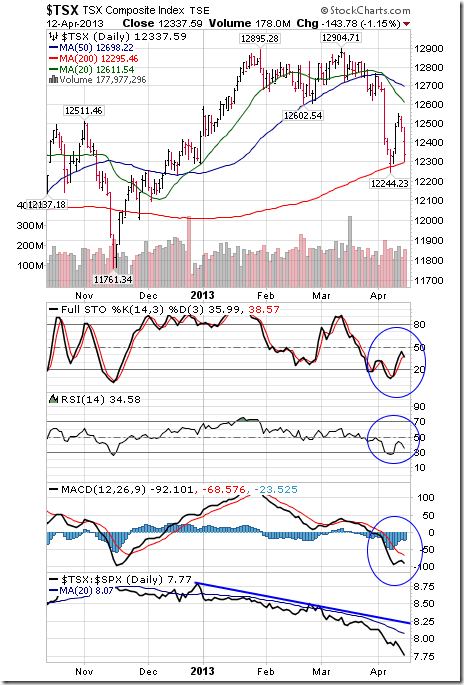
The TSX Composite Index fell 135.41 points (0.94%) last week. Intermediate trend remains up (Score: 1.0). The Index fell below its 20 day moving average (Score: 0.0). Strength relative to the S&P 500 Index changed to positive from neutral (Score: 1.0). Technical score based on the above technical indicators slipped to 2.0 from 2.5 out of 3.0. Short term momentum indicators are trending down.
To view 45 more charts & comments go HERE
Special Free Services available through www.equityclock.com
Equityclock.com is offering free access to a data base showing seasonal studies on individual stocks and sectors. The data base holds seasonality studies on over 1000 big and moderate cap securities and indices. To login, simply go tohttp://www.equityclock.com/charts/

When the former Soviet Union collapsed almost 25 years ago, most global strategic forecasters assumed that the U.S. would adapt pragmatically to her new status of sole world superpower. Instead she has pursued a variety of misguided nation-building adventures and has largely shrunk from her primary responsibility of neutralizing the ambitions of petty dictators around the world. From this perspective, America’s multi-generational expenditures on military personnel and equipment has become more of a stealth economic stimulus program rather than an insurance policy for global stability.
The massive failures of U.S. intervention in Vietnam, Iraq and Afghanistan have caused the Western Allies to fear the future deployment of troops. Instead they have resorted to preserving an impression of strength by pressing their agenda with minor nations like Serbia, Libya and Syria through a combination of endless diplomacy and relatively riskless air power. In doing so, they exposed not just a reduced military capability, but also far worse, a lack of will. This vital fact was not lost on America’s potential enemies.
 Sensing this weakness, President Vladimir Putin of Russia, who is likely the continent’s most aggressive power player since the Second World War, felt free to redraw the map of Europe when political events in Ukraine did not go his way. On the economic front, the crisis has vividly illuminated the differing interests of the European Union (EU) and the U.S. According to Eurostat, the EU imported 212 billion euros ($293 billion USD) worth of goods from Russia in 2012, while the U.S. imported a mere $29 billion. Furthermore, eight of the EU member nations are in trade surplus with Russia and the adverse trade balances of the remaining nineteen EU nations are relatively small. The difference in relative costs between the U.S. and these European nations that would arise from isolating Russia with major sanctions, let alone military action, are clear.
Thus far the Western response to his power grab has been underwhelming in the extreme. The minor financial sanctions placed on Russian oligarchs tied to Putin’s inner circle, and the few guided missile destroyers that have been deployed to the Black Sea will do little to change the trajectory of the Kremlin. It should then come as no surprise that Russian pressure on Ukraine did not stop with its fast motion annexation of Crimea, but has been steadily increasing in the last few weeks. In early April, cities throughout eastern Ukraine experienced the occupation of government buildings and police stations by ‘unidentified’ protestors, whom many suspect are Russian special forces in plain clothes. By mid-April, speculation was rife that Ukraine might be headed for civil war, providing an excuse for Russian intervention to ‘keep the peace’ and, like Hitler in the late 1930’s, to protect his own countrymen living in a bordering nation.
In Iraq and Afghanistan, the U.S. and its NATO Allies squandered large quantities of blood and treasure in fruitless experiments to alter the political and sociological realities of the Muslim world. However, in the Ukraine, which yearned for western-style democracy, the West offered merely money and rations. In doing so, they eroded drastically the age-old force multiplier of international prestige.
President Putin appears set on a clear strategy to re-colonize Russia’s old ’empire’ by means of so-called salami tactics in which he takes small slices of territory too minor to spark a conflict. But the slices ultimately pile high enough to provide a satisfying meal. If Putin’s victory in the Crimea is followed by success in the Ukraine, his next targets likely will be the so-called ‘Baltics’ of Estonia, Latvia and Lithuania. All of which are NATO countries possessing the guarantee of mutual defense from other NATO members including the U.S., UK, Canada and Germany. The potential for Putin to prove false this myth of guaranteed defense could usher the world into a world of much higher uncertainty.
On the other side of the globe, China is building its military, exerting increasing influence and extending its territorial claims in the eastern Pacific. Worse still, China and Russia appear intent on destroying the U.S. dollar’s privileged role as the international Reserve currency. Any major loss of this role could threaten severe declines for the U.S. dollar and spikes in U.S. interest rates. In short, a loss of U.S. dollar’s Reserve status would create a sudden and massive strategic change in a world to which entire populations have grown accustomed since WWII.
Despite the considerable risks created by the situation in eastern Europe, most western stock, bond and property markets, fed on massive central bank fiat liquidity, continue to flirt with new highs. (See an explanation of this in our latest report Taxed by Debt) This strikes me as an exercise in whistling past the graveyard. In the short term, investors may continue to profit from risk-taking in financial markets. However, as recessionary forces mount, commodity prices can be expected to drop, even exerting some downward pressure on precious metals. In the longer term however, as realization that serious threats exist, including the possibility of armed conflict in continental Europe, precious metals once again may shine as a safe haven asset.
In the larger picture, much of the geopolitical balance of power that has been in place for much of the past 25 years will be tested on the banks of the Black Sea. Investors should take a few minutes from their daily technical chart analysis to consider these major developments.
John Browne is a Senior Economic Consultant to Euro Pacific Capital. Opinions expressed are those of the writer, and may or may not reflect those held by Euro Pacific Capital, or its CEO, Peter Schiff.
Subscribe to Euro Pacific’s Weekly Digest: Receive all commentaries by Peter Schiff, John Browne, and other Euro Pacific commentators delivered to your inbox every Monday!
Stocks remain under selling pressure this week as they have been since the start of the second-quarter of 2014. The Dow Jones Industrial Average reached a peak of 16,574 on April 4, and for the most part, it’s been downhill since then.
The selling appears to be mainly driven by institutions, the so-called “smart money” crowd persistently unloading shares in the late afternoon.
Interestingly, some of the stocks and sectors hit hardest with selling in recent weeks were among last year’s best performers. Meanwhile, last year’s laggards are performing well in April, despite the increased volatility.
For example, the hardest hit sectors this month include last year’s two top-performers: Biotechnology and Internet.
Just a year ago investors couldn’t own enough of the high-beta momentum stocks. Biotech shares surged 74.3 percent in 2013, the top-performing sector, while Internet retailers ranked a close second with a 73.5 percent gain. Internet software and services cracked the top 10 with a 48.8 percent gain.
Alas, momentum can cut both ways …
Since late February the Nasdaq Biotech Index has tumbled 21 percent, while the Dow Internet ETF (FDN) is down 13.9 percent.
And yet the selling hasn’t exactly been indiscriminant either. In fact, while many high-flying tech stocks have been hammered, other, more reasonably valued tech sectors are performing well.

The same pattern plays out among healthcare stocks. Sure, biotech shares have dragged the entire sector down, but health care equipment stocks and managed care providers are two sub-sectors that have been largely immune to the sharp selloff.
That tells me the recent correction in stocks is more about sector rotation within the stock market rather than broad-based selling of all stocks. The big money appears to be cashing in some of last year’s big winners, and moving money into more undervalued sectors within the market.
And who can blame them after 70 percent-plus gains in biotech and Internet stocks last year?
Now, the smart money is finally piling into some of the out-of-favor sectors from last year … stocks and sectors that I have favored since late 2013, expecting just such a reversal of fortune. Or as the astute Michael Santoli recently wrote: “The dominant themes of the sharp pullback have been a reversal of the winning investment trades of 2013 (which got very crowded and expensive).”
Case in point: Mining stocks. You can’t find a more maligned group during 2013 than precious metal stocks. The Philadelphia Gold and Silver Sector Index (XAU) of mining shares plunged 48 percent in 2013, but what a difference a few months can make. Mining stocks are up 7 percent year-to-date, even after the recent pullback in the gold price, and at the peak in mid-March XAU was up 20 percent.
In fact, commodities in general have provided positive performance for investors so far this year. In a big trend reversal from recent years, the Continuous Commodity Futures Price Index (CCI), an equal-weighted average of commodity prices, has gained 11 percent year to date. Beneath the surface, several markets are performing even better.
Besides an 8.3 percent gain in gold … natural gas is up 9 percent, corn has popped 18 percent, palladium is up 10.8 percent … and coffee is up a stunning 82.6 percent!
This rotation out of last year’s best-performing stocks and sectors has been swift, and it’s clear that hair-trigger institutional investors are behind the move. I have noticed a consistent pattern in recent weeks for stocks to trade higher in the morning only to fall victim to an afternoon swoon.
That’s a sure sign of “smart money” selling at work just prior to the close. The Smart Money Flow Index (SMFI) (see graph below) subtracts the first half-hour of emotionally driven buying and selling from the Dow and places more focus on the last hour of trading.

click for larger version
This is based on the theory that the first 30 minutes of trading is dominated by market orders from retail investors or index-tracking funds. Meanwhile, the “smart money” waits until the end of the day to make their move into, or out of, stocks in a big way.
According to Bloomberg data, the Smart Money Flow Index has plunged 8.8 percent since the beginning of March, while the Dow itself has declined just 2 percent. This means the stock market’s heavy-hitters have been eager sellers into the close.
A negative divergence like this, when the SMFI is falling faster than the Dow, is generally a sign of selling ahead and lackluster returns for stocks. That is, until the “smart money” starts buying again.
The good news is that most stocks and sectors are already approaching oversold levels now, and the recent correction is creating more attractive prices for long-term investors, especially in select biotech and internet stocks.
So keep a watchful eye on the market’s direction during the all-important last hour of trading. Look for more buying on strength into the close, rather than selling into market weakness, as a first sign that stocks are stabilizing and the correction may be ending.
Good investing,
Mike Burnick

 With continued turmoil and uncertainty in global markets, today KWN is publishing another important piece that was written by a 60-year market veteran. The Godfather of newsletter writers, Richard Russell, says that he is buying physical silver because it’s “dirt cheap.” Russell also warned that the gold/silver ratio may plunge from 66/1 down to 16/1. This means the price of silver would more than triple the upside surge he expects for gold.
….read Richard’s full comment on all major markets including Silver HERE
There was an article in The Globe and Mail last week about how scientists are using the principles of 3-D printing to attempt to create a bionic heart. At about the same time, The Wall Street Journal published a lengthy story about how 3-D printing could revolutionize manufacturing by cutting both costs and timelines dramatically.
One example from the WSJ article: Ford Motor Company is using 3-D printers in its design centres to make moulds for prototype parts. “It takes four days and costs $3,000 to print a 3-D prototype of an engine’s air intake manifold, compared to four months and $500,000 without 3-D printing,” WSJ writer Bob Tita said.
3-D printing is a technology that makes it possible to create a solid object out of virtually any material from metal to human tissue. It has already been used to produce everything from titanium knee joints to plastic guns. The weapons applications scares the daylights out of authorities and the U.S. Department of Homeland Security has asked for legislation to make that aspect of the process illegal.

don’t pretend to understand how it works but from everything I’ve read the end products are as good or better than those made in traditional ways.
The process is not as new as most people think. According to Wikipedia, the technology has been around since the 1980s with the first working printer created by an inventor named Chuck Hill for 3D Systems Corp. But it is only in the past couple of years that the commercial applications of this mind-boggling technology have begun to capture the imagination of entrepreneurs and attract billions of dollars in investment money.
Someone asked me the other day to try to envisage what impact 3-D printing technology would have on the world a decade from now. I think it could potentially be as transformational as the Internet – perhaps even more so. The manufacturing implications are obvious – the U.S. Navy is already using the technology on an experimental basis to build equipment. But that’s just the tip of the iceberg. Imagine a 3-D printer in every home. Families could use 3-D kits to create toys for the kids, a kitchen table, patio furniture, new clothes, and maybe even a high-definition TV set. You may even be able to produce your own steaks. Let your imagination run wild!
As in the early days of the Internet, tech-savvy investors have been plunging into the stocks of 3-D printer companies, driving up prices to absurd levels in hopes of huge profits as the technology becomes cheaper and more widely available. Indeed, some basic 3-D printers can now be purchased for around $1,000 although those with commercial applications can run to hundreds of thousands of dollars.
Predictably, this has already led to a boom-bust scenario. 3D Systems Corp. (DDD), one of the industry leaders, has seen its share price plummet from a high of $97.28 in early January to the $50 range currently (figures in U.S. dollars). The company recorded a 45% growth in revenue in 2013 to $513.4 million. GAAP earnings for the year were $0.45 a share. The good news is the company is profitable but even at the current price the shares look very expensive.
Another big company is Stratasys Ltd. (SSYS), which posted revenue of $484.4 million last year but lost about $27 million ($0.68 a share). Its stock is down from a high of $138.10 in January to around $100 now, but it has held up better than many of its competitors.
The ExOne Company (XONE) is a smaller player but it is developing an impressive client list including the U.S. Navy, Caterpillar, and United Technologies. Sales last year were $39.5 million, up 38% year-over-year, but the company lost $6.5 million ($0.51 a share) and based on management projections ExOne will do well to break even in 2014. Its stock has also plunged, falling from a high of $78.80 last summer to around the $30 level now.
The bottom line is that 3-D printing is an exciting technology with what appears to be an almost limitless future, but investing in the sector right now is a minefield. Normally, the best way to take a speculative position in a rapidly developing field such as this would be through a specialty exchange-traded fund (ETF). However, none that focuses exclusively on 3-D printing companies has been created to this point, although several broader-based technology ETFs hold shares of DDD, SYSS, and others.
Therefore, my advice right now is to stand back while this fledgling market shakes itself out. There will be money to be made down the road but the challenge will be to identify which companies to choose. I’m intrigued by the potential here so I’ll keep a watch on the sector.
About the author:
GuruFocus – Stock Picks and Market Insight of Gurus

-
I know Mike is a very solid investor and respect his opinions very much. So if he says pay attention to this or that - I will.
~ Dale G.
-
I've started managing my own investments so view Michael's site as a one-stop shop from which to get information and perspectives.
~ Dave E.
-
Michael offers easy reading, honest, common sense information that anyone can use in a practical manner.
~ der_al.
-
A sane voice in a scrambled investment world.
~ Ed R.
Inside Edge Pro Contributors

Greg Weldon

Josef Schachter

Tyler Bollhorn

Ryan Irvine

Paul Beattie

Martin Straith

Patrick Ceresna

Mark Leibovit

James Thorne

Victor Adair