
Timing & trends
Just when you thought it was safe to go back into the market the gold price and junior resource stocks drop and nervous traders declare the sky is falling yet again.
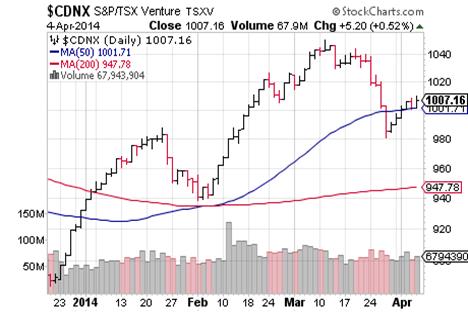
I’m not thrilled by the market action of the past two or three weeks but I also don’t think the basic narrative has changed. The gold price has corrected but I don’t think its rolled over unless it gets quite a bit lower. Likewise, the correction in the Venture Index is not large compared to some of its larger brethren and well within the bounds of what one would see as part of a larger bullish advance.
It’s still very quiet on the news front and this is one issue that needs repair before a strong bull run develops. Most companies just raised money so it will take time for them to start reporting from the field. That will help carry things forward and new discoveries and new ideas will help even more.
Most of what I’m seeing is still recycled. I think traders want some new ideas and the companies that deliver those can generate the sorts of gains that remind traders why they play resource stocks. I think they will come but first we need to see a renewed advance that calms down investors. Brokers and traders need to see more green on their screens before they are willing to pay up for untested ideas but I think that day is coming soon.
***
Did I mention I hate geopolitical gold price spikes? I believe I did. I made that comment in the last issue that was released just after a Crimean referendum that generated a wholly predictable result.
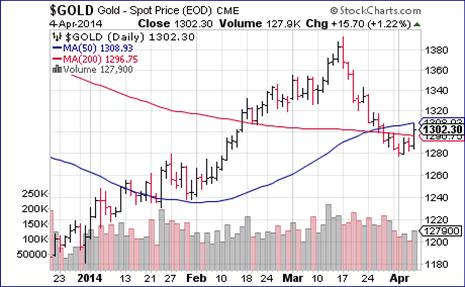
Gold topped immediately afterwards and continued to fall for the next two weeks notching a cumulative loss of over $100 before finding support around $1280. This has gold bugs and resource stock traders back into a (so far) mild panic. The question is whether metals and the producer and explorer stocks can get some near term traction and continue their advance.
I expected a pullback after the Crimean vote but was surprised by the strength of it. The political situation seemed co clear cut to me that I couldn’t convince myself that there was that much gold buying based on the Ukraine. Apparently there was. It’s mindboggling to me that traders who paid the slightest attention to the doings of Vladimir Putin in the past 15 years expected any other outcome. Things are still tense in the Ukraine but I expect it to fade as an above the fold political story.
Russia will probably complete an annexation in everything but name over the coming weeks and months. As long as Putin has total control of the logistical routes in and out of the Crimea I doubt he cares what the name on the map is. This was about winning and, so far, he’s won.
Where there may be tension is other eastern European states that want to continue to move away from Russia. Will the EU and NATO back them up or will Putin be allowed to strong arm them too? I hope for the former but political cynicism makes me fear the latter.
Of course the Ukraine was only half the story. Fed chair Janet Yellen had her own impact on the markets since the last issue. Off the cuff comments during the post Fed meeting news conference freaked out the markets and tanked the gold price. Here again, I find it a bit crazy that traders are still reacting to potential changes in QE taper and interest rate increases. Yellen has made it abundantly clear that decisions will be based on economic readings. She seems to understand better than Wall St that some of the improvement in the employment situation is statistical sleight of hand. The unemployment rate has dropped as much or more due to declining participation as new jobs.
That’s not to say my thoughts about the taper have changed. I think it’s baked in the cake that we get $10 billion monthly reductions until its unwound. There would have to be an enormous change in the readings to alter it and I don’t see that happening. Most of the blather surrounding Fed meetings is less important than Wall St is trying to make it out to be.
The combined effects of Fedspeak and the Ukraine are amply demonstrated in the above gold chart. Bullion fell all the way back to $1280 before finding recent support a popping back above $1300.
While I’m comfortable the longer term uptrend is in place it’s important that gold hold current levels. US retail gold traders are spooked but that can change quickly if a new uptrend is established, especially if NY markets are weakening at the same time.
I noted in a recent Special Delivery that physical demand in China has been more resilient than expected, with demand in the first two months of 2014 up 40% year over year. The real shift in Chinese demand came after the gold price plummeted last March. We need a couple of more monthly data points to convince skeptics. Those skeptics pointed to gold prices on the Shanghai market losing the premium to western prices but that moderated in the past few sessions. Large volumes of gold being imported by China should make the Shanghai market more liquid and naturally reduce divergence between prices on other markets. It may be that too much is getting read into falling premiums anyway.
The chart below displays the Venture Index from the start of the year. We may have put in another bottom a few sessions ago, before the gold price itself. I take that as a positive sign though I’d still like to see more volume. If this does turn out to be an interim bottom it would be pretty mild compared to the normal post-PDAC drop. That again would be a positive sign for the market through the rest of the year.
Base metals stabilized before gold thanks in part to a mini stimulus package announced by Beijing. Both copper and iron ore have seen nice bounces but both are also slated to go into surplus later this year regardless.
Copper wouldn’t need much supply disruption to bounce higher but my comments about potential for sales of metal used as loan collateral remain. I’m more positive than I was a couple of weeks ago but still cautious. The good news so far is there is little sign of panic in the Chinese market. Short term interest rates have dropped again recently and there has been a lot of rotation into emerging markets, both debt and equity. Much of this is hot money that can turn on a dime but it’s not matching up to the Wall Street narrative.
NY markets saw new highs again but things have looked shakier in the past few sessions. The selling is concentrated in the momentum sectors that helped drive those markets to records in the first place. That is not a bad thing. Even bulls were getting nervous about how high prices were getting.
The big danger is that momentum stocks overshoot to the downside when they roll over. It’s too early to tell but if selling accelerates we could get our 10% plus correction in a hurry.
Junior stocks can withstand weakening major markets if the gold price keeps moving up and the selling is not too abrupt. Resource stocks at least have the advantage of being undervalued.
Even with calm markets and a higher gold price, juniors desperately need news flow. That takes money. February was better for fund raising on the Venture (35% year over year and 120% above January) but things cooled off some recently. The improvement was even better on the main TSX board (58% yoy for Q1, much of that resource issuers).
The financing window is still open a crack and a couple of weeks of decent junior markets would allow for more placements. That will give companies the means to start generating meaningful news again. For the new bull market to stay and grow we’ll need news flow. Stay tuned for companies putting new money to work and looking for new audience.
Eric Coffin
Hard Rock Analyst
Ω
The HRA–Journal and HRA-Special Delivery are independent publications produced and distributed by Stockwork Consulting Ltd, which is committed to providing timely and factual analysis of junior mining, resource, and other venture capital companies. Companies are chosen on the basis of a speculative potential for significant upside gains resulting from asset-based expansion. These are generally high-risk securities, and opinions contained herein are time and market sensitive. No statement or expression of opinion, or any other matter herein, directly or indirectly, is an offer, solicitation or recommendation to buy or sell any securities mentioned. While we believe all sources of information to be factual and reliable we in no way represent or guarantee the accuracy thereof, nor of the statements made herein. We do not receive or request compensation in any form in order to feature companies in these publications. We may, or may not, own securities and/or options to acquire securities of the companies mentioned herein. This document is protected by the copyright laws of Canada and the U.S. and may not be reproduced in any form for other than for personal use without the prior written consent of the publisher. This document may be quoted, in context, provided proper credit is given.
©2014 Stockwork Consulting Ltd. All Rights Reserved.
Published by Stockwork Consulting Ltd.
Box 85909, Phoenix AZ, 85071
Toll Free 1-877-528-3958


What does it mean? We pose the question in hopes you can suggest an answer!
Join us on Facebook or Twitter (@michaelcampbelltweets) and share your thoughts.
“This is what I call an “erosion market.” It’s one of the nastiest types of markets that you’ll ever have to deal with. It’s illustrated in the Dow chart by a large cluster of back and forth movements, appearing almost like a solid block of fluctuating movements. This is a market where you buy a stock and a day later you’re sorry you bought it as the stock suddenly drops 10%.
The Dow Jones Industrial Average

By the same token, this is a market where you short a stock and a day later the stock rallies six points and you’re stopped out. An erosion market can be as costly as a bear market. Ten minor losing trades, when combined, can add up to one large, nasty loss. I’ve asked my subscribers to stay out of this market, because an eroding market can murder any portfolio over time.
I thought Friday was a key sentiment day. On Friday I thought outright greed and extreme optimism suddenly turned to questioning with just a touch of fear. The unimpressive employment statistics caused a strange and abrupt halt to the optimism. It was as though the pros in unison thought — “Has the Great Recession really ended?” At Friday’s close the Dow Industrials and Transports and NASDAQ were all down triple digits for the first time in many months.
Question — Russell, I gather you don’t care for this stock market since you have been on the sidelines except for physical gold and silver and one preferred stock. If you don’t care for this market, then why don’t you recommend shorts?
Answer — When you put out shorts you are depending on timing. If you short the market, you may be perfectly correct, but before the market or your stocks go down, suppose there’s a sudden violent rally. In a few days you are in a horrible fix. Should you cover? Were you wrong about shorting? You see, being on the sidelines takes you out of harm’s way, and leaves you invulnerable whether the market collapses or rallies first before it collapses.
My experience with subscribers shorting is that they usually end up losing both money and sleep. Don’t do it. If you must play for the downside, buy out-of-the-money puts in which case you can only lose the price of the puts — even if you are wrong.
More on sentiment. I’ve felt all along that the Great Recession never ended. It was masked to some extent by the Fed’s QE and zero interest rates. But if it becomes obvious that the US economy is still in recession, then the Fed will have to halt its tapering and change tactics. This kind of sudden change in strategy would be almost unheard of by the Fed. Actually, if the Fed abruptly halted its tapering, investors would immediately know that something was wrong, and that the economy was in trouble.
Thus, I see the stock market in an incredible position. The major stock averages are near or at record highs, based on investors’ perception that the US economy is in good shape and getting better. But if the perception of good times suddenly changes (which I think it did last Friday), then the stock market will be like Wile E. Coyote when he runs off the cliff and looks down and there is nothing but space under him!
I read a number of quotes by “name analysts” after Friday’s close. One well-known analyst said that he was so suspicious of the situation that he would not be shocked if the Dow “crashed” by twenty percent. And my thought was that most of the bears are thinking of a worst case being the long-awaited ten percent correction. My own thought is that if this market turns down, the fooler could be that the stock market may be completing the Bear market that started in 2007. The fact is that if the stock market turns down, nobody in this world knows where its is heading. Me, I vote for the sidelines along with physical silver and gold.
By the way, I note that one of my favorite newsletter writers wrote that “gold is just another currency.” I disagree. Gold represents pure wealth and unlike all other currencies, gold needs no nation to guarantee its worth or value. The gold that Cleopatra wore around her neck represented wealth in her time. And that same gold represents wealth today.
All the gold ever mined in history represents wealth today. Can any currency make that statement? No, gold is not just another currency. Tie up a bundle of hundred dollar bills, put them in a vault, and will them to your great-great-grandchildren. Then place twenty gold one-ounce coins in a box and will those coins to the same great-great-grandchildren. Which is a better and more valuable gift? Odds are the bundle of hundred dollar bills will, in due time, be worth nothing unless they have some collectible value.
Below we see the silver/gold ratio. And what’s this? The ratio has turned up in favor of silver. I encourage subscribers to take actual physical positions in silver. I think something is quietly brewing in silver. Buy the “monster” pack of 500 ounces of silver. The pack comes in a special green box, put out and packed by the US Treasury.
To subscribe to Richard Russell’s Dow Theory Letters CLICK HERE. Ed Note: I just spoke with Richard’s head office and I am told that Richard still wakes up every morning excited to see what is going on in the markets. That is why his production of writing for his customers is so prolific. Not only does he mail out his extensive Newsletter every 3 weeks, but he sends out a comment every day with his thoughts on the markets action that day. All this for .82 cents a day, or only $300 per year!

Next month marks the 3-year anniversary of the bear market in silver that started in May 2011. Later this summer we will hit the 3-year anniversaries of the bear markets in gold and gold stocks. We are now psychologically conditioned for pain and punishment in the gold markets and to beware of the next downward plunge.
In reality though gold has been in a basing phase. It’s not going down anymore, it’s going sideways where the downward plunges are muted and the upward rallies are still fake bear market rallies. What’s interesting about this base is that it started right at the height of bearishness in the gold market. That two day massacre in gold back in April 2013 when gold plunged below $1400 actually started the left hand side of the base. So right when everyone was panicking about gold, in reality it was starting to form a major bottom!
Just a couple months later after trying and failing to get back above $1400, gold made the low point in the base in June of 2013 around $1200. Gold then tried once again to get back above $1400, but then failed and retested the bottom of the base in December 2013. So a well established base formed in gold between $1200 and $1400 as you can see in the chart below.

Once gold held support again in December 2013 it rallied back to $1400 just last month, but then failed again and was turned back down to where it is today. So gold has been basing now for about a year between $1200 and $1400. Notice though in the previous chart the 30-week moving average has flattened out, and gold has now traded back above the 30-week moving average. Stan Weinstein, author of one of the best books ever on trend trading called “Secrets for Profiting in Bull and Bear Markets”, would call this a Stage 1 base.
Gold stocks have done essentially the same thing as gold. They started forming the left hand side of a base in April 2013, then traded mostly sideways for the rest of the year. Some of the gold stocks went on to make lower lows during the rest of 2013 but most of the damage had been done by the April-June time frame.
Taking a look a the GDXJ Junior Gold Miners ETF notice how the 30-week moving average has flattened out just like it has in gold. After going back and reading what Weinstein said about Stage 1 bases recently I noticed this quote which might relate to what we are seeing in the gold stocks today:
“But often volume will start to expand late in Stage 1, even though prices remain little changed. This is an indication that dumping of the stock by disgruntled owners is no longer driving down the price. The buyers who are moving in to take the stock off their hands are not demanding any significant price concession. This is a favorable indication.”
Notice the tremendous increase in volume in GDXJ since the start of 2014. As Stan says this is an indication that buyers and sellers have reached equilibrium. So after a year long base in gold and gold stocks, what were are looking for next is the breakout into a Stage 2 advance.
The ideal buy point, according to Weinstein, is when gold would breakout above the resistance of its base and above the 30-week moving average on above average volume. This would indicate buyers have taken back control of the gold market and a new bull market in gold is going to begin. Weinstein notes that there is often a retest of the breakout point during which a second chance opportunity arises to do low-risk buying.
Checkout what the solar stocks did from April 2012 to April 2013. They had a similar basing period to the current gold market. The solar ETF TAN based for about a year then broke out of the base on an increase in volume in May 2013. Then TAN retested the base towards the end of June 2013, and from there broke back into the Stage 2 advance that is still ongoing today. This is a great example of Stage Analysis in action.
So the bottom line is gold is in a basing phase, and this has been going on for about a year since April 2013. According to Stage Analysis the ideal buy point would be the breakout above $1400 on an increase in volume, or on a retest of $1400 after a breakout occurs.
Connect with me on Twitter: @nextbigtrade
The original article and much more can be found at: http://www.nextbigtrade.com
The views and opinions expressed are for informational purposes only, and should not be considered as investment advice. Please see the disclaimer.
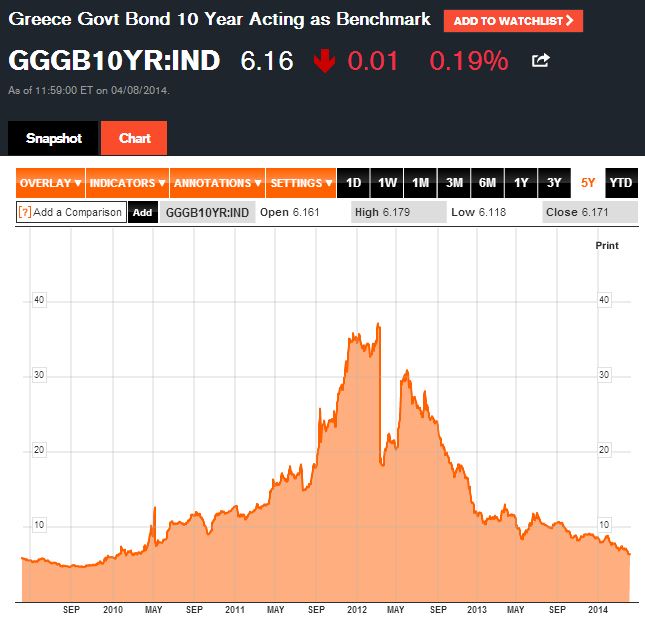 Greek 10 yr bond rates are returning to pre-crisis levels. What does it mean?
We pose the question in hopes that you’ll have an answer!
Join us on Facebook (Michael Campbell’s MoneyTalks) or Twitter (@moneytalkstweet) and share your thoughts.

-
I know Mike is a very solid investor and respect his opinions very much. So if he says pay attention to this or that - I will.
~ Dale G.
-
I've started managing my own investments so view Michael's site as a one-stop shop from which to get information and perspectives.
~ Dave E.
-
Michael offers easy reading, honest, common sense information that anyone can use in a practical manner.
~ der_al.
-
A sane voice in a scrambled investment world.
~ Ed R.
Inside Edge Pro Contributors

Greg Weldon

Josef Schachter

Tyler Bollhorn

Ryan Irvine

Paul Beattie

Martin Straith

Patrick Ceresna

Mark Leibovit

James Thorne

Victor Adair