
Timing & trends
Here they are: the most important charts in the world from Wall Streets brightest minds.
We asked our favorite portfolio managers, strategists, analysts, and economists across the Street for the charts they deem the most important right now. This is what they sent us.
Much of the focus is on the amount of slack left in the labor market and the U.S. economy in general. Many are focused on the euro, too, which has surprised many observers with its persistent strength.
But there are a lot of other things going on — such as the drop in inflation expectations since the Fed began winding down quantitative easing (QE).

For those wanting to initiate investments in precious metals & related instruments, this authors conclusion is quite optimistic. Despite the ominous title, the author is describing the highs before the declines into recent lows. His conclusion contains the following quote: “Irrationally low prices are the greatest opportunities for the investors, as all markets return to the mean. For the moment, I think that we have a decent bottom in place” . Good charts & a good read- Money Talks Editor
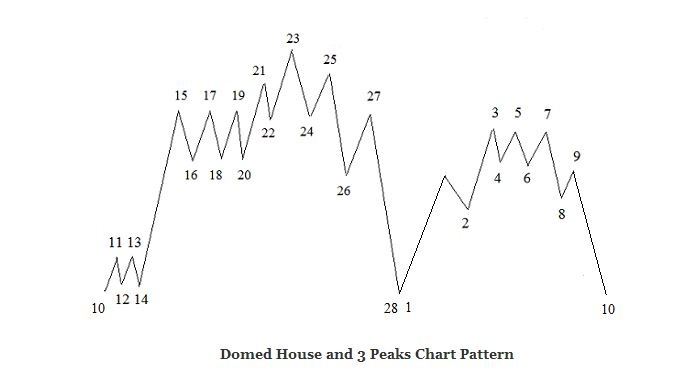
Miners Index: Domed House and Three Peaks Chart Pattern
The Miners Index has made a perfect Domed House and Three Peaks Chart Pattern. This pattern, discovered by a stock market analyst, George Lindsay, can be found in multiple timeframes. On the following charts you can see the model of the Lindsay’s Domed House and Three Peaks Pattern, as well as the current chart of the Miners Index (HUI). You can notice that the HUI Index has made a perfect Domed House and Three Peaks Pattern during these last ten years.
On the right side of the HUI Patterns Big Picture chart you can see that the three peaks (3-5-7) were followed by two strong waves decline into point 10. This down move defined the “separating decline” as prices separate the Three Peaks from the rest of the formation. Point 10 returned to point 28 and prices rebounced strongly on the Symmetry Guide Line as they normally do.
You can also notice that the Domed House Pattern (275 weeks) lasted almost for exactly the same period as the Three Peaks Pattern (269 weeks). The Domed House and Three Peaks Pattern is now complete as final point 10 returns to points 28-1 level. I have been following this pattern for a long time and it is important to monitor such chart formation as it plays an important role in the market.
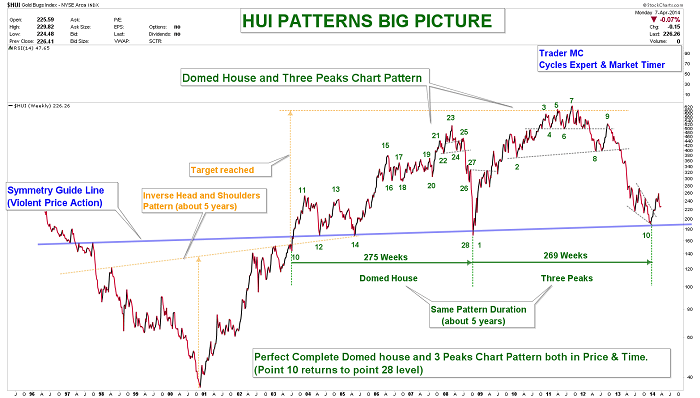
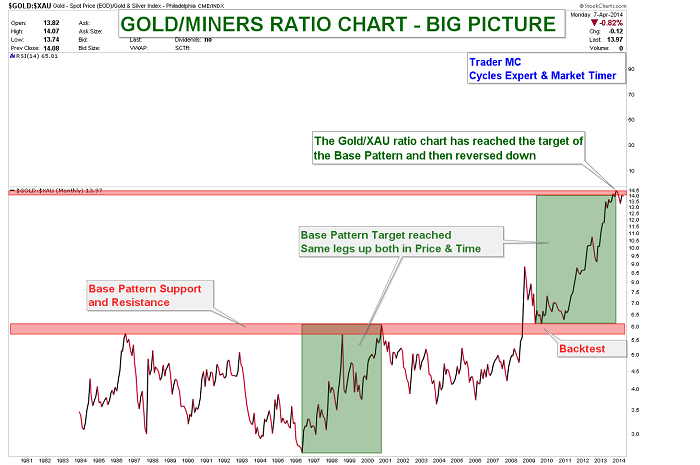
As you can see, both the Domed House and the Three Peaks Patterns have violent up moves, followed by strong reversals. In order to understand how the market works, it is important to keep in mind that all markets return to the mean. On the charts below you can see that the HUI Index, the Gold/XAU ratio and the SPX are far stretched from the 65 Monthly Moving Average. Every time it happened in the past, it generated a violent regression move which is a normal reaction for a market that has been too extreme. (I also included the Bonds and the Commodities charts as additional examples.) These charts are suggesting that odds favor an upside move for the Miners and a correction for the SPX Index on the intermediate term trend.
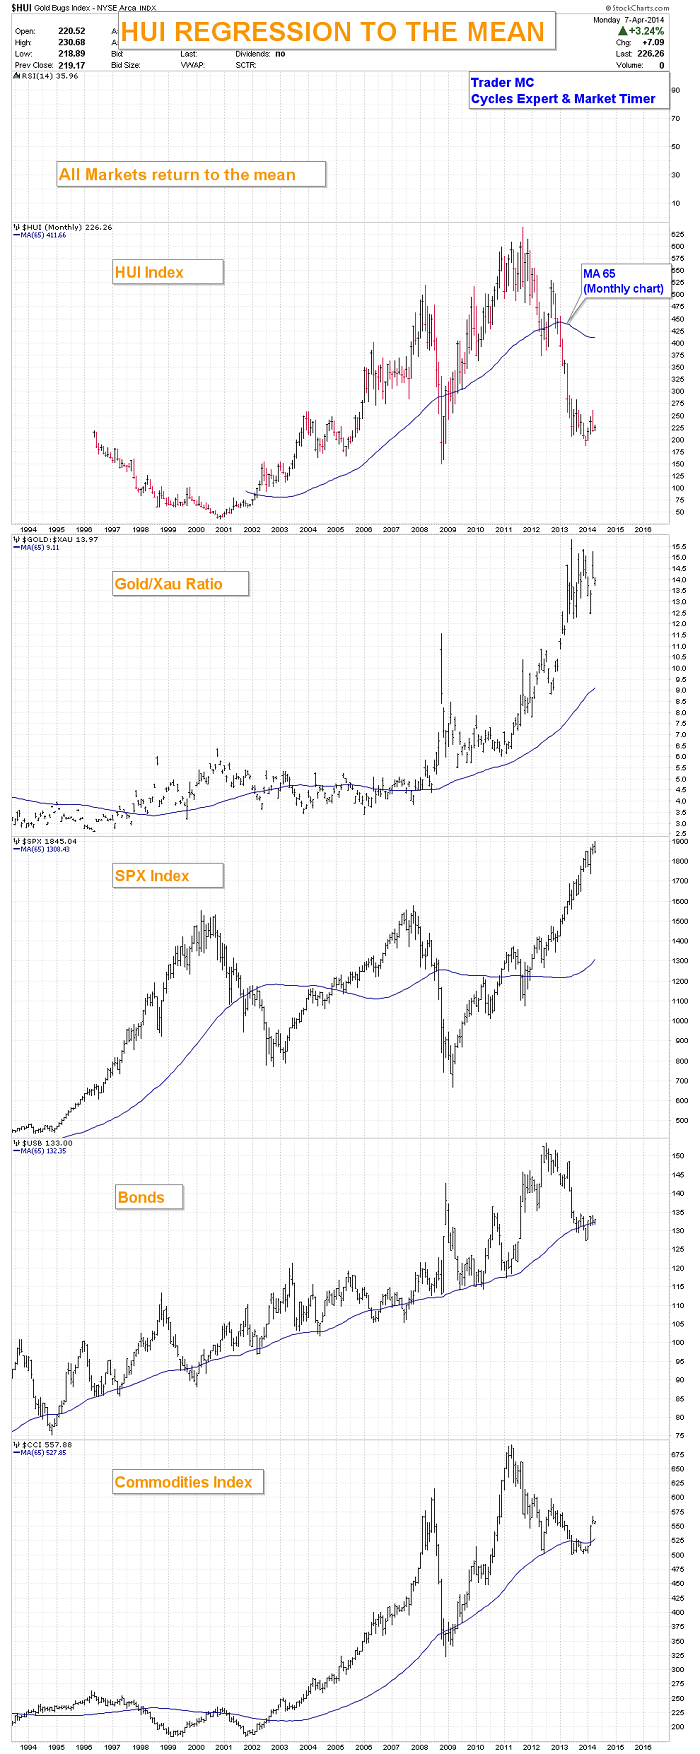
The next chart shows that the Gold/XAU ratio has reached its Base Pattern target and has a lot of downside potential. The vertical moves show how badly the Miners have performed to Gold these last two years. A regression to the mean may result in a violent down move and the Precious Metal stocks could strongly outperform the Gold Metal.
Here is another chart of the HUI Index where you can see that prices are between the two major parallel trend lines. The false breakdown last December looks like a bear trap and could have been a Multi-Year Cycle Low as it was late in the timing band for the HUI to print a Yearly Cycle Low. The lower blue trend line of the primary channel is still acting as a resistance and needs to be monitored closely. If prices go back into the blue channel, it would be a bullish sign for Miners.
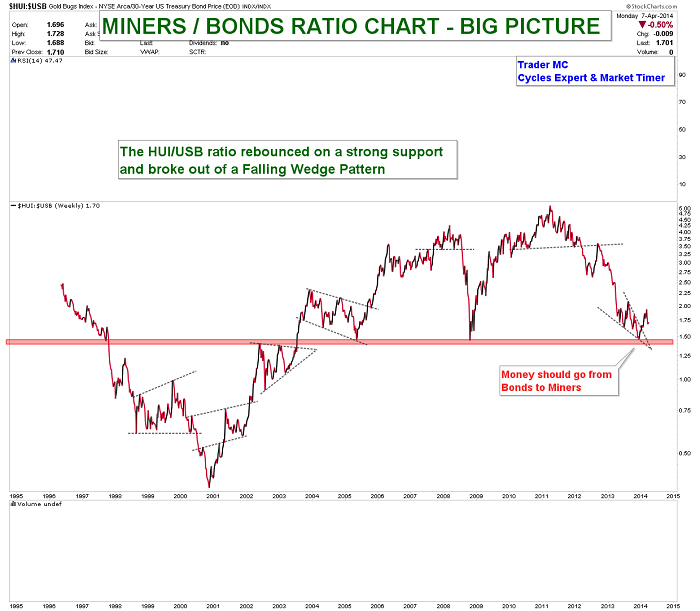
Next is the Miners/Bonds ratio chart. You can see that the HUI/USB ratio rebounced on a strong support and broke out of a falling wedge. Miners are outperforming Bonds and I expect more and more investors to leave the Bonds sector and to come into Miners during the coming months.
It is also interesting to keep an eye on the HUI/SPX ratio chart. Once a breakout of the resistance trend line occurs, Miners will be more attractive for the investors than the SPX Index. The HUI/SPX ratio got rejected right on the resistance trend line last month but the next attempt could be a successful one.

Irrationally low prices are the greatest opportunities for the investors, as all markets return to the mean. For the moment, I think that we have a decent bottom in place but nobody can predict the markets with 100% accuracy as they are irrational and like to push things to the extreme. I therefore cannot rule out the possibility of one more down move in Miners – in order to bring extreme pessimism – but if it happens then I expect it to be very brief, as the regression to the mean forces should play out and that would result in a great buying opportunity.
— Posted Tuesday, 8 April 2014
In this report, we will outline how to recognize market tops when they occur.
Every market top is slightly different, but they always have many things in common. There are always tell-tale signs in economic data, market sentiment, capital markets activity, corporate actions, etc. We will look at historical market tops: 2007, 2000, 1990, 1980, 1976, and 1972. We will then look at the current market and see how today compares and what we can learn from that. We hope this research report will be a blueprint and a useful tool for investors for years to come.
Today the market shows many of the elements that are present near market tops. In particular, sentiment is extremely bullish, investors are very long and leveraged, and valuations are extended on a wide variety of measures. However, leading economic indicators are still not negative, and so far breadth and technicals have not deteriorated. Medium term stock market returns are likely to be negative due to excessive valuation, but there is no imminent sign of a market top. We would need to see a deterioration of our leading indicators before calling a market top.

In the following table, we summarize the characteristics of market bottoms and tops. The table is a very useful checklist that investors can print and consult as events unfold in markets around the world. Clearly, many signs of a top are in place, but there are many characteristics that are currently missing. This report looks in detail at each of the signs: corporate, valuation, economic, market and sentiment.
For a larger view of the table below go HERE
If you would like to receive the full 28 page report, please go HERE


“In the economic sphere an act, a habit, an institution, a law produces not only one effect, but a series of effects. Of these effects, the first alone is immediate; it appears simultaneously with its cause; it is seen. The other effects emerge only subsequently; they are not seen; we are fortunate if weforesee them.
“There is only one difference between a bad economist and a good one: the bad economist confines himself to thevisible effect; the good economist takes into account both the effect that can be seen and those effects that must beforeseen.
“Yet this difference is tremendous; for it almost always happens that when the immediate consequence is favorable, the later consequences are disastrous, and vice versa. Whence it follows that the bad economist pursues a small present good that will be followed by a great evil to come, while the good economist pursues a great good to come, at the risk of a small present evil.”
– From an 1850 essay by Frédéric Bastiat, “That Which Is Seen and That Which Is Unseen”
I’ve come to South Africa a little bit ahead of my speaking tour next week to spend a few days “on safari.” Which is another way to say that I am comfortably ensconced in a game lodge next to Kruger Park, relaxing and trying to get some time to think. We’ve been reasonably lucky on the game runs: besides the usual lions, rhinoceri, water buffalo, etc., we’ve seen both cheetah and leopard, two animals that avoided my vicinity on every other trip to Africa. I’m here at the end of the rainy season, so everything is lush and green, and you have to get a little lucky to find the animals in the dense bush.
In several moments here, I was reminded of an essay I wrote two years ago called “The Lion in the Grass.” So I went back and read it and decided to update it fairly extensively in order to talk about the hidden lions we don’t see today that could catch us unawares tomorrow. Just like the African bush I am surveying at this moment, the economic landscape out there could harbor some serious but still unseen problems.
I have been captivated by the concept of the seen and the unseen in economics since I was first introduced to the idea. It is a seminal part of my understanding of economics, at least the small part I do grasp. It was introduced by Frédéric Bastiat, a French classical liberal theorist, political economist, and member of the French assembly. He was notable for developing the important economic concept of opportunity cost. He was a strong influence on von Mises, Murray Rothbard, Henry Hazlitt, and even my friend Ron Paul. (I will have to ask Rand about his familiarity with the Frenchman the next time I see him.) Bastiat was a strong proponent of limited government and free trade, but he also advocated that subsidies (read stimulus?) should be available for those in need. “[F]or urgent cases, the State should set aside some resources to assist certain unfortunate people, to help them adjust to changing conditions.”
Today we explore a few things we can see and then try to foresee a few things that are not quite so obvious. The simple premise is that it is not the lions we can see lounging in plain view that are the most insidious threat, but rather that in trying to avoid those we may stumble upon lions hidden in the grass.
But first, I really want to urge you to consider joining me in San Diego May 13-16 for myStrategic Investment Conference. We are continuing to fill out the strongest list of speakers we’ve ever had in our 11 years at this. My good friends George Gilder, Stephen Moore of the Wall Street Journal, and Neil Howe (who wrote The Fourth Turning) have all agreed to come and join Niall Ferguson, Newt Gingrich, Kyle Bass, David Rosenberg, and a dozen other A-list speakers from around the world. You can see who else will be there by clicking on the link above or here.
And I’m especially honored and pleased to announce that Vice Admiral Robert S. Harward, Jr., has agreed to join us on Wednesday night as a special keynote speaker. The three-star admiral (just recently retired) is a Navy SEAL and former Deputy Commander of the United States Central Command. In addition to his numerous other positions and awards, he also held the title of “Bull Frog” from 2011 until 2013 (longest-serving SEAL on active duty).
This is simply the finest economic and investment conference anywhere in the country. Don’t procrastinate; make your plans to come and register now.
When I was discussing this concept with Rob Arnott (of Research Affiliates and the creator of Fundamental Indexes) in Tuscany a few years ago, he mentioned the following photo, which he took on the savannah in Tanzania. I think it’s a perfect way to start out our discussion of the lions in the grass.

Going back to Bastiat, let’s look at that first sentence:
In the economic sphere an act, a habit, an institution, a law produces not only one effect, but a series of effects. Of these effects, the first alone is immediate; it appears simultaneously with its cause; it is seen. The other effects emerge only subsequently; they are not seen; we are fortunate if we foresee them.
It is natural to focus on the apparent dangers in front of us. That is part of our evolutionary heritage from the time when humans were first dodging lions and chasing antelopes on the very African savannah in Rob’s picture. But we soon learned that, if we were to survive, it wasn’t enough to dodge the lions we could see. It is the hidden lions that may spring upon us suddenly and take an arm or a leg.
Below I have once again reproduced Rob’s picture. Even when I knew there was a hidden lion, I couldn’t find it. But after it was pointed out to me, it is now the first thing I see. And there is a direct analogy there, to both economics and investing.
So, before you go to the next page, I suggest you go back and look one more time to see if you can spot the hidden lion. Just for fun, you know.
I showed this to a friend of mine who is a hunter, and he found it almost immediately. But then he has taught himself over the years to look for hidden game. And as Bastiat noted, it is the skilled economist who looks for the effects that are hidden, the surprises that are unseen. It should be a habit to look at the potential second- and third-order consequences of what we can see happening before our eyes. That way, we not only avoid the hidden lions, we also turn what would hunt us and do us harm into the hunted. Sometimes, the dangers themselves can be turned into a very nice trophy indeed – if you can act in time.
As I noted, that previously invisible lion is now the first thing I see. And that is the way with economic lions in the grass. Once someone points one out, it’s obvious, so obvious that we soon convince ourselves that we would have seen the lion without help. How many people told you they “knew” all along that subprime debt was going to end in tears? Or that the housing market was a bubble? Or that we would be plunged into the Great Recession?
I remember that in the fall of 2006 I was beginning to talk about the probability of a recession, in this letter, in speeches, and in numerous media interviews. (There is one such episode still up on YouTube.) I was told I was ignoring what the market was telling us, and indeed the market proceeded to go up for another six months or so. Being early is lonely. Me and Nouriel. J
Today there are a lot of people who tell us they knew there was a recession coming all along. In fact, the farther we get from 2006, the greater the number of people who remember making that call. It now seems I had no reason to feel so lonely out there on that limb, scanning the tall grass of the savannah. In retrospect, it seems that limb was rather crowded.
So, with that in mind, let me show you where the other lion is. Then go back and look at the first picture. After a few times you will see the hidden lion almost before you see the obvious ones.

Black Swan or Hidden Lion?
I should note that a lion in the grass is different from a black swan. A black swan is a random event, something which takes us all by surprise. Economic black swans are actually quite rare – 9/11 was a true black swan. Other than Nostradamus some 500 years ago, who saw it coming?
The last recession and the credit crisis were not true black swans. There were those who saw it all coming, but few paid attention. They were dancing right along with Chuck Prince to the rousing music of a bull market and swelling profits.
As we know now, a few people saw the subprime crisis coming and made huge fortunes. Sadly, pulling that off generally required one to risk a small fortune to play in that game. So while I talk about the lions hidden in the grass, remember that if you can figure out how to play it, there can be large profits betting on that which is unseen by the markets.
Now, let’s look at a few obvious lions and then see if we can spot a few hidden lions lurking nearby.
By some miracle, Mario Draghi and his team at the European Central Bank (ECB) continue to get from their communication tools what most central banks have to take by force. Widespread complacency has washed over the region in the months and quarters since July 2012, when Mr. Draghi introduced the Outright Monetary Transactions (OMT) facility and adamantly promised to do “whatever it takes” to preserve the euro system.
As a result, government borrowing costs are converging back to pre-crisis levels even as falling inflation brings the next debt crisis forward … and markets are clearly still responding to the ECB’s increasingly hollow commitments.
Without changing the ECB’s main policy rate at this week’s monetary policy meeting, Mr. Draghi once again attempted to talk his way to a policy outcome by suggesting that he has the broad-based support to authorize quantitative easing, if and when it is needed. It will be needed – and maybe soon.
As I wrote late last year, European banks are in terrible shape compared to US banks. We think of German banks as the epitome of sobriety, but they have been on a lending binge to creditors who now appear to be in financial trouble; and with 30- or 40-1 leverage, they could easily see their capital fall below zero. Despite modest bank deleveraging across the Eurozone since early 2012…

… public and non-bank private debt burdens have not improved:

Low inflation is also seriously disrupting government debt trajectories. The analysis below from Bank of America Merrill Lynch shows how low inflation, near 0.5%, raises debt trajectories in France and Italy that would be a lot lower under a normal, 2%, inflation scenario. As the charts show, persistent “lowflation” for several years could add another 10% to 15% to the public debt-to-GDP ratio in each country … even if rates stay where they are today.


In addition to unsustainable debt loads and steeper debt trajectories, debtor countries continue to run relatively large fiscal deficits. Just look at Spain, France, the Netherlands, and Italy:

While this toxic combination bluntly confirms higher default risk in countries like France, Italy, and Greece relative to Germany, risk premiums over German bunds have collapsed in the quarters since Draghi’s July 2012 statement. The bond market clearly does not see any risk in sovereign debt.
As you can see in the chart below, government borrowing costs across the Eurozone have converged to pre-crisis levels without the ECB’s buying a single bond. (In fact, the ECB has let its balance sheet shrink dramatically over that time.)

Even Greek rates are back to pre-2010 levels:

Both France and Italy are getting close to the point at which the markets will begin to question their ability and willingness to deal with their deficits. Without serious action by the ECB, this situation has the potential to become quite unstable very quickly. But the lack of effort by France, at least by the Hollande government so far in its first term, is clearly taxing the patience of the Germans. They recently signaled willingness to allow the ECB to begin to come up with its own form of quantitative easing; but without French cooperation on its deficit, it is difficult to imagine the Germans staying as patient as they have been.
The bond market is clearly not paying attention to the nuances of how defaults happen. Greece’s hard-won primary budget surplus may actually raise the odds of a formal default. According to Benn Steil and Dinah Walker at the Council on Foreign Relations,
The Greek government has far less incentive to pay, and far more negotiating leverage with, its creditors once it no longer needs to borrow from them to keep the country running…. This makes it more likely, rather than less, that Greece will default sometime next year. As [the graph below illustrates], countries that have been in similar positions have done precisely this – defaulted just as their primary balance turned positive.

Here we may catch sight of a lion’s face peering out from the tall grass – not just the long anticipated possibility of a Greek default but the roaring return of default risk in Eurozone sovereign spreads. That lion could pounce this year if startled by Greece, or it could lie in wait for a distinctively French BANG! moment … but it is only a matter of time, as long as highly indebted governments continue on their current trajectories.
My young partner and protégé, Worth Wray, wrote about the nasty prospects for a Chinese slowdown in Thoughts from the Frontline just a couple weeks ago; and he pointed to a series of signs that may eventually reveal the most dangerous of big cats hiding in our global economic grasslands. I’ll let you go back and read his research for yourself, but the main ideas are powerful:
China’s private-sector debt is going parabolic…

… and the Middle Kingdom’s corporate debt is now the highest in the world.

Moreover, the Chinese economy is employing that credit very inefficiently, taking on more and more debt for less and less growth.

History suggests that China’s Minsky Moment is approaching quickly, since corporate debt has topped 150% and total debt is over 210%. Investors around the world should prepare for the inevitable demand shocks and falloff in global growth … regardless of the specific outcome. The Chinese government may have the assets to backstop a truly horrific crisis and maintain slow growth in the 2-3% range, but history suggests that China could land very hard.
Over the last fifty years, every investment boom coupled with excessive credit growth has ended in a hard landing, from the Latin American debt crisis of the 1980s, to Japan in 1989, East Asia in 1997, and the United States during both the late 1990s internet bubble and the mid-2000s housing bubble.
The lesson is always the same, and it is hard to avoid. Economic miracles are almost always too good to be true. Broad-based, debt-fueled overinvestment (misallocation of capital) may appear to kick economic growth into overdrive for a while; but eventually disappointing returns and the consequent selling lead to investment losses, defaults, and banking panics. And in cases where foreign capital seeking strong growth in already highly valued assets drives the investment boom, the miracle often ends with capital flight and currency collapse.
Worth and I talk about China constantly and always reach the same conclusion. There is no way to really know what is happening there today, much less what will happentomorrow. The primary data is flawed at best, manipulated at worst, and riddled with inconsistencies when we compare official data to more concrete measures of economic activity.
Since we published “China’s Minsky Moment?” two weeks ago, the official data flow – which shows admittedly soft but fundamentally sound production – continues to conflict with real-world indicators, which reveal some alarming declines in production, prices, and demand. For example, the official manufacturing Purchasing Manager’s Index (PMI) for March 2014 indicates that manufacturing expanded, while the more objective HSBC MarkIt PMI suggests an alarming contraction in manufacturing activity that is consistent with a rough landing.

With such an ambiguous picture, we cannot know for sure whether Chinese production is moving ahead or falling behind… but a Kookaburra in the regional economic coal mine is calling at the top of its lungs. The recent collapse in Australian new export orders and moderate contraction in Australian production could point toward a real man-eater lurking in the Chinese bamboo (now that’s what I call some real tall grass!).

Lions in the US Stock Market?
Before the credit crisis, market makers like Bear Stearns, Goldman Sachs, Merrill Lynch, Morgan Stanley, and Bank of America created a huge amount of the overall liquidity in major markets by consistently taking “the other side” of trades. If the markets were selling, market makers bought, and vice versa.
In the wake of 2008, the big market makers either went out of business, merged, and/or were forced to operate at much lower levels of leverage. The net effect is far less trading volume from market makers and other forms of “real money,” to the point that high-frequency trading and ETFs accounted for about 66% of all trading volume in 2010. While that number has fallen to about 50% today, equity mutual fund flows suggest that higher trading volume from smaller investors, not the resurrection of market makers, is responsible for the shift.
In fact, the following chart from Credit Suisse suggests that the average daily trading volume from “real money” fell by more than half from 2008 to 2012, as high-frequency trading advanced. I do suspect that “real money” volume is rising today with the rotation that is underway into an overvalued, overbought, and overbullish market (but let’s save that for our conclusion).

Understanding how the structure of market participants has changed, let’s think about the effect of there being less market-making volume to balance against high-frequency trading and the retail/institutional herd.
On May 6, 2010, the markets sold off for most of the day, and market makers expanded their volume as the media ran all-day coverage of a small riot in Greece. But (and this is critical), market makers who can no longer buy at 40x leverage will carry only so much inventory overnight. At some point market makers must stop buying … and they did when a large sell order came into the market toward the end of the day on May 6. The market makers stepped back instead of providing liquidity, precipitating a sharp drop in prices. Then many of the HFTs shut their systems down, seeing an irregular trading pattern and fearing another “Quant Crisis” like the one in October 2007. Liquidity dried up in a matter of minutes, and the market went into free fall … triggering stop losses and emotional selling from the general public. (As they saw the market collapse and the rioting in Greece, people may have thought, “Something big just happened and I am late… sell everything!”). Without market makers to provide volume, an orderly sell-off became a chaotic collapse.
Now, with market-maker volume way down, a similar situation could develop again; and once again the general public will rush to sell if liquidity evaporates. We should really think about this dynamic, because the next correction may look more like the stock market crashes of 1929 or 1987 as opposed to the more gradual “cascading crash” we all experienced in 2008.
With that in mind, investors will do well to pay attention to the ever-changing structural makeup of the markets before blindly jumping in. Just because US stock markets – along with a lot of the major markets around the world – have found new highs since 2008 doesn’t mean they have healed structurally. It doesn’t mean they are stable. And with long-term valuations at historic levels, both on an absolute basis and relative to the rest of the world, US equity markets are both unstable AND overpriced.
The inevitable correction that is coming to US markets could be a catalyst for a downturn in the broader economy, and without much of a warning. It could be another lion, prowling through fiber-optic cables, data feeds, and stock exchange servers.
I continue to believe that high-frequency trading should be reined in. It is creating the illusion of liquidity, which can dry up in a heartbeat while at the same time sucking billions of dollars from the trading of individuals and institutions.

I’m not trying to stop computerized trading, but if the bid or offer were required to last for at least half a second, I think the problem would be mostly fixed.
It has been said that you can’t consider yourself a real global macro trader until you have lost money shorting Japanese bonds. Nevertheless, Japan is a bug in search of a windshield, with a debt-to-GDP of almost 230% (and growing by 8-10% a year). The Japanese savings rate (see chart below courtesy of Kyle Bass and team at Hayman Advisors) has steadily declined from its high of nearly 20% in the early ’80s and will soon go negative. At that point the thought is that Japan will need to seek out foreign investor to buy its bonds. And who will buy a Japanese bond at 1% for ten years? Yet, if rates only rise by 2%, then Japan would be spending almost 80% of tax revenues on just the interest on its bonds. I would submit that this is not a workable business model.


So traders keep shorting Japanese bonds (JGBs) … and they keep losing money. But what if Japanese rates never rise? How could that be, you ask?
Given that Japan would collapse if interest rates were to rise, it may be that interest rates will not be allowed to rise. The Bank of Japan will crank up the printing press for their own version of Operation Twist, but on a scale that will make the other central bankers of the world jealous.
But if Japanese bonds don’t revalue (on an internal basis), the consequence is that the Japanese yen will go seriously south – 125 to the dollar? 150? 200? Do I hear 250?
This week Japan increased its consumption tax rather seriously. That is a deflationary hit to their economy and one they cannot easily withstand. But to me this move is part and parcel of their overall plan to get out of the current crisis. They are raising taxes in an effort to increase government revenue with the hope of being able to balance their budget. They will offset the negative economic effects with continual and increasingly massive injections of quantitative easing. I expect another round to be announced relatively soon.
This will bring howls of protest from Japan’s neighbors and will certainly raise eyebrows at the next gathering of the world’s major central bankers.
At what point will you be able to buy a Lexus for less than you can buy a Kia? Think that will make Korea happy? Or any of Japan’s Asian neighbors? Think the Japanese care? They will continue to churn out quality products made with robots that will compete very favorably with those of any industrial country. Japanese equities will soar in such an environment (in terms of a depreciating yen), which makes buying cutting-edge Japanese stocks and shorting the yen an interesting trade.
But that is the lion we can see. The lion we are missing is the probability that such a development will trigger a massive currency war, which will be far more significant and costly than anything we have seen in our lifetimes, as I described in my latest book, Code Red.
Which brings me to a recent interview my team conducted about the effects of the Fed’s actions. It includes segments from my friends and colleagues Grant Williams, Louis Gave, and David Hay. None of us can predict exactly what the Fed is going do next, or the aftermath of their actions (although we certainly try). But regardless of what comes next, we can prepare ourselves … and that’s the real point of today’s letter and this video.
South Africa, Amsterdam, Brussels, Geneva, and San Diego
I’m finishing this letter on a beautiful morning in South Africa near Kruger Park. Sunday I fly to Cape Town, where I will make several presentations and then fly on to Durban for more presentations and then to Johannesburg, all at the behest of my sponsors, Glacier by Sanlam. It will be a very busy four days. I will spend Friday writing up my notes about what I learned on this trip for your regular weekly letter, and then I’ll start the journey back to Dallas. I will be home for a little over two weeks before heading to Europe on another speaking tour. Then I am back home for a few days before hopping over to San Diego for my Strategic Investment Conference, where you really should join me!
As my dad would say, “I’ve been to two hog callings and three county fairs, but I never seen anything like this.” I have traveled to a few extremely nice venues over the years, but nothing approaches the level of quality and service – the total experience – that I’ve enjoyed the last few days at the Royal Malewane. The food is simply exquisite, and each night they prepare a feast somewhere under the stars. The attention to detail is amazing in every aspect of this place. It is relatively small, and each villa is set apart for total privacy – except from the monkeys and the occasional elephant that evidently finds the chlorinated water in your personal pool a refreshing treat. I want to thank my Dallas friend Erin Botsford for recommending this place and my South African partner, Prieur du Plessis, for making it happen. It has been a memorable four days and an experience that I am rat her inclined to repeat, if I have the opportunity. If you decide to pay the Royal Malewane a visit, tell them John Mauldin sent you.
There has been quite a contrast as I have been plowing through two books dealing with the effects of technological change on our future while living the slow rhythms of Africa in a facility that harkens back to a period of time when life was more genteel. It is probably a good thing I am leaving tomorrow, as I might get too used to this. It’s quite the dream for this country boy from Texas.
It is time to hit the send button – they’re calling me for my last game run. Have a great week.
Your amazed at what life brings me analyst,

John Mauldin
subscribers@MauldinEconomics.com

“Japan’s markets are massively under-invested. No reason why Nikkei couldn’t double, its been in decline for 23 years – Jim Rogers, CEO of Rogers Holdings
The link above is a video. For a written explanation of what is happening in Japan read the following from Rick Mills – Editor Money Talks
It’s in his (Political) Genes
As a general rule, the most successful man in life is the man who has the best information”
Japanese Prime Minister Shinzo Abe’s “Abenomics” goal was to end a long miserable decade and a half of deflation by kick starting the economy. This was going to happen because of massive yen creation. The fiat balloon would induce consumers to spend and corporations to reinvest profits, convinced by a rising stock market and surging exports that all is well.
The Bank of Japan pumped liquidity into the economy at a pace even faster than the U.S. Federal Reserve – $60 billion a month versus $85 billion (the U.S. economy is three times larger than Japan’s).
 The flood of fiat did depreciate the yen, over the first six months of 2013 the yen weakened the most against the U.S. dollar since 1982.
The yen also dropped 12 percent against the euro and seven percent against the sterling, threatening European trade.
As Japanese efforts started paying off factory output rose, retail sales slowly started climbing and some inflation came creeping into consumer prices.
 The weaker yen also drew investment away from emerging markets and toward Japanese equities – the Nikkei 225 soared.
“His plan, one of the world’s most audacious experiments in economic policy in recent memory, combines a flood of cheap cash (doubling the money supply in two years), traditional fiscal stimulus and deregulation of Japan’s notoriously ingrown corporate culture. The hope is that this will yank Japan from a debilitating deflationary spiral of lower prices and diminished expectations, stirring what Keynes called the “animal spirits” of investors and consumers.
And so it has. The stock market has soared more than 60 percent over the past year, and the yen has lost more than a quarter of its value, lifting corporate earnings in a country that is dependent on exports.” Martin Fackler, ‘Japan’s New Optimism Has Name: Abenomics’ The New York Times
The Real Deal
Many became convinced that Abenomics was the real deal meal because Japan had five quarters of high growth.
 Unfortunately the wheels seem to be falling off. Japan’s GDP expanded at just an annualized one percent during the last three months of 2013. On a quarter-on-quarter basis that’s just 0.3% growth, the same as during Q3.
The Nikkei 225-stock index has fallen 8.98 percent in the quarter ending March 31, ending a five-quarter winning streak that still has the market up 68.8 percent since November 2012.
Bloomberg says foreign investors sold 975 billion yen ($9.5 billion) of Japanese shares in one week in March, the most since the crash of 1987.
According to Japan’s Ministry of Finance foreign asset managers have pulled more than $21 billion out of the nation’s equities so far in 2014.
Most alarming is that Japanese salaries have dropped 15 percent over the past 15 years and the trend is expected to continue…
“Japanese employers will fail in the next fiscal year to heed Prime Minister Shinzo Abe’s goal of wage increases that outpace inflation, highlighting risks that the nation’s recovery will stall, surveys of economists show.
Labor cash earnings, the benchmark for wages, will increase 0.6 percent in the year starting April 1, according to the median forecast in a poll of 16 economists by Bloomberg News. Consumer prices will climb five times faster, increasing 3 percent, as Japan raises a sales tax for the first time since 1997, a separate Bloomberg survey shows.
The squeeze on consumers from higher prices risks undermining public support for Abenomics and dragging on retail spending.” James Mayger and Cynthia Li, Bloomberg ‘Japan Consumer Prices Seen Rising Five Times as Fast as Wages’
What’s a prime minister to do? Well it’s this authors opinion Abe will continue to print and debase the currency along with adding more fiscal stimulus.
These are the first two arrows in his much talked about three arrow Abenomics quiver. The third arrow, structural reform, has received little attention from the government.
That’s an unfortunate circumstance because for nearly twenty long years demand has remained far below potential supply capacity – what’s known as a deflationary gap. The only sustainable way out for the Japanese economy is for the government to increase growth potential through higher efficiency.
That will be almost impossible because of demographics.
Japan’s most serious problem is demographics, the ageing and shrinking of Japan’s population is a significant demographic drag on growth. Japan’s productive age population (15 – 64 years old) is projected to shrink by roughly 25 percent, some have the figure as high as 40 percent, by 2035.
Today the ratio between working-age people and retirees is roughly 4 to 1, but it will be 2 to 1 in 20 years.
This creates two very obvious problems:
- Many industries will have to be scaled down – an aging society is not one predisposed to increasing consumption nor will the existing workforce be able to keep up the pace in an export dependent economy.
- Controlling social security expenditures in the face of a rapidly aging population is going to be extremely difficult without raising taxes on those still working. And raising taxes will have a hugely negative impact on growth.
Whether you consider Abenomics a success, or not, many experts are questioning its sustainability.
Real term wages are set to drop by two percentage points in 2014. The domestic consumption tax is set to rise from five percent to eight percent this month. These two factors will cause a drop in consumption and a slowdown in economic growth activity.
“The real risk it that the consumption tax will exacerbate the central problem with Abenomics—a blow to household wealth and spending power as price rises accelerate ahead of income.”Tom Orlik, Bloomberg economist in Beijing
A tax increase in 1997 has been credited with kick starting 16 years of economic shrinkage. The government has designed a 5.5 trillion yen stimulus package to counter the expected decline in consumer spending.
Add one part continued currency debasement, drop in two parts of fiscal stimulus, stir a cup or two of worsening demographics into this economic witch’s brew and you’ve got the perfect recipe for Japanese stagflation.
Conclusion
The to do list of structural reforms needed in Japan is a huge mountain to climb:
- Greater international competition
- Higher female labor participation
- Employment deregulation
- Lower energy prices
- Corporate taxation
Whatever fiscal/monetary moves the government makes today will be continually undermined by Japan’s demographics. Structural reforms are necessary now.
Unfortunately while talking a lot about the need for reform the reality on the ground, and in the boardrooms is there’s been precious little actual reform. And this author doesn’t expect much from Abe’s revised ‘third arrow’ plan due in June 2014. The fact is Abe has been weak on reform and that’s not going to change, you see it’s built into his political genes.
Arch-conservatives have long dominated Japan’s politics. They’ve made the Liberal Democratic Party (LDP) their home and have stamped out almost every effort at social reform. The founder of the LDP, and its most important leader was Nobusuke Kishi – Shinzo Abe’s maternal grandfather.
The road to Japanese stagflation is being played out in real time on all our radar screens. It’s playing on mine, is it on yours?
If not, maybe it should be.
Richard (Rick) Mills
About Richard Mills
Richard lives with his family on a 160 acre ranch in northern British Columbia. He invests in the resource and biotechnology/pharmaceutical sectors and is the owner of Aheadoftheherd.com. His articles have been published on over 400 websites, including:
WallStreetJournal, USAToday, NationalPost, Lewrockwell, MontrealGazette, VancouverSun, CBSnews, HuffingtonPost, Beforeitsnews, Londonthenews, Wealthwire, CalgaryHerald, Forbes, Dallasnews, SGTreport, Vantagewire, Indiatimes, Ninemsn, Ibtimes, Businessweek, HongKongHerald, Moneytalks, SeekingAlpha, BusinessInsider, Investing.com and the Association of Mining Analysts.
Please visit www.aheadoftheherd.com
For more information, rick@aheadoftheherd.com
***
Legal Notice / Disclaimer
This document is not and should not be construed as an offer to sell or the solicitation of an offer to purchase or subscribe for any investment.
Richard Mills has based this document on information obtained from sources he believes to be reliable but which has not been independently verified.
Richard Mills makes no guarantee, representation or warranty and accepts no responsibility or liability as to its accuracy or completeness. Expressions of opinion are those of Richard Mills only and are subject to change without notice. Richard Mills assumes no warranty, liability or guarantee for the current relevance, correctness or completeness of any information provided within this Report and will not be held liable for the consequence of reliance upon any opinion or statement contained herein or any omission.
Furthermore, I, Richard Mills, assume no liability for any direct or indirect loss or damage or, in particular, for lost profit, which you may incur as a result of the use and existence of the information provided within this Report.

-
I know Mike is a very solid investor and respect his opinions very much. So if he says pay attention to this or that - I will.
~ Dale G.
-
I've started managing my own investments so view Michael's site as a one-stop shop from which to get information and perspectives.
~ Dave E.
-
Michael offers easy reading, honest, common sense information that anyone can use in a practical manner.
~ der_al.
-
A sane voice in a scrambled investment world.
~ Ed R.
Inside Edge Pro Contributors

Greg Weldon

Josef Schachter

Tyler Bollhorn

Ryan Irvine

Paul Beattie

Martin Straith

Patrick Ceresna

Mark Leibovit

James Thorne

Victor Adair