
Timing & trends
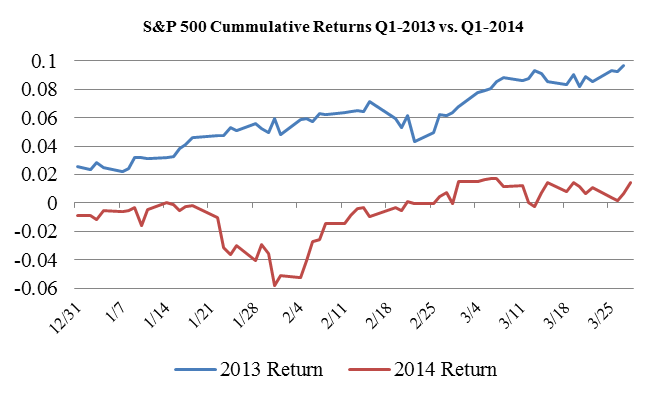
Friday’s US payroll numbers revealed a key milestone for the US labour market. Private employer payrolls surged to 116.09 million positions, a level not surpassed since January of 2008. That confirms two key factors about the economy. One, the US labour market continues on its path of modest gains as more Americans rejoin the labour force each month. Two, the slump through the first quarter of this year was in large part weather related and looks to be short-lived. In essence, this is exactly what the markets have told us as the S&P 500 gained a modest 1.3 per cent in the first quarter of 2014 verses 10.03 percent in the quarter a year prior.
The US labour market however, isn’t on a clear path to prosperity just yet. Population growth alone has seen an increase of 2 million American workers since 2008. And given the budget cuts and trimming of positions at government agencies, private payrolls are yet to pick up the slack created by the public sector. Although its easy to find optimism each month as the broader market shows signs of improving, there are the unavoidable facts that 3.7 million of 10.5 million unemployed Americans have been out of work for 6 months or longer, and 7.4 million Americans are working part time, but would prefer full time hours.
It’s the structural problems of the US economy that continue to exhibit investors’ uncertainty, and that is what is leading to the volatility of these markets. As many leading analysts seemed to suggest, 2014 would be a much more volatile year than 2013, and as the chart indicates, the first quarter of 2014 was rather directionless. Moreover, it was with that forecasted volatility that the market finished the quarter within a per cent of where it started.
The real question going forward this year surrounds what path policy makers, particularly at the US Federal Reserve, but also in Washington, will take. Without doubt accommodative monetary policy has been what directed these markets since 2009. Recent developments at the Fed, however, indicated Janet Yellen’s direction to be slightly unclear as her message has wavered between being hawkish to dovish. Furthermore, one of the leading voices on financial stability, Harvard’s Jeremy Stein resigned his seat as a Fed Governor this week. This is the third vacancy to be filled at the US Fed this year, and certainly opens up the possibility for a more accommodative tone, as it is the Fed Governors that dictate policy as they carry the majority of the votes on Federal Open Market Committee.
To make investors jobs more difficult, Washington kicks into campaign mode for the 2014 mid-term elections, and there are two probable outcomes. One is where Obama continues his lame duck presidency with strong Republican opposition, or a Democrat majority that support his anti-business agenda. Either scenario doesn’t really provide optimism for robust economic growth. Instead, more of the same moderate advances should be expected from the economy.
And this returns us back to the likely scenario of stock market volatility. The Fed has played a role in maintaining a steady hand for their unconditional support for the US economy. That is now being questioned. If the Fed choses to subside their proactive role in providing a predetermined level of assistance, investors may very well lose confidence in these markets, and they shouldn’t expect Washington to fill that void.
…also:

“Subprime Auto Boom Besieged by Late-Payment Jump”
– Bloomberg, March 5
The article included that the lending boom was essentially to car buyers with “spotty” credit history. This has been running for three years and helped push overall car sales to a six-year high. Repeat six years.
Does this remind of creating bajillions of subprime mortgages for house buyers who could not afford the burden.
The rapidly developing problem is that “late-payment” numbers on car loans have accelerated to the highest levels in three years.
“As credit tightens at home, Chinese sell Hong Kong luxury real estate at discounts of up to 20 pct.”
– Reuters, March 19
This shows that suddenly offside players need cash – now!
A couple of weeks ago the Chartworks highlighted the blow-off action in the biotechs (IBB), and the other day this gem was noticed:
“Anyone with a protein under a microscope and a clean suit can go public right now.”
– Business Insider, March 24
“There’s a huge amount of business, both industrial and financial, in both directions between the West and Russia. The further the sanctions go, the greater the pain.”
– Bloomberg, March 18
Quite likely credit deterioration that started in Asia would have visited Russia and the Western Europe without the artifice of sanctions.
……continue reading Bob’s take on the Stock Markets, Currencies, Commodities & Bonds in this 5 page report HERE
……continue reading Bob’s take on the Stock Markets, Currencies, Commodities & Bonds in this 5 page report HERE
Gold and Commodities Supercycle
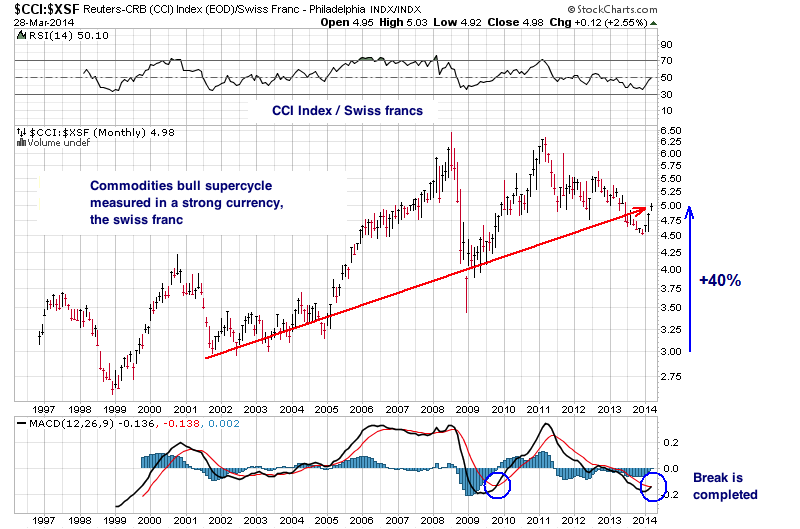
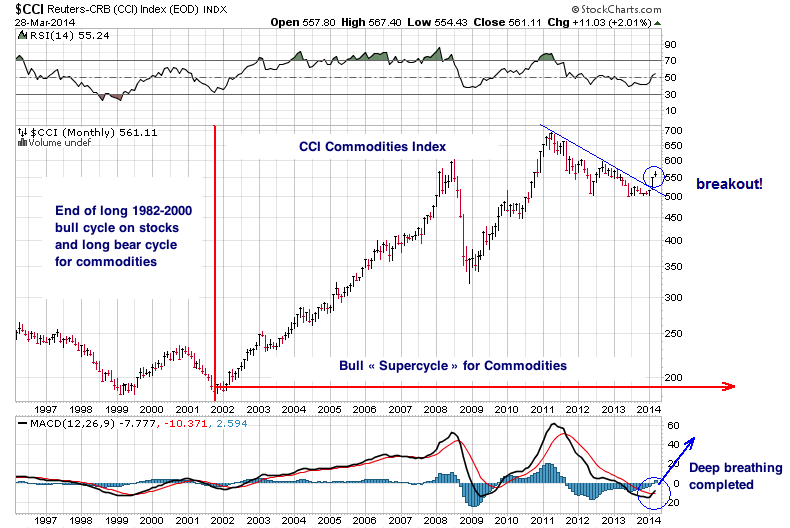
The breakout observed on the CCI commodities index should correspond to another leg in the bear market for the dollar and to another leg in the bull market for commodities that started in 2001 and that can be qualified as a « supercycle ».
During this supercycle, a large part of the rise in prices has to be attributed to the loss of purchasing power of the dollar. To the point, if we measure this bull market in swiss francs, the general rise in prices since 2001 doesn’t exceed 40%, whereas, in dollar terms, prices have already gone up by 200%!
Gold, as an excellent safe haven against the fall of the dollar (and of the other currencies, but mainly the dollar), will perform best (along with silver) for the total duration of this supercycle.
A commodities supercycle can easily last between 15 and 20 years. If we take into account the pressures exerted on commodities by countries such as China and India, world population growth, peak production already reached in several commodities and climactic changes affecting soft commodities production, this supercycle is far from being done!
One thing is certain : The commodities index will not get back to its bull market without gold and silver!
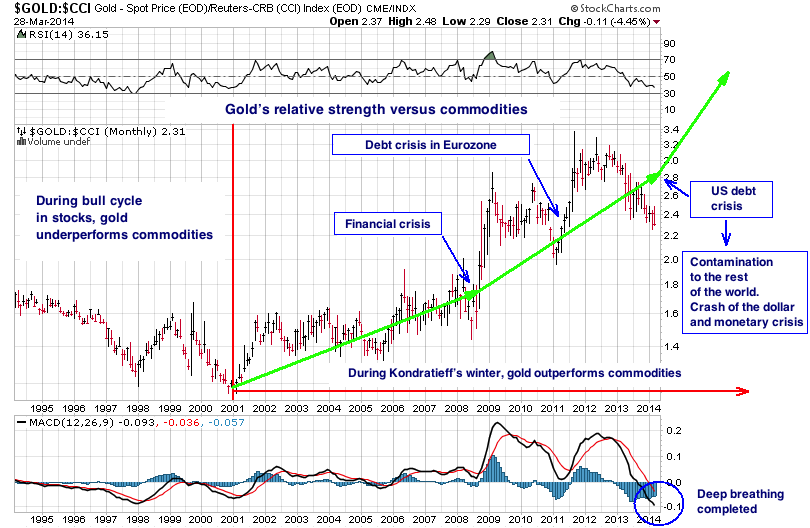
By comparing gold with commodities, we can get the monetary risk premium associated with gold with a gold/CCI ratio, which gives us gold’s relative strength versus all other commodities.
We clearly see that gold started its bull market in all currencies only when it started to emancipate itself from the whole commodities sector, around the Fall of 2005. Up to that time, the monetary risk premium was zero, and the bull market in gold was only seen in dollar terms.
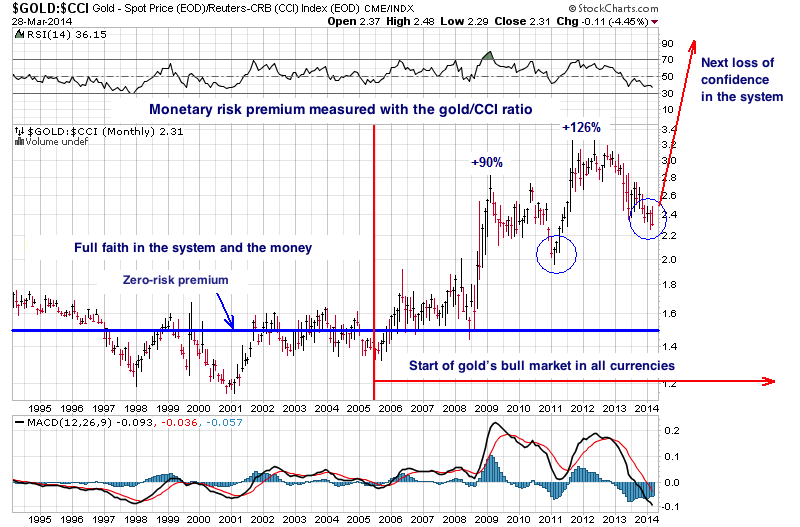
The risk premium went up to 90% with the first financial crisis, in 2008, marked a pause in 2010, and then exploded to 126% with the Eurozone debt crisis.
The current low-risk premium environment is about to end, because the current actions by the Fed will be unkind to the real estate market, the bond market (less and less buyers of U.S. debt = long-term interest rates rising), and to the stock market, in a bubble situation.
It is as if the Fed were walking on very old boxes full of explosives on which the only remaining solid plank was the faith in the system, e.g. this on-going bluff about an economic recovery! The Fed doesn’t have a choice anymore… it is only recharging its rifle to keep a semblance of integrity, but all it can do to fight against the deflationary pressures of this long cycle (Kondratieff’s winter) is to print, print, and print some more.
The next crisis, in all probability, will be a dollar crisis, and it will contaminate the whole of the monetary system, which is already in a competitive devaluation contest. The need for physical gold as a debt extinguisher and a guarantee of stability for currencies will become larger and larger and will most probably lead to the final phase of this supercycle. $1,300 gold will be seen as an aberration in a few years!
Regarding this current test of the 200-day moving average for gold, the breakdown is only 1%, so it is within the margin for tolerance, if we compare today’s golden cross with the one we had in the bull market of 2001, where the breakdown had reached 1.3% (read my preceding analysis). If this test fails, we could still be trading without any clear direction in a sideways range between $1,250 and $1,425 for a few more months, but this will only make the next price retracement move and the monetary risk premium more violent!
About Léonard Sartoni
Léonard Santoni is an independent contributor who often publishes for a Swiss Dealer GoldBroker.com. Léonard has been analysing the gold market since 2003. In 2007, he wrote a book, 2008-2015: Why Gold Will Outperform Stocks and Bonds”
Produced by McIver Wealth Management Consulting Group
Mark Jasayko, CFA,MBA, Portfolio Manager with McIver Wealth Management of Richardson GMP in Vancouver.


- “Too many people know firsthand how devastating it is to lose a job at which you had succeeded and be unable to find another; to run through your savings and even lose your home.” –Janet Yellen, March 31, 2014.
- I’ve predicted that quantitative easing will be replaced with actions taken by the Fed to force commercial banks to increase lending.
- Dr. Yellen could put downwards pressure on interest rates by charging banks a fee to keep reserves with the Fed.
- That policy would force banks to buy longer term Federal government bonds, and to take more risk by making loans to businesses.
- Please click here now . Double-click to enlarge. The technical indicators on this monthly T-bond chart suggest that bonds could soon have a sizable rally. That should create a decent rally in gold.
- At this point in time, Fed tapering clearly isn’t much of a concern to bond market participants. In the longer term, T-bonds are probably forming a large head & shoulders top pattern. What are the implications of that pattern for gold investors?
- Well, a large head and shoulders top pattern doesn’t necessarily mean that America is in a situation like 1979, where interest rates skyrocketed.
- T-bonds could simply decline to the 110 area on that monthly chart, or even towards par (100), without creating significantly higher rates.
- I’ve predicted an uptick in money supply velocity will occur over the next couple of years. That could put enough inflationary pressure on bonds to move the price down to that 100 – 110 target zone. If that happened, a significant stock market correction is likely, but I doubt it would halt the general trend of weak economic recovery.
- A modest uptick in US inflation that creates only modestly higher rates, combined with rising demand for gold in China and India, should produce a consistently higher gold price for years to come. There’s more good news: It’s likely to occur with much less volatility than most gold market participants are accustomed to.
- Please click here now . That’s a shorter term look at US interest rates, using the daily T-bond chart. Bonds are drifting sideways in a loose rectangle formation, against a general fundamental background of Fed tapering.
- In both the short and longer term, the US bond market appears to be quite solid, which is generally supportive for higher gold prices.
- Gold itself has drifted lower over the past couple of weeks, after rising steadily for about two and a half months. From both a technical and fundamental perspective, I see nothing that should be a major concern for precious metals investors.
- On that note, please click here now . That’s the daily chart for gold. Note the position of the Stokeillator (14,7,7 Stochastics series) at the bottom of the chart. The lead line is now at about 8. I’m a light buyer here in the $1285 area, and a bigger buyer near $1270.
- While I believe the gold market is becoming more stable, investors should understand that the Indian election begins on April 7. That’s less than a week away. During Indian elections, citizens can only hold limited amounts of cash. That policy is designed to prevent bribery, but it also means that citizens can’t buy as much gold as they typically do on any given day.
- As a result, gold could just gyrate sideways in a rough range between $1270 – $1320 for a month or so, barring a major geopolitical or US economic event. Once the election is completed, I’m predicting a steady rise in Indian gold demand that will take the price towards $1390, and then up to $1430.
- While most gold analysts focus on the action of the US dollar against the euro as a gold price driver, the rising euro creates only limited US demand for gold. In contrast, a modest fall in the dollar against the Indian rupee can create enormous surges in Indian citizen gold demand. Please click here now . The dollar is clearly breaking down against the rupee, thereby increasing the amount of gold Indians can buy with their rupees. That’s bullish for gold!
- Like gold, the silver market appears to be becoming more stable. Please click here now . I’ve outlined a rough range that is possible for silver during and after the Indian election. To help understand the fundamentals behind my very bullish big picture outlook, please click here now .
- I expect the technological improvements in the Indian silver market to make silver jewellery much more competitive with gold, particularly amongst Western buyers. A rise in silver prices to just the $30 area would produce a 50% gain, for patient investors who can buy some silver now.
- Higher gold prices tend to produce exponentially higher gold stock prices. It’s unlikely that much excitement awaits gold stock investors for another month or so, but a head and shoulders top pattern may be forming on the weekly gold versus GDX ratio chart. That’s bullish for gold stocks, in the big picture.
- To view that key ratio chart, please click here now . Note the collapse in volume, and the disintegration in the RSI indicator. When the Western super-crisis theme dominated all markets, institutional money managers gravitated towards gold bullion more than gold stocks.
- I believe the potential top pattern forming on this chart is consistent with the transition from asset destruction (deflation) to inflation.
- More time is needed to complete the top pattern, but I’m confident that the institutional mindset of “growth with safety” is ending, and an era of “growth with inflation” is close to commencing.
- In April 2013, gold bullion appears to have begun a process of topping out against most gold stocks. I expect the process to be completed in 2014, and hopefully by this summer. From that point, a multi-decade period of general gold stocks outperformance against bullion should begin. When the super-crisis theme was on the front burner, gold market participants had to make very quick decisions that were often uncomfortable. The Western gold community is probably entering an era where gold stock investing is going to be much less stressful, and much more profitable!
Apr 1, 2014
Stewart Thomson
Graceland Updates
website: www.gracelandupdates.com
email for questions: stewart@gracelandupdates.com
email to request the free reports: freereports@gracelandupdates.com
| Tuesday Apr 1, 2014 Special Offer for Money Talks readers: Send an email to freereports@gracelandupdates.comand I’ll send you my free “Short Term Triggers!” report. While gold, silver, and gold stocks offer value at this point in time, investors can get frustrated waiting for a momentum-based move higher to commence. I’ll show you what set-ups I look for in key moving averages and oscillators that suggest upside “blast off time” is here! |

-
I know Mike is a very solid investor and respect his opinions very much. So if he says pay attention to this or that - I will.
~ Dale G.
-
I've started managing my own investments so view Michael's site as a one-stop shop from which to get information and perspectives.
~ Dave E.
-
Michael offers easy reading, honest, common sense information that anyone can use in a practical manner.
~ der_al.
-
A sane voice in a scrambled investment world.
~ Ed R.
Inside Edge Pro Contributors

Greg Weldon

Josef Schachter

Tyler Bollhorn

Ryan Irvine

Paul Beattie

Martin Straith

Patrick Ceresna

Mark Leibovit

James Thorne

Victor Adair