
Timing & trends
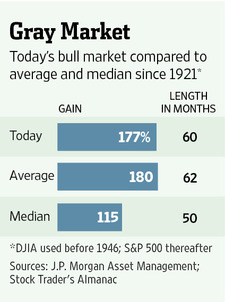
“A five-year anniversary should give pause to anyone who lends much credence to historical patterns. Going back to 1921, the current bull market’s rally is only two percentage points shy of the average performance. And the average bull market has lasted only six weeks longer.”
On Fifth Birthday, Aging Bull Market May Tire Easily
Talk about a lavish birthday gift.
Strategist Sam Stovall of S&P Capital IQ points out that when bull markets reach their fifth anniversary—as the current one will this week—they have historically clocked another 26% gain, on average, if they survived for another year. That would, given today’s level, create up to an additional $5 trillion in U.S. stock-market value.
But the same people who suggest that history might repeat, or at least rhyme, ignore less pleasant parallels. The last time pundits trotted out similar measures was in October 2007 when that bull market turned five. It ended just days later.
Those who suggested the market could rise into 2008 and beyond had convincing arguments. The market’s trailing price/earnings ratio was 16.9 times—actually lower than at the start of that bull run. And stocks had merely doubled from the bottom, a lower increase than in a typical bull market.
Most convincingly, the Federal Reserve had the market’s back. Less than a month earlier, it had reduced rates by half a percentage point. Deeper than expected, that cut catapulted the Dow higher by 336 points on the day.
Trimming half a percentage point seems positively quaint compared with trillions of dollars in quantitative easing recently. But it would be foolhardy to assume that monetary policy has rendered bear markets extinct. And for what it’s worth, the current bull market has seen the S&P 500 rise by 177%. Today’s trailing P/E ratio of 17.9 times, meanwhile, is a full point higher than in October 2007.
In fact, a five-year anniversary should give pause to anyone who lends much credence to historical patterns. Going back to 1921, the current bull market’s rally is only two percentage points shy of the average performance. And the average bull market has lasted only six weeks longer.
Moreover, those averages are skewed higher by the long 1920s and 1990s bull markets, marked by speculative manias and ending in economic crises. One way to factor out those extremes is by focusing on median performance and life span instead. These are 115.4% and 50 months, respectively—leaving the current bull market looking long in the tooth indeed.
This week’s market milestone may lead to plenty more open road. Just remember that dangerous curves are tough to see at such high speeds.
Write to Spencer Jakab at spencer.jakab@wsj.com

 A lot of questions have been coming in regarding what to expect in the markets concerning war. This will be covered at the conferences in detail and it is why we set the time for these events in line with the Panic Cycles in models. We will include the comparison of how even the precious metals reacted completely differently between WWI and WWII as you can see with this chart of silver for WWI where the major Silver Crash followed and it continued to DECLINE during the inflationary boom of the Roaring ’20s. This illustrates my point about the inflation people claim the metals is a hedge against when in fact it has been a hedge against government – not inflation.
This is not a question that can be answered in a brief response. As far as the Global Market Watch forecasting yesterday was the high in Nearest Futures Gold – when it is purely a pattern recognition model – nothing else.
also from Martin:
Putin Orders Troops Back to Bases – Why? Is Yanukovych Dead?
 You didn’t really think that junior miners would languish forever, did you? Junior mining stocks are starting to make a careful climb from the depths after tax-loss selling in December. But some investors, beaten down as badly as mining stocks, are still hesitant. For those investors, Michael Ballanger, director of wealth management and a certified investment manager with Richardson GMP, has a nearly win-win strategy. In this interview with The Gold Report, Ballanger talks about his investment ideas for 2014 and a less-risky twist on the balanced portfolio.
The Gold Report: In retrospect, investors should have been short mining equities and exchange-traded funds (ETFs) in early 2013. You have the opposite view for 2014. Please outline your strategy for us.
Michael Ballanger: The physical bullion silver and gold markets bottomed in the middle of last year and we thought mining shares would catch a bid soon after the physical market turned. As it would turn out, the mining shares hit new lows in December as they were caught in tax-loss selling and rebalancing. That set up a generational buying opportunity.
Additionally, I’ve never seen such black bearish sentiment numbers for gold—and I’ve been in the business 38 years. In contrast, tech darlings like Facebook, Twitter and Netflix are trading at price-to-revenue levels that would take 30 years of optimum performance to come within these valuations. That is an opposite extreme of what’s happening in the metals.
In November, I came up with a strategy for 2014 that is a very conservative equal-weighting basis to short the S&P through the SPDR S&P 500 ETF Trust, but to go long the Market Vectors Gold Miners ETF. It didn’t really matter to me which way the S&P or the markets went—I would see outperformance of the miners.
TGR: And the biggest advantage of that trade is?
MB: It insulates from market risk. It’s a market-neutral strategy in a hyperinflationary spiral where stocks actually do quite well. You can never underestimate the replacement value of stocks in an inflationary spiral. Warren Buffett is a great example: When he got worried about inflation a few years back he bought a big stake in Burlington Northern Santa Fe. Why? Because rails on the ground are a hard asset.
TGR: You suggest there are two ways of controlling the risk in this particular trade. Take us through those.
MB: It goes back to physical bullion. We had a double-bottom at $1,180/ounce ($1,180/oz) on bullion in June and December. That level is the first risk control. If there is a two-day close with gold below $1,180/oz, the double-bottom has aborted and it’s a new down leg for bullion. You’ve got to exit the trade. The second risk control is related to portfolio management risk. Set a stop-loss point of 15%. If you violate that point, you’re gone.
TGR: You’ve been quoted as saying, “I tried several times in 2013 to pick the top via the VIX [volatility index] only to watch in amazement as that invisible hand saves stocks every single time they looked ready to correct.” The Federal Reserve recently lowered its monthly bond-buying program to $65 billion per month. How long can this go on?
MB: I’ve been monitoring investor sentiment numbers in Barron’s magazine since I was a young broker in 1983. If there are four or five weeks where sentiment is above 65% bullish, I’d know it was time to start being conservative, raising cash. Last year, there were six consecutive months ABOVE 70%.
How long do I think this can last? It can last until the market decides that it’s not working anymore, which I believe is going to be 2014.
But the magic hand still continues. It’s called the Plunge Protection Team—the working group on capital markets established under President Ronald Reagan in the 1980s. After the crash of 1987, the government put together a group to prevent market crashes, which is against the free market philosophy that I’ve lived all my life. It has continually—day in, day out—made sure that that market stayed well bid. I have never seen a market that has hugged the 50- and 200-day moving averages with such amazing symmetry as it has 2013. It sets up the trade for January.
TGR: Juniors have performed well in January, a rebound from tax-loss selling season. Is it a seasonal bump or the turn of a corner?
MB: Juniors are turning a corner, but there is also a great seasonal effect. Look at the volume in the Market Vectors Junior Gold Miners ETF for November, December and January, compared to the last 18–24 months. There’s a great expression: Volume precedes price. Those volumes, evidenced by the Market Vectors Junior Gold Miners ETF, are massive. That spells big, sophisticated money entering a trade. This was taking profits out of the blue chips and moving it into the massively depressed miners.
If you ask me where we’re going to be at the end of the year, I think we entered into a new bull market in the junior mining sector in December at tax-loss selling. I think that bull market was artificially delayed by tax-loss selling and year-end portfolio rebalancing. I’m looking for an up for the junior miners—one that could be quite substantial—but one that demands selectivity and discipline.
TGR: What’s your advice on how to navigate the illiquidity of many gold and silver stocks?
MB: Clients that need to maintain liquidity in taking large positions should consider ETFs. They usually won’t have the $0.20 stock that goes to $3 or $4 because the junior mining company that gets included in an ETF is usually one that has already been recognized. Put the bulk of your assets in ETFs and reserve a little capital for one or two specific junior companies. It’s a rifle approach as opposed to a shotgun approach.
TGR: What are some juniors that you’re following?
MB: Rather than “follow” any particular name, for 2014 I have chosen to look at the junior miners in the context of sector versus specific company. And after a three-year, brutal bear market, the greater challenge will be to be proven correct in moving into the sector—period—rather then picking the individual name. Through the Market Vectors Junior Gold Miners ETF you own exposure to a basket of the most-advanced juniors while getting the liquidity of the ETF.
After the three-year bear market, the good guys are coming out of the ashes. You’re going to be surprised how well some of these gold companies perform. Manage your portfolios so you have liquidity and diversification.
TGR: Parting thoughts for us, Michael?
MB: As a wealth manager, my job is balance risk versus reward potential. The most important thing for 2014 is going to be risk management. It’s going to be a rollercoaster year if I’m correct in my assessment. Going long on miners and short on the S&P 500 is an excellent augmentation to the balanced portfolio approach.
TGR: Thanks, Michael. I’ve enjoyed speaking with you today.
Originally trained during the inflationary 1970s, Michael Ballanger, director of wealth management at Richardson GMP, is a graduate of Saint Louis University where he earned a Bachelor of Science in finance and a Bachelor of Art in marketing before completing post-graduate work at the Wharton School of Finance. With more than 30 years of experience as a junior mining and exploration specialist, as well as a solid background in corporate finance, Ballanger’s adherence to the concept of “Hard Assets” allows him to focus the practice on selecting opportunities in the global resource sector with emphasis on the precious metals exploration and development sector. Ballanger takes great pleasure in visiting mineral properties around the globe in the never-ending hunt for early-stage opportunities.
DISCLOSURE:
1) Brian Sylvester conducted this interview for The Gold Report and provides services to The Gold Report as an independent contractor.
2) Streetwise Reports does not accept stock in exchange for its services or as sponsorship payment.
3) Michael Ballanger: I was not paid by Streetwise Reports for participating in this interview. Comments and opinions expressed are my own comments and opinions. I had the opportunity to review the interview for accuracy as of the date of the interview and am responsible for the content of the interview.
4) Interviews are edited for clarity. Streetwise Reports does not make editorial comments or change experts’ statements without their consent.
5) The interview does not constitute investment advice. Each reader is encouraged to consult with his or her individual financial professional and any action a reader takes as a result of information presented here is his or her own responsibility. By opening this page, each reader accepts and agrees to Streetwise Reports’ terms of use and full legal disclaimer.
6) From time to time, Streetwise Reports LLC and its directors, officers, employees or members of their families, as well as persons interviewed for articles and interviews on the site, may have a long or short position in securities mentioned and may make purchases and/or sales of those securities in the open market or otherwise.
Streetwise – The Gold Report is Copyright © 2014 by Streetwise Reports LLC. All rights are reserved. Streetwise Reports LLC hereby grants an unrestricted license to use or disseminate this copyrighted material (i) only in whole (and always including this disclaimer), but (ii) never in part.
Streetwise Reports LLC does not guarantee the accuracy or thoroughness of the information reported.
Streetwise Reports LLC receives a fee from companies that are listed on the home page in the In This Issue section. Their sponsor pages may be considered advertising for the purposes of 18 U.S.C. 1734.
Participating companies provide the logos used in The Gold Report. These logos are trademarks and are the property of the individual companies.

I’ve received so much great feedback from my Feb. 17 question-and-answer column, I’ve decided to do another Q&A issue today.
The mere fact that I’m getting so many mailbag questions in and of itself tells us all that something is brewing out there, big time!
So with that in mind, let’s get started.
Q: The S&P 500 has hit new highs and so has the Nasdaq. So what’s happened to the stock selloff you warned about?
A: Yes, those two indices have hit new record highs, a long-term confirming signal for the long-term bullishness in the equity market. But neither the Dow Industrials nor the Dow Transports have hit new highs, which is a bearish development in the shorter-term.
Keep in mind that unlike important market bottoms, important market tops take time to develop. I suspect there might even be another attempt at new highs in the Industrials before the markets really top out. Cycles point firmly lower heading into the summer.
 Per my warnings, you should already be out of stocks and speculators should consider the short side with futures or inverse ETFs. I repeat the important support levels to watch going forward:
For the DJIA, major support comes into play at the 14,000 to 14,373 level, followed by 13,937 and 13,400.
For the S&P 500, major monthly support is at 1524.50.
Q: Larry, you have been right as rain on your forecast for increasing geo-political conflict. Since you put that forecast out just over a year ago, we’ve seen Egypt blow up, Libya, Yemen, Turkey, Argentina, Venezuela, Thailand and, of course, the latest and most violent, the Ukraine.
A: Yes, it is truly amazing. And we are still at the very beginning of the ramp up in the war cycles. It’s going to get worse, much worse, and it will eventually hit the streets of Europe (again, but in a much more violent fashion) and in the United States.
I was recently invited to speak on the war cycles at the Army and Navy Club in Washington D.C. Not sure if I can make it, but it seems like everyone is now interested in what the war cycles are predicting.
I find the developments in the Ukraine particularly interesting. The Ukraine is a hot-bed for Russian/U.S. and European relations. On the one hand, Putin wants to rebuild the former Soviet Empire’s vast strength and reach, and on the other hand, Europe is trying to hold together the European Union and single currency, while the U.S. of course sides with Europe in the matter.
Could we be on the verge of another cold war? Absolutely. Could the Ukraine end up causing military conflict? Yes, it could.
But at its root, the problem in the Ukraine is due to two forces. One, the corrupt government, and two, the fact that the country was already split along the fault lines of language, with half the country speaking Russian and the other half, Ukraine.
Keep in mind that the war cycles rise all the way to 2020. So, yes, it’s going to get a whole lot worse, and once commodities bottom, the cycles of war will become the number one force that will drive them higher.
Q: Bitcoin is dying, just like you said it would. Is there a way to short it?
A: There is a bitcoin exchange in Hong Kong — the ICBIT derivatives market — but I would not short the currency. With what happened to Mt. Gox recently, where $300 million has gone missing, who knows what your counterparty risk is if you’re short bitcoins on a winning trade. You may never get paid.
I would not buy, sell or trade bitcoins — or any other digital currency, for that matter.
Q: Gold’s rally seems to be fading, no?
A: Yes, it seems to be. There is very tough overhead resistance scaled in from $1,360 to $1,400. A test of $1,360 remains possible but it’s becoming more and more doubtful. Gold remains in a three-year bear trend that has not yet bottomed. Ditto for silver and for mining shares as well.
Q: Grains have had a strong rally. Is their bear market over?
A:The polar freeze interrupted the trend in the grain markets, but it did NOT change it. The trend remains negative and the lows for the agricultural sector have not yet been seen.
Q: When will inflation come back?
A: Not for a while, so don’t listen to all those out there preaching hyperinflation. It’s not going to happen.
The chief reason: The governments of Europe and the United States are engaging in fiscal policies that are sending money into hiding. Raising taxes, confiscatory measures, tracking everything you do, and more. It’s all part of the rise in the cycles of war.
Q: What do you think of Facebook paying $19 billion for WhatsApp?
A: I think it is utterly insane. I think Facebook’s valuation is equally insane.
I believe Facebook is topping as I pen this column and I would not be surprised to see it lose more than half its value over the next few months.
Q: Some are predicting $50,000 gold. Do you agree?
A: Absolutely not. To get to $50,000 gold, the world would have to go back to the dark ages. That is not likely to happen unless the powers-that-be are stupid enough to try and back the world’s monetary system with gold.
Ironically, that would be exceptionally deflationary, and cause a massive global depression that would make the 1930s depression look like a walk in the park.
And there isn’t one single government on the planet that would want to back its money with gold, China included.
Gold can and will get to $5,000. Maybe even $7,500. But $50,000? No, that’s the stuff of crackpots and conspiracy theorists and nothing more.
Best wishes and stay tuned,
Larry
Posted by Larry Edelson
 Ubiquity, Complexity Theory, and Sandpiles
Fingers of Instability
A Stable Disequilibrium
General Equilibrium with Endogenous Uncertainty
John is in Florida and feeling a bit under the weather, so this week we’re bringing back one of his most popular letters, from December 2007. In the letter he discusses the work of Professor Graciela Chichilnisky of Columbia University, one of whose key insights is that the greater the number of connections within an economic network, the more the system is at risk. Given the current macroeconomic environment, it is important to remind ourselves of how complacent we were back in 2007 and how it all fell apart so quickly, just as John outlined in this rather prescient piece.
This is a theme to which John has returned again and again, pointing out that reforms such as Dodd-Frank (the Dodd–Frank Wall Street Reform and Consumer Protection Act of 2010) fell well short of solving the problem of excessive interconnectedness among global financial players. It shored up the big “sandpile” rather than breaking it up into smaller, more manageable sandpiles. Now, if the Chinese, Japanese, and/or European sides of the sandpile should avalanche, the whole US side is likely to go, too.
John will be back next week with a report from Washington DC and the next installment of his series on income inequality.
How does the risk of default in California or Thailand get spread throughout the world, causing problem in money market funds in Europe and Florida? Yes, we can trace the linkages now, but was it possible to predict the crisis beforehand? And can we use what we learn to predict and hopefully hedge ourselves from the next crisis? Why do these things seem to be happening with more frequency? This week we are going to look at some economic theories that will give us some insight into the above questions. As it turns out, the more that individuals hedge their risk in economic markets – the larger and more interconnected the network – the more the entire system is put at risk. There is a lot of ground to cover, so we will jump right in.
Before we get to the economic theory, let’s review part of a letter I wrote in April of 2006 discussing chaos theory, as it will give us a useful mind picture to understand the latter part of the letter. This was part of a letter in which I laid out my thought that we would indeed experience a future crisis along the lines we are now seeing.
We are going to start our explorations with excerpts from a very important book by Mark Buchanan called Ubiquity, Why Catastrophes Happen. I HIGHLY recommend it to those of you who, like me, are trying to understand the complexity of the markets. Not directly about investing, although he touches on it, it is about chaos theory, complexity theory, and critical states. It is written in a manner any layman can understand. There are no equations, just easy-to-grasp, well-written stories and analogies.
We have all had the fun as kids of going to the beach and playing in the sand. Remember taking your plastic bucket and making sand piles? Slowly pouring the sand into ever bigger piles, until one side of the pile started an avalanche?
Imagine, Buchanan says, dropping one grain of sand after another onto a table. A pile soon develops. Eventually, just one grain starts an avalanche. Most of the time it’s a small one, but sometimes it builds up and it seems like one whole side of the pile slides down to the bottom.
Well, in 1987 three physicists, named Per Bak, Chao Tang and Kurt Weisenfeld, began to play the sandpile game in their lab at Brookhaven National Laboratory in New York. Now, actually piling up one grain of sand at a time is a slow process, so they wrote a computer program to do it. Not as much fun but a whole lot faster. Not that they really cared about sandpiles. They were more interested in what are called nonequilibrium systems.
They learned some interesting things. What is the typical size of an avalanche? After a huge number of tests with millions of grains of sounds, they found out that there is no typical number: “Some involved a single grain; others, ten, a hundred or a thousand. Still others were pile-wide cataclysms involving millions that brought nearly the whole mountain down. At any time, literally anything, it seemed, might be just about to occur.”
The pile was indeed completely chaotic in its unpredictability. Now, let’s read this next paragraph slowly. It is important, as it creates a mental image that helps me understand the organization of the financial markets and the world economy. (emphasis mine)
To find out why [such unpredictability] should show up in their sandpile game, Bak and colleagues next played a trick with their computer. Imagine peering down on the pile from above, and coloring it in according to its steepness. Where it is relatively flat and stable, color it green; where steep and, in avalanche terms, “ready to go,” color it red. What do you see? They found that at the outset the pile looked mostly green, but that, as the pile grew, the green became infiltrated with ever more red. With more grains, the scattering of red danger spots grew until a dense skeleton of instability ran through the pile. Here then was a clue to its peculiar behavior: a grain falling on a red spot can, by domino-like action, cause sliding at other nearby red spots. If the red network was sparse, and all trouble spots were well isolated one from the other, then a single grain could have only limited repercussions. But when the red spots come to riddle the pile, the consequences of the next grain become fiendishly unpredictable. It might trigger only a few tumblings, or it might instead set off a cataclysmic chain reaction involving millions. The sandpile seemed to have configured itself into a hypersensitive and peculiarly unstable condition in which the next falling grain could trigger a response of any size whatsoever.
Something only a math nerd could love? Scientists refer to this as a critical state. The termcritical state can mean the point at which water would go to ice or steam, or the moment that critical mass induces a nuclear reaction, etc. It is the point at which something triggers a change in the basic nature or character of the object or group. Thus, (and very casually, for all you physicists) we refer to something being in a critical state (or us the term critical mass) when there is the opportunity for significant change.
But to physicists, [the critical state] has always been seen as a kind of theoretical freak and sideshow, a devilishly unstable and unusual condition that arises only under the most exceptional circumstances [in highly controlled experiments]…. In the sandpile game, however, a critical state seemed to arise naturally through the mindless sprinkling of grains.
Thus, they asked themselves, could this phenomena show up elsewhere? In the earth’s crust, triggering earthquakes; in wholesale changes in an ecosystem; or in a stock market crash? “Could the special organization of the critical state explain why the world at large seems so susceptible to unpredictable upheavals?” Buchanan asks. Could it help us understand not just earthquakes but why a cartoon in a third-rate paper in Denmark could cause worldwide riots?
Buchanan concludes in his opening chapter:
There are many subtleties and twists in the story … but the basic message, roughly speaking, is simple: The peculiar and exceptionally unstable organization of the critical state does indeed seem to be ubiquitous in our world. Researchers in the past few years have found its mathematical fingerprints in the workings of all the upheavals I’ve mentioned so far [earthquakes, eco-disasters, market crashes], as well as in the spreading of epidemics, the flaring of traffic jams, the patterns by which instructions trickle down from managers to workers in the office, and in many other things. At the heart of our story, then, lies the discovery that networks of things of all kinds – atoms, molecules, species, people, and even ideas – have a marked tendency to organize themselves along similar lines. On the basis of this insight, scientists are finally beginning to fathom what lies behind tumultuous events of all sorts, and to see patterns at work where they have never seen them before.
Now, let’s think about this for a moment. Going back to the sandpile game, you find that as you double the number of grains of sand involved in an avalanche, the likelihood of an avalanche becomes 2.14 times as unlikely. We find something similar in earthquakes. In terms of energy, the data indicate that quakes become four times less likely each time you double the energy they release. Mathematicians refer to this as a “power law,” or a special mathematical pattern that stands out in contrast to the overall complexity of the earthquake process.
Fingers of Instability
So what happens in our game?
[A]fter the pile evolves into a critical state, many grains rest just on the verge of tumbling, and these grains link up into “fingers of instability” of all possible lengths. While many are short, others slice through the pile from one end to the other. So the chain reaction triggered by a single grain might lead to an avalanche of any size whatsoever, depending on whether that grain fell on a short, intermediate or long finger of instability.
Now we come to a critical point in our discussion of the critical state. Again, read this with the markets in mind (again, emphasis mine):
In this simplified setting of the sandpile, the power law also points to something else: the surprising conclusion that even the greatest of events have no special or exceptional causes. After all, every avalanche large or small starts out the same way, when a single grain falls and makes the pile just slightly too steep at one point. What makes one avalanche much larger than another has nothing to do with its original cause, and nothing to do with some special situation in the pile just before it starts. Rather, it has to do with the perpetually unstable organization of the critical state, which makes it always possible for the next grain to trigger an avalanche of any size.
Now, let’s couple this idea with a few other concepts. First, economist Dr. Hyman Minsky points out that stability leads to instability. The more comfortable we get with a given condition or trend, the longer it will persist and then when the trend fails, the more dramatic the correction. The problem with long-term macroeconomic stability is that it tends to produce unstable financial arrangements. If we believe that tomorrow and next year will be the same as last week and last year, we are more willing to add debt or postpone savings in favor of current consumption. Thus, says Minsky, the longer the period of stability, the higher the potential risk for even greater instability when market participants must change their behavior.
Relating this to our sandpile, the longer a critical state builds up in an economy – or in other words, the more “fingers of instability” that are allowed to develop a connection to other fingers of instability – the greater the potential for a serious “avalanche.”
A second related concept is from game theory. The Nash equilibrium (named after John Nash) is a kind of optimal strategy for games involving two or more players, whereby the players reach an outcome to mutual advantage. If there is a set of strategies for a game with the property that no player can benefit by changing his strategy while the other players keep their strategies unchanged, then that set of strategies and the corresponding payoffs constitute a Nash equilibrium.
A Stable Disequilibrium
So we end up in a critical state of what Paul McCulley calls a “stable disequilibrium.” We have “players” of this game from all over the world tied inextricably together in a vast dance through investment, debt, derivatives, trade, globalization, international business and finance. Each player works hard to maximize their personal outcome and to reduce their exposure to “fingers of instability.”
But the longer the game runs, asserts Minsky, the more likely it is to end in a violent “avalanche,” as the the fingers of instability have more time to build, until the state of stable disequilibrium goes critical on us.
Go back to 1997. Thailand began to experience trouble. The debt explosion in Asia began to unravel. Russia was defaulting on its bonds. (Astounding. Was it less than ten years ago? Now Russian is awash in capital. Who could have anticipated such a dramatic turn of events?) Things on the periphery, small fingers of instability, began to impinge on fault lines in the major world economies.
Something that had not been seen before happened. The historically sound and logical relationship between 29- and 30-year bonds broke down. Then country after country suddenly and inexplicably saw that relationship in their bonds begin to correlate, an unheard-of event. A diversified pool of debt was suddenly no longer diversified. The fingers of instability reached into Long Term Capital Management and nearly brought the financial world to its knees.
And now a different set of fingers of instability are creating an even worse crisis in the credit markets. How do we explain this?
General Equilibrium with Endogenous Uncertainty
In a paper in the August 2006 Journal of Mathematical Economics entitled “General Equilibrium with Endogenous Uncertainty and Default,” written by Prof. Graciela Chichilnisky of Columbia University and Ho-Mou Wu of the University of Taiwan, the authors demonstrate with some very serious mathematical proofs that the more of a given type of asset (say insurance or a derivative) is introduced into a market, while the risks that individuals face may be reduced, overall systemic risks increase.
I recently had the chance to discuss this paper and some related work with Dr. Chichilnisky. The following are insights I picked up from our conversations.
Chichilnisky created the term and theory of “endogenous uncertainty” about 12 years ago. That is the uncertainty that derives from risks that we ourselves create – rather than risks that come from exogenous (outside) events. (The standard theory of risk management only considers risks that are outside events that we have no part in creating.) Thus these are risks that we humans create through our own actions, rather than risks that come from nature. The more the economy is globalized, the larger is human impact globally and the more frequently we encounter such risks. Now, let’s turn to the paper. (I should note that Chichilnisky was one of the creators of the carbon credit markets and is quite involved in the next phase of the Kyoto protocols. This is one very bright lady, with doctorates in both mathematics and economics.)
First, the paper demonstrates that the greater the number of connections within a given economic network, the greater the systemic risk. This is counterintuitive, but a simplified illustration may help.
Let’s say I own a $10 million corporate bond from Big Automotive Company (BAC) in my portfolio and it pays 7%. I can go into the market and purchase a credit default swap (CDS) for (say) 2% of the face value of the bond from a large investment bank (LIB). Now I am getting a net return of 5%, but my risk is greatly reduced. LIB has insured my risk. Now LIB has a liability of $10 million on its books, which of course reduces its capital. So LIB, clever folks that they are, buy another CDS from someone else on the same bond for 1%, and thus their books are even. They own both a put and a call on $10 million in BAC bonds, so they take no hit to their capital structure. However, they do make a neat $100,000 (the difference in the buy and sell prices) for making a market in BAC credit insurance.
Now, there are hundreds of investment banks and hedge funds making markets in all sorts of credit markets, buying and selling these derivatives to thousands of various investors and funds. It is quite possible that the CDS I bought was reshuffled a few times, so that we could have five or ten times the face amount of my bond in the form of derivatives. I have seen reports that the total amount of CDs written on General Motors bonds is ten times the actual value of the bonds.
Why would this be? If a hedge fund or investment bank thinks that default insurance on General Motors is too expensive relative to the risk, they can sell the CDS and hope to make a profit when the cost of insurance goes down. This provides liquidity to the market, but it also creates a lot of connections among unrelated parties. By that I mean that I am exposed to the default risk of all the counterparties of the firm that sold me the original insurance.
How, you might ask. Because if one of LIB’s creditors defaults, that reduces the capital of LIB. Let’s say that all $10 billion of Big Automotive Company’s debt goes bad. I call up LIB and ask for my $10 million. “Not a problem,” they say, “we’ll call the person who sold us the protection, who will call the person from whom they bought protection, until we find someone who is ‘naked long’ BAC debt. Then they will pay up. Or we can hope they do.”
But if there are several debt events that happen at once, as does generally happen in a business downturn, there will be funds or banks that may not have enough capital. Why? Because banks and funds do not have to set aside reserve capital for potential losses and can leverage their exposure a great deal. Technically, they are safe, as the assets and liabilities on their books should match. But those assets are only as good as the counterparties that guarantee them.
Thus, we create potential fingers of instability with every new derivative we sell or buy, as we get connected to market players we have never heard of. Let’s read the following paragraph from the introduction to the Chichilnisky paper:
Markets can magnify risk. As new assets [like CDS] are introduced, a creditor who is a victim of default in one transaction is unable to deliver in another, thereby causing default elsewhere. In this manner default by one individual leads, through a web of obligations, to a large number of defaults. Since new instruments create new webs of obligations, financial innovation is the precipitating factor. The transmission of default from one trader to another and from one market to another transmits individual risk and magnifies it into collective risk. Default by one individual leads to a collective risk of widespread default.
And that is what we have seen in the subprime market. We have taken the risk of a mortgage in California and spread it literally around the world. Now one default or a thousand is no big deal. Those defaults are priced into the bonds. But when we introduce extra risk by inserting mortgages that have little economic rationale behind them (or that are outright fraudulent, as more evidence mounts daily of massively fraudulent activities), then we change the equation of potential systemic risk.
So far, the credit defaults are being handled by the system. That is, banks are writing off large amounts of debt, and I would expect there to be more major write-offs. Soon we will hear of insurance companies that have to take write-downs from their subprime exposure. We have seen several German banks go completely under. A money market pool of various Florida governmental entities (cities, counties, schools) will probably have to take some write-offs. The losses will be spread out and will cause some pain here and there in Florida, but it is highly unlikely that serious damage will be done to any single entity.
In fact, let me sound a note of optimism. The ever-growing estimates of losses due to subprime may be overstated. According to a study by Goldman Sachs, the ABX indexes suggest about $400 billion in losses. But a $150-billion-dollar chunk of that is from AAA-rated bonds. They have been marked down an average of 18%. But in order for the AAA tranches to lose money, 50% of the mortgages in the securities would have to go into foreclosure, and those homes would have to drop 50% in value.
Why the drop in value? Because while some Residential Mortgage-Backed Securities will more than likely face such a serious loss, others are unlikely to see anywhere close to a 50% foreclosure rate. The problem is that investors cannot figure out which RMBSs are in trouble and which would be good bets. Until there is transparency, it is likely that prices will stay low.
As an aside, if the Bush plan to help out those who cannot make payments because of mortgage resets keeps the market from finding out the true nature of the underlying assets in these RMBSs, then that is not a good thing. The devil is in the details.
My thinking is that sometime next year the credit markets start to function, and people will think that things are back to normal. New securitizations and guarantees will be found to allow the placement of debts of all types. We will never face a subprime problem again, as rules will be put in place to avoid such a crisis. The market, like an old general, is pretty good at fighting the last war.
But that does not mean that all will be well. Another conclusion of the Chichilnisky paper is that the more we create new financial instruments, the more likely it is we will have systemic problems. And since we are creating them at an ever faster pace, and tying more and more market players together, we are sowing the seeds of another Black Swan event that will crop up somewhere, leading to yet another crisis.
Does that mean we should stop the train? No, but it does mean that we should be aware of what we are doing. Let’s read one last paragraph from the paper:
The other implication of our results is that they help to formalize a “multiplier effect” for policy. In a complex economy, financial policies which succeed in preventing default by one agent also prevent, by a chain reaction, a large number of other defaults at no additional cost. Therefore the benefits have a “multiplier effect.” Our results provide support for the policy of requiring reserves to enhance financial stability.
I think the next crisis could come from the credit default swaps market. Remember, this is a market that essentially has no reserves to deal with default risk other than the capital accounts of the banks and hedge funds involved. A worst-case scenario would be for the economy to fall into a serious recession next year, which would hammer high-yield bonds and cause defaults in certain riskier debt, for which CDSs have been bought and sold. With banks having to write down a lot of the mortgage-related debt, they would be in a poor position to handle even greater losses.
The far more likely scenario is that we have a mild recession or slowdown, and banks shore up their balance sheets and can deal with a problem in the CDS markets when it happens – or with another, still hidden black swan of endogenous uncertainty. It would behoove regulators and market participants to figure out how to create an exchange-type mechanism with a central clearing house like that of the Chicago Board of Trade or NYMEX, guaranteeing the CDSs, and thereby reduce the potential for a highly leveraged systemic problem. Bank regulators should ask whether reserves should be held even for positions that are offset. Yes, that would eat into profits, but I think it is better than the losses that could accrue in another crisis.
But the point is that within a few years there will be yet another crisis. The research shows that by connecting ever more participants together in the global network, we practically guarantee another crisis of some kind.
So, what do you do? Pull in your cash and stick it under the mattress? Of course not. Truly diversify your portfolio, use as many hedging possibilities as you can, and learn to love the volatility. Make it your friend rather than fight it. Pay more attention to markets where there is irrational behavior. It was easy to discern that there were potential problems in the subprime market a year ago. If you were reading me, you should have checked your portfolio to see if you had exposure and then eliminated it.
These things don’t just happen. We live in a world with “endogenous uncertainty and default.” In the future, when you see a problem starting to develop in one part of the world, think about how that problem area is connected to the rest of other world. I know I will.
John Mauldin
subscribers@MauldinEconomics.com
See for yourself why over 1 million investors and financial professionals turn to John Mauldin and the Mauldin Economics’ team every week for economic insight. Sign up for FREE HERE

-
I know Mike is a very solid investor and respect his opinions very much. So if he says pay attention to this or that - I will.
~ Dale G.
-
I've started managing my own investments so view Michael's site as a one-stop shop from which to get information and perspectives.
~ Dave E.
-
Michael offers easy reading, honest, common sense information that anyone can use in a practical manner.
~ der_al.
-
A sane voice in a scrambled investment world.
~ Ed R.
Inside Edge Pro Contributors

Greg Weldon

Josef Schachter

Tyler Bollhorn

Ryan Irvine

Paul Beattie

Martin Straith

Patrick Ceresna

Mark Leibovit

James Thorne

Victor Adair