
Timing & trends
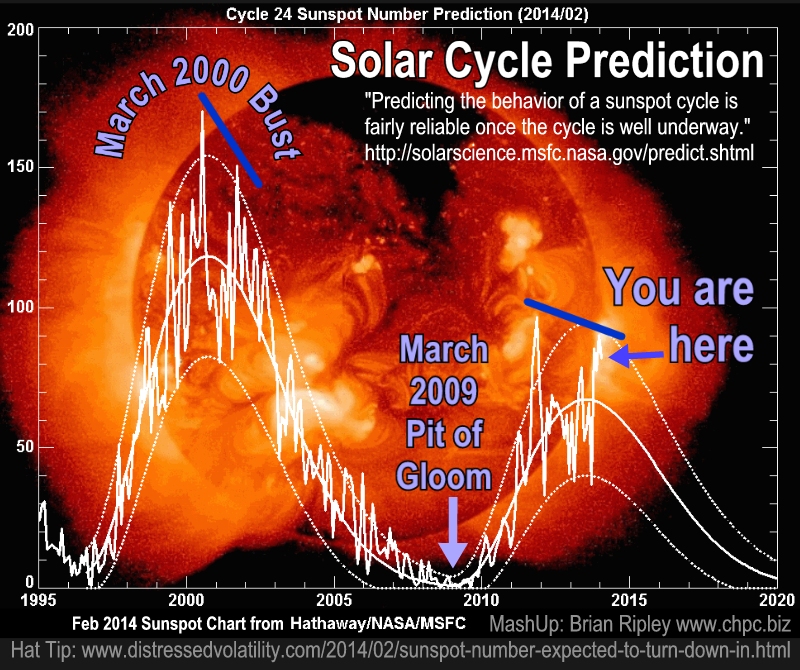
“Predicting the behavior of a sunspot cycle is fairly reliable once the cycle is well underway.” MSFC-NASA
“My opinion is that we are heading into a Maunder Minimum,” saidMark Giampapa, a solar physicist at the National Solar Observatory (NSO) in Tucson, Arizona. “I’m seeing a continuation in the decline of the sunspots’ mean magnetic field strengths and a weakening of the polar magnetic fields and subsurface flows.”
Meanwhile a sudden flight to lower yields via up ticking CPI and global equity valuation fear. Notice the TSX Real Estate index has been in a trading range since the summer of 2012 and has failed to break through the spring 2013 top. It’s similar to the Canadian real 10 year yield and if that plunges with more CAD dollar sell off, we will probably see more unwillingness to subsidize equity positions, and real estate appraisers (and margin clerks) will become busy again. DIY here.

…more articles HERE


- Canada’s Ivey PMI jumped to 53.6 points in January, from 40.2 points in December, according to data released today by the Richard Ivey School of Business.
Ivey PMI s.a. grew to 56.8 points in January, from 46.3 points the previous month and above expectations of a rise to 51.0.Prior reading was 46.3
A rare slice of good news for the loonie. USD/CAD down a dozen pips on the headline.

Applications for U.S. unemployment benefits fell for the first time in three weeks as employers retained workers to meet demand.
Jobless claims dropped by 20,000 to 331,000 in the period ended Feb. 1, the Labor Department reported today in Washington. The median forecast of economists surveyed by Bloomberg called for a decrease to 335,000.
The decline in dismissals shows employers are confident demand for goods and services will hold up at the same time fiscal restraints ease. A pickup in the pace of hiring and wage growth would help fuel bigger gains in theconsumer spending that accounts for almost 70 percent of the economy.
…full article HERE
Lost among all the bullish predictions for the 2014 market outlook is a salient fact that few Wall Street analysts are aware of. What they fail to realize is that the powerful 40-year cycle bottoms later this year.
Just how powerful is the 40-year cycle? Well consider that in the previous 120 years the 40-year cycle bottom has never failed to produce a major market decline. From the decline in late 1894 to the corrective pullback of 1934 to the devastating decline of 1974, the 40-year cycle has always made its presence felt in the stock market.
It’s worth examining the 40-year cycle since its influence is already being felt as we enter the first month of the new year. The Kress 40-year cycle belongs to the category of yearly cycles of the first magnitude and is described by Mr. Kress as the Primary Bias Cycle for equities. The 40-year cycle is arguably the most powerful of the long-term cycles which composite the Grand Super Cycle of 120 years.
The 40-year cycle is also harmonic of the 20-year cycle and bottoms along with the 20-year cycle every fourth decade. The most recent 40-year cycle bottom at the time of this writing was in October 1974 while the most recent peak of the 40-year cycle occurred in October 1994. The next 40-year cycle bottom is scheduled for late September 2014, which coincides with the final low of the latest Kress 120-year Grand Super Cycle.
The 40-year cycle has special significance in that it can be divided by the Fibonacci number five as well as the Fibonacci number eight. The 40-year cycle is the product of eight fives (8 x 5 = 40), with five being the number of dominance according to Kress. Accordingly there are five 8-year cycles within a complete 40-year cycle.
[Hear More: Jim Puplava’s Big Picture: The Great Rotations]
This brings us to the next aspect of 2014 worth mentioning, namely that the 8-year cycle is scheduled to bottom later this year. Keep in mind that nearly every previous 8-year cycle bottom year was an extremely rocky one for stocks. The 8-year cycle bottom years of 1998 and 1990 certainly come to mind. This is the cycle which is most likely to witness trouble in the financial sector.
The 8-year cycle that bottomed in October 1998 was a powerful one, and before the cycle put in its final bottom it was quite nearly disastrous to the U.S. and global financial markets. It was one of the catalysts, or at least had a negative impact, upon the notorious Long Term Capital Management Group (LTCM) meltdown, a Russian hedge fund, which figured prominently in the troubled headlines of the summer and fall of 1998. Concurrently, a crisis in the Russian ruble along with a currency crises in Argentina and Brazil and a commodity market breakdown made it seem as if the entire world’s financial system was on the brink of collapse. The following graph shows how sudden and severe was the final bottoming phase of the 8-year cycle that year.

The previous 8-year cycle bottom was in 1990, a year that was bad for stocks and for bank stocks in particular. The Savings & Loan (S&L) crisis was at its worse at that time and a large number of savings institutions became insolvent that year. Indisputably, the 8-year cycle bottom made its impact known to investors in 1990.
Prior to 1990 the 8-year cycle bottomed in 1982, which marked the formal end of a 14-year bear market for stocks. The great secular bull market of 1982-2000 was heralded by the 8-year cycle bottom of ’82.
In view of the two important long-term cycles bottoming this year, perhaps it’s no coincidence that we’re witnessing a revival of emerging market troubles. Argentina is faced with the specter of default while Brazil’s currency is under pressure. A potential debt crisis brewing in China has the potential to roil global markets on a scale not seen since 2008. The Emerging Markets ETF (EEM) chart shown below throws into relief the extent to which these countries are being roiled by the final “hard down” phase of the 40-year cycle.

As economists have already discovered, an increase in deflationary pressure is possible further into 2014, which in turn could increase financial market volatility. Accordingly, investors should be prepared for anything and should remain leery of the unfettered optimism of Wall Street’s legions of ultra-bullish pundits.
Kress Cycles
Cycle analysis is essential to successful long-term financial planning. While stock selection begins with fundamental analysis and technical analysis is crucial for short-term market timing, cycles provide the context for the market’s intermediate- and longer-term trends.
While cycles are important, having the right set of cycles is absolutely critical to an investor’s success. They can make all the difference between a winning year and a losing one. One of the best cycle methods for capturing stock market turning points is the set of weekly and yearly rhythms known as the Kress cycles. This series of weekly cycles has been used with excellent long-term results for over 20 years after having been perfected by the late Samuel J. Kress.
In my latest book “Kress Cycles,” the third and final installment in the series, I explain the weekly cycles which are paramount to understanding Kress cycle methodology. Never before have the weekly cycles been revealed which Mr. Kress himself used to great effect in trading the SPX and OEX.
If you have ever wanted to learn the Kress cycles in their entirety, now is your chance. The book is now available for sale at:
http://www.clifdroke.com/books/kresscycles.html
Order today to receive your autographed copy along with a free booklet on the best strategies for momentum trading. Also receive a FREE 1-month trial subscription to the Momentum Strategies Report newsletter.
Clif Droke is a recognized authority on Kress cycles and internal momentum, two valuable tools which have enabled him to call most major stock market turning points from 1997 through the present. He is the editor of the Momentum Strategies Report newsletter, published three times a week since 1997. He has also authored numerous top-selling books, including his most recent one, “Kress Cycles.” For more information visit clifdroke.com
Todd Market Forecast for Wednesday February 5, 2014
Available Mon- Friday after 6:00 P.M. Eastern, 3:00 Pacific.
DOW -5 on 550 net declines
NASDAQ COMP -20 on 1050 net declines
SHORT TERM TREND Bearish
INTERMEDIATE TERM TREND Bearish
STOCKS: The market is trying to stabilize. It’s too soon to see if it will be successful. It’s our opinion that short term rallies notwithstanding, the market has lower to go.
But, some indicators are significantly oversold. Check the chart out below.
GOLD: Gold was up $6.
CHART

TORONTO EXCHANGE: Toronto was up 55.
S&P\TSX Venture Comp: The Venture Comp gave back 5.
BONDS: Bonds were down sharply.
THE REST: The dollar was lower. Silver, crude oil and copper were higher again.
BOTTOM LINE:
Our intermediate term systems are on a sell signal as of January 13.
System 7 We are in cash. Stay there on Wednesday.
System 8 We bought the SSO at 91.60. Sell at Thursday’s close if there are more declining issues than advancing ones at 3:45 EST.
NEWS AND FUNDAMENTALS:
The ADP employment report showed an increase of 175.,000 private sector jobs. The ISM non mfg. number came in at 54.0, better than the expected 53.9. On Thursday we get the trade deficit and jobless claims.
…………..
We’re moving back to a sell for bonds as of today February 5.
We’re on a buy on the dollar and a sell for the euro as of December 19.
We’re on a buy for gold as of January 23.
We’re on a buy for silver as of December 10.
We’re on a buy for crude oil as of January 15.
We’re on a sell for copper as of January 9.
We’re on a buy for the Toronto Stock Exchange as of today December 26.
We’re on a buy for the S&P\TSX Venture Comp. as of December 31.
|
We are long term bullish for all major world markets, including those of the U.S., Britain, Canada, Germany, France and Japan. |
To subscribe online: go HERE

INDICATOR PARAMETERS
Monetary conditions (+2 means the Fed is actively dropping rates; +1 means a bias toward easing. 0 means neutral, -1 means a bias toward tightening, -2 means actively raising rates). RSI (30 or below is oversold, 80 or above is overbought). McClellan Oscillator ( minus 100 is oversold. Plus 100 is overbought). Composite Gauge (5 or below is negative, 13 or above is positive). Composite Gauge five day m.a. (8.0 or below is overbought. 13.0 or above is oversold). CBOE Put Call Ratio ( Below .80 is a negative. Above 1.00 is a positive). Volatility Index, VIX (low teens bearish, high twenties bullish), VIX % single day change. + 5 or greater bullish. -5 or less, bearish. VIX % change 5 day m.a. +3.0 or above bullish, -3.0 or below, bearish. Advances minus declines three day m.a.( +500 is bearish. – 500 is bullish). Supply Demand 5 day m.a. (.45 or below is a positive. .80 or above is a negative).
No guarantees are made. Traders can and do lose money. The publisher may take positions in recommended securities.

-
I know Mike is a very solid investor and respect his opinions very much. So if he says pay attention to this or that - I will.
~ Dale G.
-
I've started managing my own investments so view Michael's site as a one-stop shop from which to get information and perspectives.
~ Dave E.
-
Michael offers easy reading, honest, common sense information that anyone can use in a practical manner.
~ der_al.
-
A sane voice in a scrambled investment world.
~ Ed R.
Inside Edge Pro Contributors

Greg Weldon

Josef Schachter

Tyler Bollhorn

Ryan Irvine

Paul Beattie

Martin Straith

Patrick Ceresna

Mark Leibovit

James Thorne

Victor Adair