
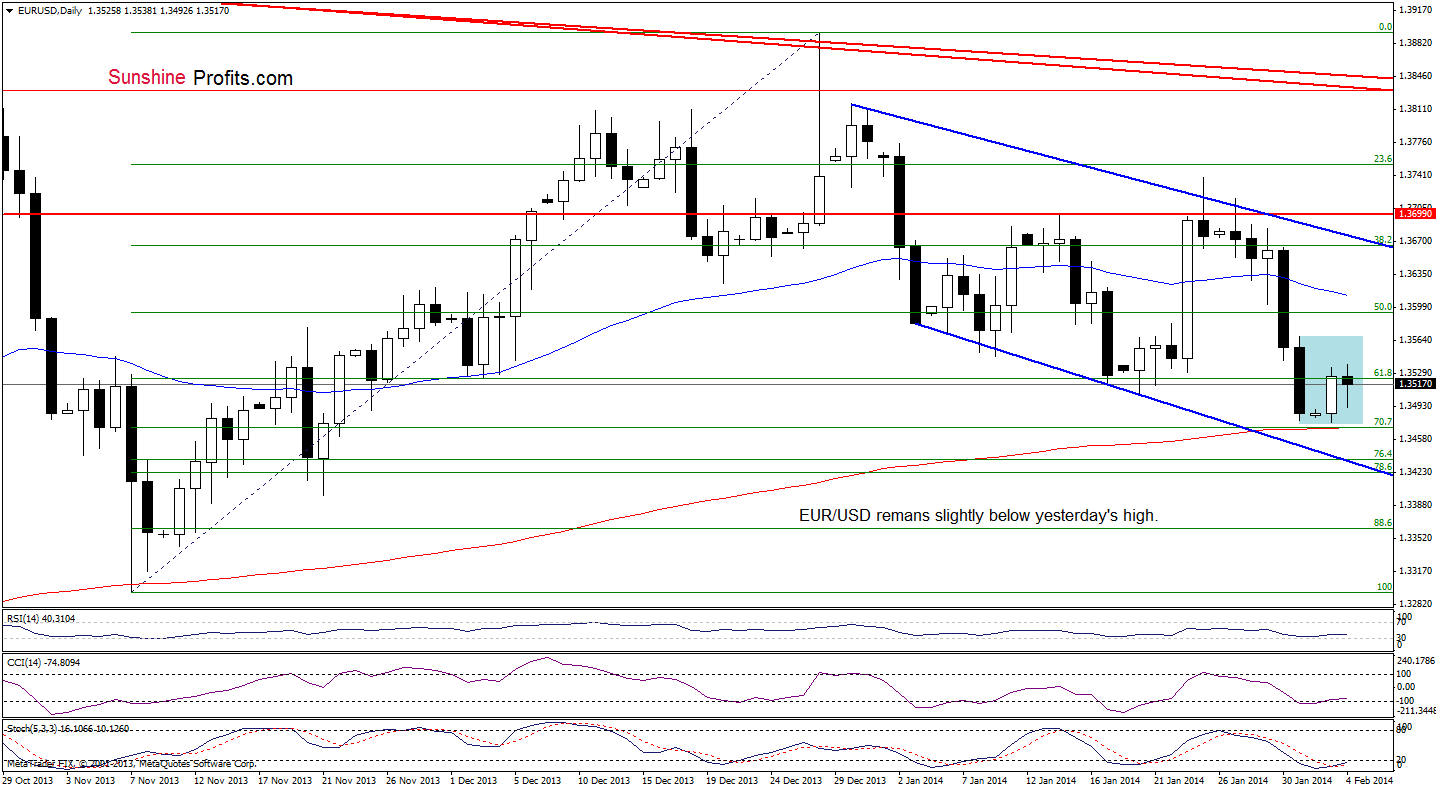
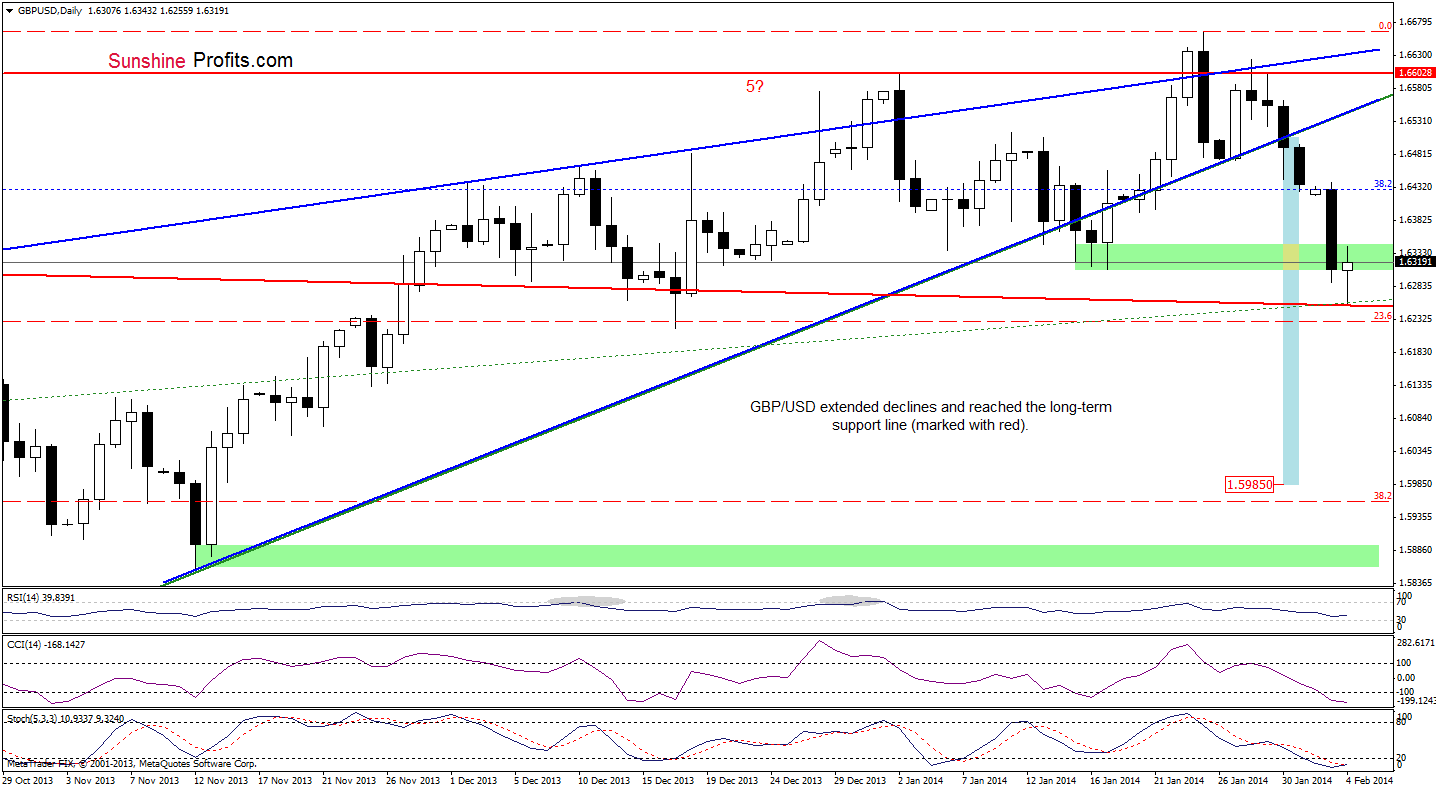
Timing & trends
WASHINGTON (MarketWatch) — Private-sector-employment gains slowed down in January, as employers added 175,000 jobs, Automatic Data Processing Inc. reported Wednesday. Economists had forecast that private-sector hiring slowed down last month, with employers adding 189,000 jobs, compared with an originally estimated December increase of 238,000, according to a Dow Jones Newswires survey. On Wednesday ADP revised December’s gain to 227,000. Economists use ADP’s data to get a feeling for the U.S. Labor Department’s employment report, which will be released Friday and covers government jobs in addition to the private sector. Economists polled by MarketWatch expect the government’s report to show that nonfarm employment rose by 190,000 jobs last month, speeding up after a meager gain of 74,000 jobs in December, when there was unusually harsh weather.
Read the full story: Private-sector starts 2014 with slower hiring

Obamacare to cut work hours by equivalent of 2 million jobs: CBO
President Barack Obama’s healthcare law will reduce American workforce participation by the equivalent of 2 million full-time jobs in 2017, the Congressional Budget Office said on Tuesday, prompting Republicans to paint the law as bad medicine for the U.S. economy.
In its latest U.S. fiscal outlook, the nonpartisan CBO said the health law would lead some workers, particularly those with lower incomes, to limit their hours to avoid losing federal subsidies that Obamacare provides to help pay for health insurance and other healthcare costs.
The biggest impact would begin in 2017, CBO said, because major provisions of the law will be well under way by then. The CBO said there would be smaller declines in work hours that would occur before then.
….read more HERE
Markets tend to have no set rules that always work. Especially on shorter term time frames. But as you stretch the time frame out to the longer term general guidelines start to form for how markets behave. This includes concepts such as bear markets following bull markets, and bull markets following bear markets. Periods of overvaluation in stocks tend to be followed by periods of undervaluation. And relationships between asset classes tend to switch as one asset class becomes extremely overvalued or undervalued against another. The market hates extremes so by definition trends that reach extremes tend to eventually reverse.
With that being said one of the oldest trends in the market right now that is also sitting at an extreme is long gold, short gold miners. If you follow the gold market at all, you know that gold went up for 12 years in a row, then had ahorrific 2013 as it finally had a major correction. That was previously one of the longest trends in the market to finally experience a major reversal. Which in gold’s case was a bull market finally going through a bear market. But within the gold trend the relationship of gold outperforming gold miners has been in place since 2006! Gold stocks have been in a bear market versus gold for over 8 years!
Now one thing to note is not all gold stocks have performed as badly versus gold as others. It’s basically been a stock pickers’ market for gold stocks since the mid-2000s. If you picked the right gold stocks you could still acheive outperformance versus gold. Also gold stocks did have a major bounce from late-2008 until early-2011, where they did outperform gold. But that bounce did not negate the overall trend of lower gold stocks versus gold, starting way back in 2006.
The chart below, comparing the HUI Gold Miners Index versus gold on a monthly time frame, shows how this has unfolded. After forming a double top versus gold from 2004 to 2006, with a negative divergence in the MACD, gold stocks started trending lower versus gold. Then as the financial panic hit in 2008, gold stocks got smashed, and dropped completely out of the trend channel to the downside. This setup a trading opportunity though where gold stocks rebounded versus gold. And they had a powerful rally which brought the relationship back to the top of the channel. But then as if to help forecast gold’s major top in the fall of 2011, gold stocks resumed the trend lower versus gold which continued into late 2013. Notice though that the MACD didn’t make a lower low in late 2013, which is setting up a positive divergence in momentum. Also note that MACD is about to turn back higher again, and this is a rare occurrence as the 3 major MACD crosses defined the overall trend lower. The final crossover of the MACD higher, at the bottom of the trend channel, could be where this trade is about to finally reverse.
Now let’s zoom in on a more recent chart, a weekly comparison of the GDX gold miner’s ETF versus the gold ETF GLD. After the bounce ended in early 2011, gold stocks entered into another Stage 4 decline versus gold. A big negative divergence in momentum helped forecast this transition. Then besides a bounce in 2012 the Stage 4 decline has remained intact until early 2014. But notice the massive increase in volume coming into GDX vs. GLD that started in mid-2013, which is coincidentally where gold bottomed. At the same time momentum started moving higher, and has setup a positive divergence versus the price action. Both volume and momentum are indicating a possible trend change once again, as money flows back into the gold stocks relative to gold.
Even if you’re not convinced gold has reached a major bottom yet, like most of Wall Street, the relationship between gold and gold stocks is still worth watching. Because big moves come from old trades that are finally ready to unwind, and this is one of the oldest trades in the market currently.
Connect with me on Twitter: @nextbigtrade
The original article and much more can be found at: http://www.nextbigtrade.com
The views and opinions expressed are for informational purposes only, and should not be considered as investment advice. Please see the disclaimer.

 Rogers prefers gold over gold mining shares and divisible coins over bullion, but says “there’s nothing in precious metals that I’m tempted to buy at the moment.” Indian import tariffs he views as the single biggest drag on the gold market currently.
“They’ve got a huge balance of trade deficit and the three largest parts are oil, gold and cooking oil. They cannot do anything about oil or cooking oil, so they’re attacking gold, blaming their problems on gold. Gold has not caused their problems, gold is a symptom of their problems, but politicians are pretty simple-minded people and they look for the easy answer.”
For early 2014, Rogers is therefore long inflatable equities and neutral on gold, but longer term, he expects to short junk and government bonds and is ultra bullish on gold. “Gold will become one of the only refuges around,” he says. “That’s not this quarter.”
Jim Rogers started trading the stock market with $600 in 1968.In 1973 he formed the Quantum Fund with the legendary investor George Soros before retiring, a multi millionaire at the age of 37. Rogers and Soros helped steer the fund to a miraculous 4,200% return over the 10 year span of the fund while the S&P 500 returned just 47%.
New orders for U.S. factory goods fell in December, but rose with the volatile transportation sector excluded. … full article

-
I know Mike is a very solid investor and respect his opinions very much. So if he says pay attention to this or that - I will.
~ Dale G.
-
I've started managing my own investments so view Michael's site as a one-stop shop from which to get information and perspectives.
~ Dave E.
-
Michael offers easy reading, honest, common sense information that anyone can use in a practical manner.
~ der_al.
-
A sane voice in a scrambled investment world.
~ Ed R.
Inside Edge Pro Contributors

Greg Weldon

Josef Schachter

Tyler Bollhorn

Ryan Irvine

Paul Beattie

Martin Straith

Patrick Ceresna

Mark Leibovit

James Thorne

Victor Adair