
Timing & trends
DOW -179 on 1450 net declines
NASDAQ COMP – 61 on 1050 net declines
SHORT TERM TREND Bullish
INTERMEDIATE TERM TREND Bearish (change)
Available Mon- Friday after 6:00 P.M. Eastern, 3:00 Pacific.
STOCKS: We’re bearish on the stock market for 2014. This was the title of our January newsletter, sent out on January 6th.
But, we thought we could get a bit more on the upside, mainly based on the fact that the advance decline line was outperforming the major averages and also on the favorable seasonality.
So it was a big surprise to see the extreme weakness on Monday. Several things probably contributed. Goldman Sachs said that valuations were elevated. Dennis Lockhart the president of the Atlanta Fed suggested that tapering would continue and there have been a number of earnings warnings.
GOLD: Gold was up $6.
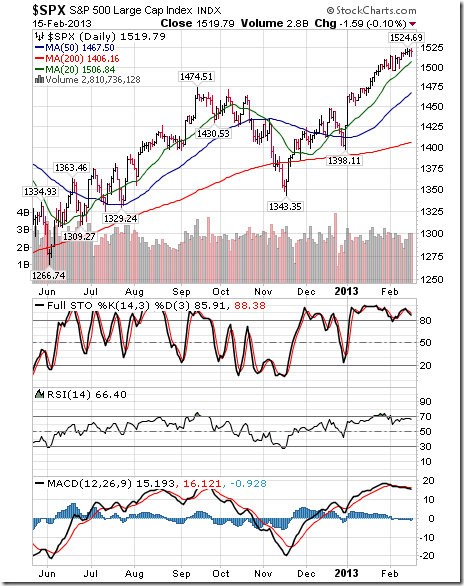
CHART: The S&P 500 made a low below a previous low today (arrows). That tends to be a negative. However, the VIX, or fear index changed by 9%. When it changes by this much, we usually get a short term bounce. Let’s see what happens tomorrow.

TORONTO EXCHANGE: Toronto was down 60.
S&P\TSX Venture Comp: The Venture Comp was down 2.
BONDS: Bonds moved higher again.
THE REST: The dollar was lower. Silver rallied. Copper and crude oil were lower.
BOTTOM LINE:
Our intermediate term systems are on a buy signal.
System 7 We bought the SSO at 101.79. If there are more declining issues than advancing ones at 3:45 EST, sell at the close.
System 8 We are in cash. Stay there on Tuesday.
NEWS AND FUNDAMENTALS:
There were no important economic releases Monday. On Tuesday we get retail sale. That should be interesting.
…………..
We’re on a buy for bonds as of January 10.
We’re on a buy on the dollar and a sell for the euro as of December 19.
We’re on a sell for gold as of December 19.
We’re on a buy for silver as of December 10.
We’re on a sell signal for crude oil as of January 2.
We’re on a sell for copper as of January 9.
We’re on a buy for the Toronto Stock Exchange as of today December 26.
We’re on a buy for the S&P\TSX Venture Comp. as of December 31.
|
We are long term bullish for all major world markets, including those of the U.S., Britain, Canada, Germany, France and Japan. |

INDICATOR PARAMETERS
Monetary conditions (+2 means the Fed is actively dropping rates; +1 means a bias toward easing. 0 means neutral, -1 means a bias toward tightening, -2 means actively raising rates). RSI (30 or below is oversold, 80 or above is overbought). McClellan Oscillator ( minus 100 is oversold. Plus 100 is overbought). Composite Gauge (5 or below is negative, 13 or above is positive). Composite Gauge five day m.a. (8.0 or below is overbought. 13.0 or above is oversold). CBOE Put Call Ratio ( Below .80 is a negative. Above 1.00 is a positive). Volatility Index, VIX (low teens bearish, high twenties bullish), VIX % single day change. + 5 or greater bullish. -5 or less, bearish. VIX % change 5 day m.a. +3.0 or above bullish, -3.0 or below, bearish. Advances minus declines three day m.a.( +500 is bearish. – 500 is bullish). Supply Demand 5 day m.a. (.45 or below is a positive. .80 or above is a negative).
No guarantees are made. Traders can and do lose money. The publisher may take positions in recommended securities.
|
This email was sent by toddmarketforecast@charter.net |
Subscribe or Update Profile/Email Address
|

Look for renewed seasonal buying opportunities in economic sensitive sectors following a brief period of weakness into January.
Economic News This Week
December Retail Sales to be released at 8:30 AM EST on Tuesday is expected to remain unchanged from November versus a gain of 0.7% in October. Excluding Auto Sales, December Retail Sales are expected to increase 0.4% versus a gain of 0.4% in November.
November Business Inventories to be released at 10:00 AM EST on Tuesday are expected to increase 0.3% versus a gain of 0.7% in October.
December Producer Prices to be released at 8:30 AM EST on Wednesday are expected to increase 0.3% versus a decline of 0.1% in November. Excluding food and energy, PPI is expected to increase 0.1% versus a gain of 0.1% in November.
January Empire Manufacturing Index to be released at 8:30 AM EST on Wednesday is expected to increase to 3.5 from 1.0 in December.
The Fed Beige Book is scheduled to be released at 2:00 PM EST on Wednesday
Weekly Jobless Claims to be released at 8:30 AM EST on Thursday are expected to increase to 333,000 from 330,000 last week.
December Consumer Prices to be released at 8:30 AM EST on Thursday are expected to increase 0.3% versus no change in November. Excluding food and energy, CPI is expected to increase 0.2% versus a gain of 0.2% in November
January Philadelphia Fed Index to be released at 10:00 AM EST on Thursday is expected to increase to 8.0 from 6.4 in December.
December Housing Starts to be released at 8:30 AM EST on Friday are expected to slip to 986,000 from 1,091,000 in November
December Industrial Production to be released at 9:15 AM EST on Friday are expected to increase 0.3% versus a gain of 1.1% in November. December Capacity Utilization is expected to increase to 79.1% from 79.0 in November.
January Michigan Sentiment Index to be released at 9:55 AM EST on Friday is expected to increase to 83.0 from 82.5 in December.
Equity Trends
The S&P 500 Index added 11.00 points (0.60%) last week. Trend remains up. The Index remains above its 20, 50 and 200 day moving averages. Short term momentum indicators are overbought and showing early signs of rolling over
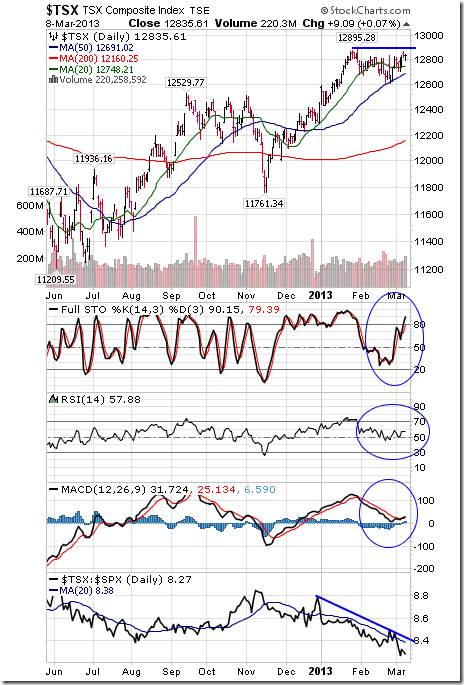
The TSX Composite Index added 198.66 points (1.47%) last week. Trend is up (Score: 1.0). The Index closed at a 2.5 year high. The Index remains above its 20, 50 and 200 day moving averages (Score: 1.0). Strength relative to the S&P 500 Index remains positive (Score: 1.0). Technical score based on the above indicators remains at 3.0 out of 3.0. Short term momentum indicators are overbought.
….continue viewing 43 more charts HERE


Before the US employment report for December was released early this morning, a number of economists and strategists were guessing that the country would be able to produce more than 190,000 net new jobs. Many of those prognosticators where speculating that the number could be as high as 225,000.
Instead, the number was only 74,000, one of the biggest economic misses I have seen in a long time.
Initially, a common response that I heard was that employment was weak because the weather was bad. But, economists already knew the weather was bad and they stuck to their rosy forecast. (If they didn’t know the weather was bad, then they must not own TVs or don’t have access to the internet as the topic of weather has dominated the headlines for weeks now).
The US labor participation rate also fell to a new low not seen since 1978. This actually helped the US national unemployment rate fall from 7.0% to 6.7% in December, but that is not much consolation when looking at the overall picture.
And remember, these anemic employment numbers are being produced despite the mind-boggling amounts of liquidity pumped into the US economy with the stated goal of trying to improve employment. We have been skeptical of the efficacy of Quantitative Easing (QE) and continue to be proven right. While there has been some improvement in US employment, the marginal gains don’t justify the endless trillions of money being printed as part of an experimental monetary policy. And since 2010, QE has not been able to add anything more to monthly job creation (see chart above).
Right now most are still expecting the Fed’s tapering of QE to continue on schedule. But another month like the one that we just had might change things, regardless of how bad the weather.
The opinions expressed in this report are the opinions of the author and readers should not assume they reflect the opinions or recommendations of Richardson GMP Limited or its affiliates. Assumptions, opinions and estimates constitute the author’s judgment as of the date of this material and are subject to change without notice. We do not warrant the completeness or accuracy of this material, and it should not be relied upon as such. Before acting on any recommendation, you should consider whether it is suitable for your particular circumstances and, if necessary, seek professional advice. Past performance is not indicative of future results.
Richardson GMP Limited, Member Canadian Investor Protection Fund.
Richardson is a trade-mark of James Richardson & Sons, Limited. GMP is a registered trade-mark of GMP Securities L.P. Both used under license by Richardson GMP Limited.
Inflationary expectations, as measured by the spread between US 10-Year Notes and Treasury Inflation Protected Securities (TIPS), have recently increased to the highest level since August 2013
- Jobs numbers in the US as measured by the ADP survey and the non-farm payroll data are showing continued strength
- A plethora of additional data including consumer confidence ISM and PMI surveys seem to echo the theme of a strengthening US economy
- This is welcome news, but is it enough to overcome the strong disinflationary forces that we have written about?
Has the Tide Turned?
For the last six months, I have been writing and speaking on the tug of war between inflation and deflation. This is a battle with no clear winner – yet. Recent economic data from the United States has most wondering if we have finally “turned the corner” and are now on the path of sustainable economic growth.
Earlier this week, the ADP Private Employment Report surprised to the upside with 238,000 jobs created in December 2013. This was in excess of the initial estimate of 205,000 – a very strong number in and of itself. Further, the previous month’s jobs number was also revised higher (a final print of 229,000 new jobs).

Despite the strong job numbers dating back to late 2010, official inflation stats remain mysteriously subdued. To be clear, there is inflation in the economy, but the cost push inflation one would expect is not fully evident. We can also argue about the “quality” of these jobs that are being created, but this is perhaps another topic for another Note.
The positive economic news extends beyond job creation. A look at the trends in select ISM data also would confirm a scenario of generally positive economic growth. As a reminder, a reading above 50 indicates economic expansion.

Other metrics, improving consumer sentiment, strong PMI readings, and upward revisions in GDP numbers reinforce the recovery thesis. Even the angriest bear would have to admit that while the economic recovery here is slow, we are at least “recovering”.
The Case for Rose-Colored Glasses May be Overstated
As is the case with any argument, there is always another side to the story. Many of the metrics we have written about in recent months still look shaky, including:
The Velocity of Money (M2):

The Money Multiplier:

and the Adjusted Monetary Base:

These metrics, along with a yawning output gap and historically low labor force participation rate are clearly still struggling to gain their footing and state the case for a stagnant economy and stoke fears of deflation.
In addition to the data above, the chart below shows just how far the U.S. economy must improve vis-à-vis job creation to stay even with the growth in the overall labor force. As you can see employment is not back to its pre-recession level in 2007. This is troubling for a consumer economy such as the U.S.

This yawning employment gap is a very real albatross around the neck of the U.S. economy.
In spite of these arguments, new data shows markets are now forecasting the first whiffs of inflation in the economy. Shown below is the spread between the U.S. 10 Year Treasury Note and the 10 year Treasury Inflation Protected Security (TIPS).

This spread is a measure of inflation expectations. As the spread widens, this tells us that market participants are anticipating increasing inflation as measured by the CPI. This is important, because it is a forward-looking indicator as opposed to so much else which is not. The benefit of owning TIPS is that since their value is indexed to the CPI, as the CPI rises, so does the value of the TIPS. The idea here is to protect the value of your investment against inflation which can, of course, erode your returns.
According to the Financial Times, inflation expectations in the US are at their highest level since August of 2013. The U.S. dollar would appear to be pricing in a higher interest rate environment, having shown sustained strength since late October 2013, despite the overall move lower since July.

The Takeaway
Despite the best intentions of Central Bankers in the U.S., the Euro Zone, and Japan, deflation/disinflation remains a much larger concern than inflation. I have said, in the past, and still believe, that QE, ZIRP, forward guidance, and other schemes put forth by Central Banks are actually deflationary in nature. The money they have created is not finding its way into the economy through expansion of credit.
Evidence of inflation in the economy should be a welcome sign – to policy makers and consumers alike. Policy makers want to see inflation as they believe it is a much simpler problem to control. Debt holders and the U.S. government should like inflation as it can push up wages and devalue outstanding debt.
Rising inflation should be a net positive for commodities, especially after the challenging environment we endured in 2013. This doesn’t mean that the now devastated junior exploration sector will immediately benefit, but there are a number of ways to play this.
We’ll be speaking about some investment strategies at the Cambridge House Resource Conference in Vancouver next week.
With the Federal Reserve in “taper mode” I will be paying close attention to these bond spreads as well as any sustained increase in commodity pricing to gauge whether or not we’ve broken free from the cold grip of disinflation. The risk, of course, is that higher interest rates choke off a nascent US economic recovery. This will be one of the key events to watch for in 2014.
Join Discovery Investings Mailing list HERE
Ben Bernanke, the retiring Chairman of the Federal Reserve Board in the U.S., did his best to fight the notion that he was preconditioned to be “dovish.” This might have been an attempt to challenge the nickname of “Helicopter Ben” given to him after a speech in November 2002 where he suggested that if the U.S. faced deflation, the Fed could always resort to dropping money from helicopters.
To give him credit, Bernanke held back temptations to excessively expand the money supply at the beginning of his appointment. In fact, he was known for downplaying growing concerns rather than automatically responding by increasing liquidity. During this phase he famously said that the Subprime mortgage crisis was “contained, suggesting that we should worry about (Although the Fed’s inability to forecast the crisis was also a contributing factor to his initial reaction).
Finally, when the Global Credit Crisis and the Great Recession hit, Bernanke caved in and has never looked back, reaffirming the reasons as to why the name “Helicopter Ben” fit him so well.
Just as Bernanke was given some benefit of the doubt, Janet Yellen is getting some similar treatment from many investors in the market. Honeymoons tend to be like that. However, when people face pressure, they mostly revert back to old habits and beliefs.
The opinions expressed in this report are the opinions of the author and readers should not assume they reflect the opinions or recommendations of Richardson GMP Limited or its affiliates. Assumptions, opinions and estimates constitute the author’s judgment as of the date of this material and are subject to change without notice. We do not warrant the completeness or accuracy of this material, and it should not be relied upon as such. Before acting on any recommendation, you should consider whether it is suitable for your particular circumstances and, if necessary, seek professional advice. Past performance is not indicative of future results.
Richardson GMP Limited, Member Canadian Investor Protection Fund.
Richardson is a trade-mark of James Richardson & Sons, Limited. GMP is a registered trade-mark of GMP Securities L.P. Both used under license by Richardson GMP Limited.

-
I know Mike is a very solid investor and respect his opinions very much. So if he says pay attention to this or that - I will.
~ Dale G.
-
I've started managing my own investments so view Michael's site as a one-stop shop from which to get information and perspectives.
~ Dave E.
-
Michael offers easy reading, honest, common sense information that anyone can use in a practical manner.
~ der_al.
-
A sane voice in a scrambled investment world.
~ Ed R.
Inside Edge Pro Contributors

Greg Weldon

Josef Schachter

Tyler Bollhorn

Ryan Irvine

Paul Beattie

Martin Straith

Patrick Ceresna

Mark Leibovit

James Thorne

Victor Adair