
Timing & trends
The bull market deniers have been out in full force lately.
From Pimco’s Bill Gross, who swears that “all asset prices are bubbly,” to billionaire Jim Rogers, who keeps urging caution because “the big, big rally in the U.S. stock market” isn’t based on reality.
Those are just two notable examples. Rest assured, countless others exist. Don’t just take my word for it, either…
In a recent note to investors, Bespoke Investment Group said, “There’s been so much ‘bubble’ talk lately that our heads are spinning.”
So true! But I’ll take it by the truckload. Why? Because the more negativity that’s swirling around – and the more pundits that are warning about a top – the more likely it is that we’re nowhere even close.
In other words, their sentiment is a contrarian indicator.
That’s a fact of investing Sir John Templeton validated long ago, when he said (emphasis mine), “Bull markets are born on pessimism, grow on skepticism, mature on optimism and die on euphoria.”
Newsflash: We’re clearly in the “growing” phase, not the “dying” phase.
If you want concrete proof, look no further than the American Association of Individual Investors (AAII) sentiment survey:
…..go HERE to view the Chart & read more/

Economic News
November Canadian Housing Starts to be released at 8:15 AM EST are expected to dip to 195,000 from 198,000 in October.
THE BOTTOM LINE:
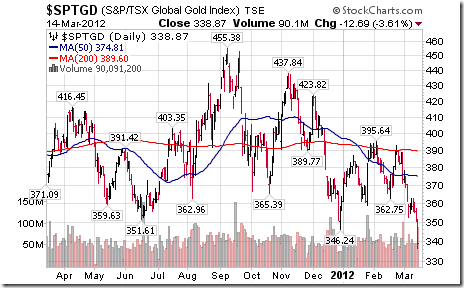
Economic sensitive sectors with strong positive seasonality traits (e.g. Industrials, Consumer Discretionary, Technology and Materials) are leading equity markets on the upside. Preferred strategy is to accumulate equity markets and sectors with favourable seasonality on weakness in order to take advantage of the October 28th to May 5th period of strength.
Weekly Initial Jobless Claims to be reported at 8:30 AM EST on Thursday are expected to increase to 315,000 from 298,000 last week.
November Retail Sales to be released at 8:30 AM EST on Thursday are expected to increase 0.6% versus a gain of 0.4% in October. Excluding auto sales, November Retail Sales are expected to increase 0.3% versus a gain of 0.2% in October.
October Business Inventories to be released at 10:00 AM EST on Thursday are expected to increase 0.3% versus a gain of 0.6% in September.
November Producer Prices to be released at 8:30 AM EST on Friday are expected to remain unchanged versus a decline of 0.2% in October. Excluding food and energy, November Producer Prices are expected to increase 0.1% versus a gain of 0.2% in October.
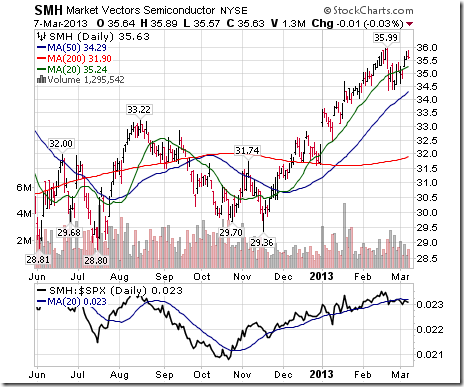
EQUITY TRENDS
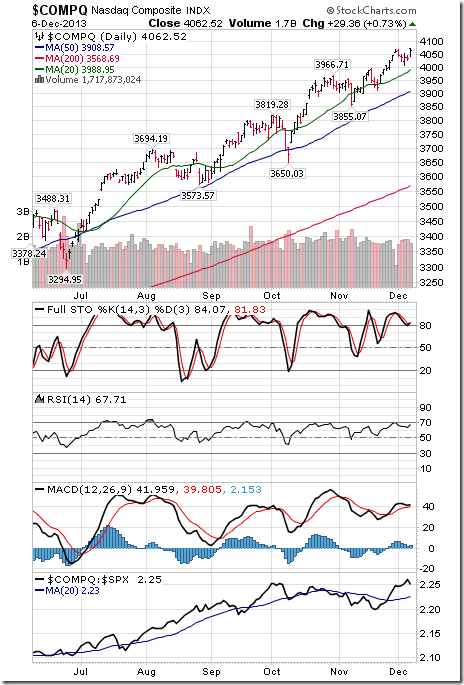
The NASDAQ Composite Index The Shanghai Composite Index added 16.61 points (0.75%) last week. Trend changed from neutral to up on a move above resistance at 2,243. The Index remains above its 20, 50 and 200 day moving averages. Strength relative to the S&P 500 Index remains positive. Technical score improved to 3.0 from 2.5 out of 3.0. Short term momentum indicators are overbought.
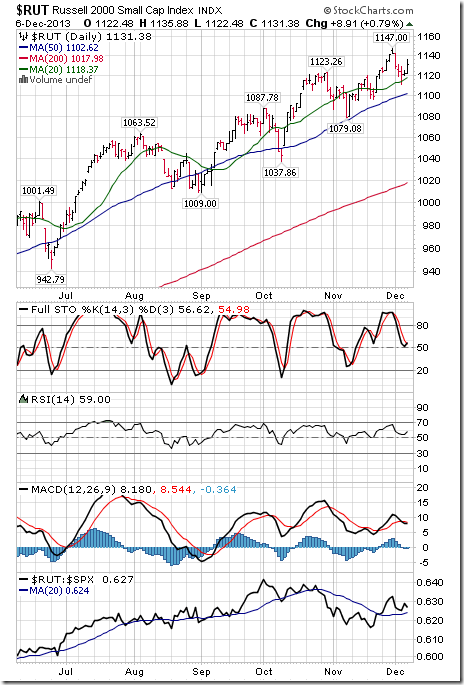
The Russell 2000 Index fell 11.51 points (1.01%) last week. Trend remains up. The Index remains above its 20 day moving average. Strength relative to the S&P 500 Index remains positive. Technical score remained at 3.0 out of 3.0. Short term momentum indicators are trending down.
The Shanghai Composite Index added 16.61 points (0.75%) last week. Trend changed from neutral to up on a move above resistance at 2,243. The Index remains above its 20, 50 and 200 day moving averages. Strength relative to the S&P 500 Index remains positive. Technical score improved to 3.0 from 2.5 out of 3.0. Short term momentum indicators are overbought.

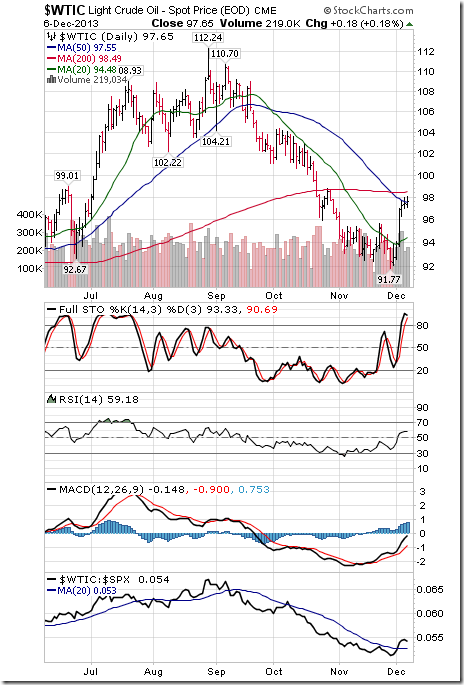
Crude oil gained $4.93 per barrel (5.32%) last week. Trend changed from down to neutral on a move above $95.63. Crude moved above its 20 and 50 day moving averages. Strength relative to the S&P 500 Index changed from negative to positive. Technical score improved from to 2.5 from 0.0 out of 3.0. Short term momentum indicators are trending up.
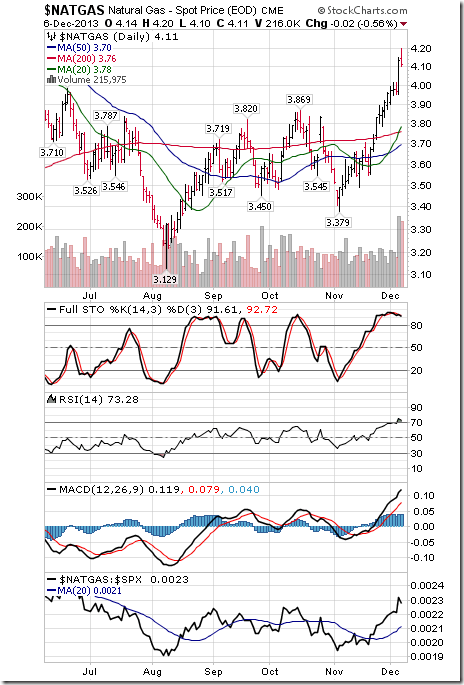
Natural Gas added $0.16 per MBtu (4.05%) last week. Trend remains positive. Natty remains above its 20, 50 and 200 day moving averages. Strength relative to the S&P 500 Index remains positive. Technical score remains at 3.0 out of 3.0. Short term momentum indicators are overbought.
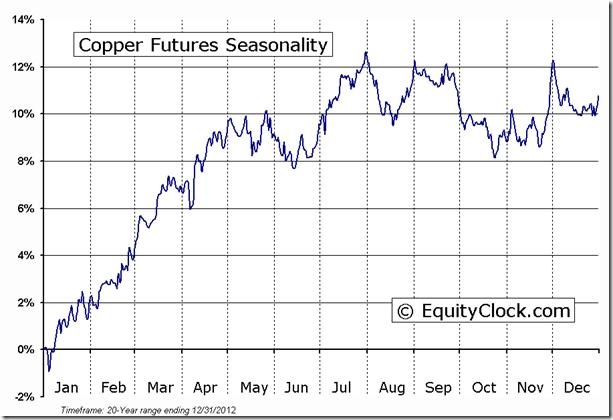
Copper added $0.05 per lb. (1.56%) last week. Trend remains down. Copper moved above its 20 day moving average. Strength relative to the S&P 500 Index changed from negative to positive. Technical score improved to 2.0 from 0.0 out of 3.0. Short term momentum indicators are trending up.
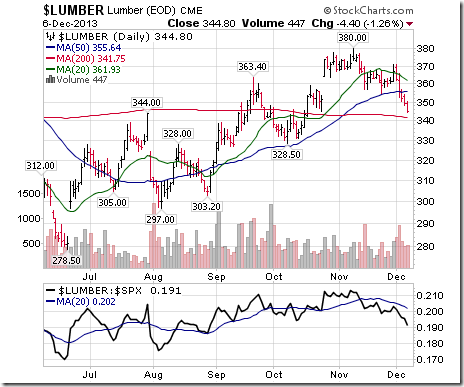
Lumber fell another $22.10 (6.02%) last week. Trend remains up. Lumber fell below its 20 and 50 day moving averages. Strength relative to the S&P 500 Index remains negative. Technical score slipped to 1.0 from 2.0 out of 3.0.
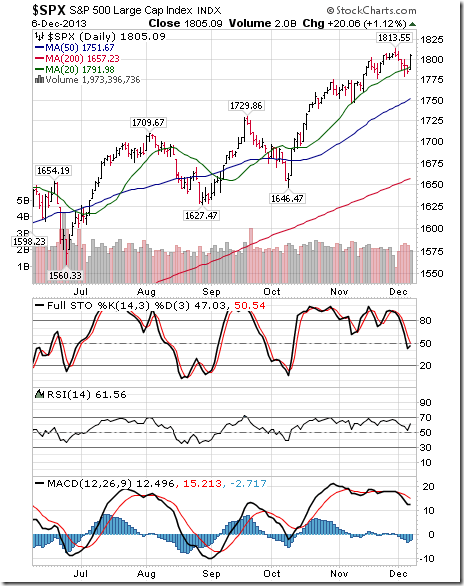
The S&P 500 Index slipped 0.72 (0.04%) last week. Trend remains up. The Index briefly fell below its 20 day moving average, but managed to close above it. Short term momentum indicators have rolled over from overbought levels.
The TSX Composite Index fell 114.68 points (0.86%) last week. Trend changed from up to neutral on a move below 13,285 (Score: 0.5). The Index remained below its 20 day moving average (Score:0.0). Strength relative to the S&P 500 Index remains negative (Score: 0.0). Technical score slipped to 0.5 from 1.0 out of 3.0. Short term momentum indicators are trending down.
Economic and political focus this week is on the Congressional Budget Committee and its report expected to be released on December 13th. Hopes are high that an agreement will be reached. Other economic reports (e.g. Retail Sales, Initial Claims, Producer Prices) are expected to support higher equity prices.
Earnings reports this week are not a factor.
Short and intermediate technical indicators for most equity markets and sectors are overbought, but have yet to show significant signs of rolling over.
Seasonal influences for equity markets this week are slightly negative. However, influences turn strongly positive throughout the remainder of the month.
Money flows into share buy backs continue. Last week, Deere joined the party with an $8 billion share buyback. Equity markets likely will anticipate an increasing number of share buybacks when fourth quarter reports are released.
Special Free Services available through www.equityclock.com
Equityclock.com is offering free access to a data base showing seasonal studies on individual stocks and sectors. The data base holds seasonality studies on over 1000 big and moderate cap securities and indices. Notice that most of the seasonality charts have been updated recently.
To login, simply go to http://www.equityclock.com/charts/
ED Note: Above is an example of the Copper Seasonality Chart which pretty graphically underscores the Bottom Line Sector Seasonal Strength.
 Tis the Season for the most powerful seasonality trade of the year!
With the stock market up big in 2013 and most participants are speculating on a pullback in the next week or two, I have to say I am on the other side of that bet. Being a technical trader I focus on patterns, statistics and probabilities to power myETF trading strategies. So with 37 years of stats the seasonality chart of the S&P 500 index paints a clear picture of what is likely to happen in December.
If you do not know how to read a seasonality chart, I will explain as its very simple. The simply shows what the index has done on average through each month over the past 37 years. December typically has the strongest up trend and probability of happening any other time of the year.
The Big Board – NYSE
The NYSE also referred to as the Big Board, is an index with the largest brand name companies. Most individuals do not follow this, but to me its as close to the holy grail of trading than anything else I know. I use many different data points from this index (momentum, order flow, trend) for my ETF trading strategies.
You must follow the trend of this index if you want to be on the right side of the market. While I follow and track the New York Stock Exchange closely and it has its own fund NYC but it’s an ETF trade I do not use. These big stocks are what really move the market (S&P 500) I think so I always trade with this index trend in mind.

S&P 500 Weekly ETF Trading Strategy – Bullish
The chart below is self-explanatory I think… But let me recap.
The overall trend is up, so your ETF trades should be to the long side buying on the dips. The chart below goes back three years so the candles are a little condensed and small, but what you need to know are these two points:
1. After a correction within a trend, probability says that price is more likely to continue rising than it is to reverse. Notice the market just had a running correction through the summer months.
2. A reversal candle on the weekly chart (bullish reversal candle) generally indicates a 2-3 week rally is likely to happen.
Conclusion: Seasonality says higher prices, weekly chart below shows bullish reversal candle… Oya!

The Bigger Picture: 3 -6 Months Out…
This is a quarterly chart and BIG picture outlook. Over the next 3-6 months we could see the stock market start to become choppy and rollover into a minor bear market for a couple years. That is the best case scenario I think… The other scenario is a major crash back down to the 700-1000 level on the SP500 which would cripple the baby boomer’s from retiring and getting a job would be impossible for almost everyone – full blown recession way worse that what everyone is saying we are in now.
Things are going to be really interesting over the next few years and things for south you better be prepared to make a killing during the next bear market or life will not be fun. The nice thing is that you can take advantage of these moves without ever having to lift a finger with my automated trading system.

ETF Trading Strategies Holiday Conclusion:
In short, I think we have a couple good weeks ahead of us. Holiday season, quality family time and a rising stock market paints a nice picture in my mind.
Anyway, I hope this report was helpful and somewhat educational. I always appreciate feedback and things you would like me to write about how I interpret, trade or analyze things. I am here to help and new topics to write about are always welcome!
JOIN MY FREE ETF TRADING NEWSLETTER!

Ed Note: To sign up Click HERE or on the arrow then scroll to the bottom of the page where you can fill in your name or your email address to get the FREE ETF TRADING NEWSLETTER.
To get Review and sign up for the the PAID MONTHLY, SEMI-ANNUAL OR ANNUAL MEMBERSHIP GO HERE
Well friends, it’s the holidays again, so I figured it’s not a bad time to write about one of the coolest new toys to hit the market in years…
…The defense market, that is.
You’ve probably been reading more and more about the dramatic expansion of the use of robot technology on the modern battlefield.
The most famous of these are the Reaper drones – for which the Air Force is currently training more personnel than for any other single weapons system.
But while Reapers are great for hitting targets (usually enemy combatant in nature) from afar with things like Maverick air-to-ground missiles and 500 lb GPS guided bombs, the Army now has its own ground-based killer robot system to do what infantry have long referred to as “grunt work.”
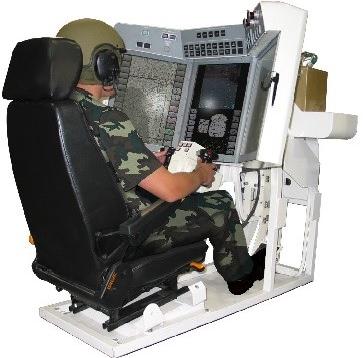
Behold, the MAARS:

MAARS, which stands for Modular Advanced Armed Robotic System, is the start of a new trend in surface combat for the U.S. Army.
Adding Teeth and Claws to an Existing Concept
While robots have been used for years to take high-risk pressure off troops – namely in bomb disposal and rescue applications, where human safety is likely to be compromised – the MAARS takes it a step further, doing something which Luddites have been fearing since before Jim Cameron’s android first spoke with an Austrian accent: delivering heavy ordnance directly to the enemy at high velocity.
Armed with a multitude of weapons (pictured above with a .30 caliber machine gun and a quadruple 40mm grenade launcher), the MAARS costs $300,000 for the base platform, with a variety of configurations available depending on mission parameters.
Although other robots are usually tasked with bomb disposal, one of the available attachments for the MAARS is an arm capable of lifting 120 lbs – strong enough to pick up a 155mm artillery round – or dragging a wounded soldier twice that weight.
Now, for those of you thoroughly terrified by science fiction scenarios, I urge you not to worry too much – at least about this iteration of automated combat technology.
The MAARS is really nothing more than a very, very expensive remote control car.
Its range is limited to just over 3000 feet from its human operator, with environmental information provided via a range of visual and infra-red sensors to a control module tucked inside an armored support vehicle.
Being dependent on a human operator, the MAARS is therefore still just a tool designed to put distance between danger and irreplaceable human tissue… However, tactics for the use of the MAARS in unison with other robotic systems are already being developed for future combat situations – most notably working alongside smaller, more specialized ground-based robots and small airborne drones with hover capabilities.
The MAARS has already demonstrated a talent for breaching doors and walls, entering hostile strongholds, and mopping up concentrations of enemy combatants with its machine gun and grenades.
Cheaper Than the Cost of Human Casualties
The question of cost effectiveness has been posed, of course. Just how useful are these expensive machines when a primitive and cheap IED could easily render one useless?
To that, developers of these systems have an equally straightforward response: $300,000 for a robot that can be replaced is still cheaper than a maimed or killed soldier that cannot.
MAARS units are expected to see wide deployment somewhere around 2018, with an expanded array of weapons options including smart munitions and laser targeting equipment designed to designate impact points for air strikes – most likely performed by their airborne brethren.
If the deployment history of flying robots is in any way a model for how their ground-based cousins will fare in the future, then it is, to say the least, a model for growth.
Not only does this technology promise to expand the technical capabilities of NATO’s armed forces, but it shows that an added emphasis on training and education is in store for the soldiers operating this equipment as well.
The MAARS is a product of the British-based defense firm Qinetiq (QQ.L), which is listed on the London stock exchange.
It is the 52nd largest defense contractor in the world, with a total market capitalization of $1.35 billion and subsidiaries in North America and Australia.
Bear in mind, however, that this company is just 12 years old and only in its 7th year on the public exchange.
Given the cutting-edge nature of the company’s products, as well as the ever-expanding defense market niche it’s managed to grab, it’s as exciting a story as you’ll find in the tech sector today.
It isn’t, however, the only such story.
My colleague Chris Dehaemer just recently published a detailed report on three other such outfits specializing in the design and manufacture of robotic systems for distinctly different applications.
Domestic and industrial robotics, just like their military cousins, are entering golden eras of their own.
Now is the time to get informed on where the future will take them.
You can read his full report here.
To Your Wealth,

Brian Hicks
Brian is a founding member and President of Angel Publishing and investment director for the income and dividend newsletter The Wealth Advisory. He writes about general investment strategies for Wealth Daily and Energy & Capital. Known as the “original bull on America,” Brian is also the author of the 2008 book, Profit from the Peak: The End of Oil and the Greatest Investment Event of the Century. In addition to writing about the economy, investments and politics, Brian is also a frequent guest on CNBC, Bloomberg, Fox and countless radio shows. For more on Brian, take a look at his editor’s page.
 No, it’s not a glandular condition. China’s leaders concluded the third Plenum of the 18th Party Congress a couple of weeks ago. Party Congresses last for five years and Plenums (full meetings) are annual except for the first year of each Congress where there might be two or three full meetings.
Traditionally, the third Plenum is the one where new leadership lays out its long term goals and strategies and it has been third Plenums that were the basis for sweeping changes in China’s society and economy in the past 30 years. The mother of them all was the third Plenum in 1978 when Deng Xiaoping started China down the path to “Capitalism with Chinese Characteristics”. This was the first third Plenum since the ascension of Chinese leader Li Keqiang and expected to be particularly important.
Initial reporting from this Plenum showed disappointment, but I think that was due to most of it being written by journalists that don’t usually pay much attention to Beijing or understand its subtleties. Plenums look like consensus building exercises but are still very top down affairs. New leadership lays out a blueprint for the direction they think the party and the economy should be heading. Its not a process that delivers a bunch of new laws that come into effect the next day. Any major changes in direction require plenty of arm twisting that can take years to complete. We won’t really know how successful this Plenum is until after the fact.
If Li can impose the changes he’s calling for the effects could be large and wide ranging. Major reforms are proposed for State Owned Enterprises (“SOE”s), finance, factor pricing and a reform of the “hukou” (residency permit) system and rural land ownership.
There is a lot at stake, especially for resource investors. China has been the 800 pound gorilla in the room when it comes to commodity demand. That isn’t going to change any time soon but the way changes in China impact intensity of use for resources could have profound implications for metals and energy pricing.
The consensus deemed the proposed changes negative for commodities due to decreased reliance on heavy industry investment. This might true as there is over investment and over capacity in the heavy industrial sector. Some of that needs to go away, especially older and dirtier operations that have added to a massive pollution problem.
Changes to SOEs and factor pricing are linked. There is still a lot of state control in China and monopolistic pricing or state price controls in many sectors. This creates a lot of inefficiency and waste-and plenty of graft for those running state companies. A lot of overcapacity that needs to go is old state factories propped up by monopoly pricing and power relationships.
The process of cleaning up state companies has been through a few false starts. I think this may be the toughest part of the program for Beijing. There are a lot of powerful interests involved and, at best, winnowing out these companies will take years.
Reform on the finance and currency fronts has already started and the current Plenum is mainly reiterating they are serious about following the process to its conclusion. Ultimately that means the Yuan as a truly tradable, hopefully floating, currency. This has positive implications for commodities. Another reserve currency would weaken the US Dollar and could generate support for dollar denominated prices, much the way that the creation of the Euro did.
A trickier part of this process will be clearing out the deadwood in the Chinese banking sector. Again, a lot of this is either state owned or deadwood because of too much lending to state owned companies. The same political issues come into play but it’s a necessary change I think will happen. It won’t happen overnight either since it implies a major change of status (and maybe handcuffs) for a lot of current “insiders”. A cleanup in the literal sense is very necessary.
China has horrendous pollution problems and the citizenry is rapidly losing patience with the situation. Heavily polluting and physically dangerous workplaces will see more and more scrutiny and some will be shuttered. This might impact base metals as there are some pretty nasty small to medium sized operations in China that could be shut, and many “informal” ones that would be easy to close from a political standpoint.
Potentially, the most far reaching reforms are those proposed for the Hukou system and for rural land ownership. Hukou determines residency and severely restricts access to things like government services and housing outside of ones registered residency area. This is no small thing. There are at least 2-300 million people from rural China living and working in cities that have no official access to a host of government services. They also cannot legally buy property in the city where they work which may be hundreds or thousands of kilometres from their county of “residence”.
The system was devised to ensure enough workers stayed on the farms and didn’t overcrowd cities. I’m sure the Party liked the additional control it gave them after Tiananmen Square too. That helps explain why the law is still in effect.
For all the hang wringing about Chinese growth it’s still running above 7% and wages have been rising quickly. Due to the one child policy (also partially relaxed last week) there is a demographic trough coming. There are worries about having enough workers, or at least having the right ones, in some sectors. Removing travel and residency restrictions may solve that problem.
That change won’t happen overnight. Beijing has more than its share of control freaks in power. Many of them oppose loosening of Hukou laws on principle. These government owned companies are sinecures and piggy banks for Communist Party bigwigs and one of the biggest shareholders in many large SOEs is the Red Army itself. Not groups to be taken on lightly.
The final change proposed may be the most far reaching. The central government wants to push forward with rural land reform. Under current laws agricultural land is owned collectively. In practice that means farmers cannot sell or mortgage their land. County level officials haven’t had much trouble expropriating it though. Land sales have perhaps been the largest revenue source for this level of government.
Allowing private sale and/or mortgaging of rural property could generate huge amounts of demand. Coupled with a loosening of Hukou it could also make it much easier for migrants to buy property in cities and actually settle there. Farmers that are finally able to monetize some of the land their families have maintained for centuries could be a source of demand for everything from building materials and appliances to educations and health care.
This has actually been tried in a few select areas and it led to a lot of local building and some rationalization of farm holdings; talented farmers enlarging their holdings and others who wanted to move on selling out. It could have a big impact on large towns and smaller cities.
Sales of expropriated land are a main revenue source at the county level. Making these changes will mean Beijing will have to supply funding for a lot of services carried locally now. A doubling on taxed to SOEs is proposed to help cover this.
These changes are necessary to take the Chinese economy to the next level. If government improves medical care and education this could free up vast amounts of savings being and unleash a lot of pent up demand. Delivery of these services would create a lot of jobs too. It won’t be more steel mills or shipyards but I wouldn’t be too quick to assume a big drop in commodity demand. Anything that keeps China growing at 7%+ is going to generate more demand for everything, regardless of which sectors are favored.
Ω
The HRA–Journal and HRA-Special Delivery are independent publications produced and distributed by Stockwork Consulting Ltd, which is committed to providing timely and factual analysis of junior mining, resource, and other venture capital companies. Companies are chosen on the basis of a speculative potential for significant upside gains resulting from asset-based expansion. These are generally high-risk securities, and opinions contained herein are time and market sensitive. No statement or expression of opinion, or any other matter herein, directly or indirectly, is an offer, solicitation or recommendation to buy or sell any securities mentioned. While we believe all sources of information to be factual and reliable we in no way represent or guarantee the accuracy thereof, nor of the statements made herein. We do not receive or request compensation in any form in order to feature companies in these publications. We may, or may not, own securities and/or options to acquire securities of the companies mentioned herein. This document is protected by the copyright laws of Canada and the U.S. and may not be reproduced in any form for other than for personal use without the prior written consent of the publisher. This document may be quoted, in context, provided proper credit is given.
©2013 Stockwork Consulting Ltd. All Rights Reserved.
Published by Stockwork Consulting Ltd.
Box 85909, Phoenix AZ, 85071
Toll Free 1-877-528-3958

-
I know Mike is a very solid investor and respect his opinions very much. So if he says pay attention to this or that - I will.
~ Dale G.
-
I've started managing my own investments so view Michael's site as a one-stop shop from which to get information and perspectives.
~ Dave E.
-
Michael offers easy reading, honest, common sense information that anyone can use in a practical manner.
~ der_al.
-
A sane voice in a scrambled investment world.
~ Ed R.
Inside Edge Pro Contributors

Greg Weldon

Josef Schachter

Tyler Bollhorn

Ryan Irvine

Paul Beattie

Martin Straith

Patrick Ceresna

Mark Leibovit

James Thorne

Victor Adair